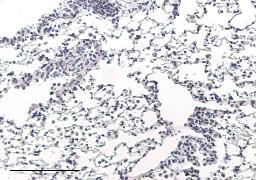
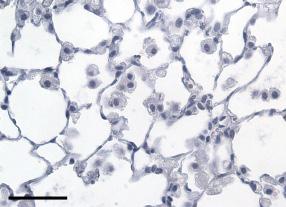
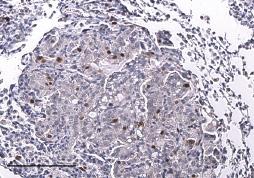
SUPPLEMENTARY FIGURE LEGENDS. atypical adenomatous hyperplasias (AAH); Grade II: adenomas; Grade III: adenocarcinomas;
|
|
|
- Leslie Rodger Davis
- 5 years ago
- Views:
Transcription
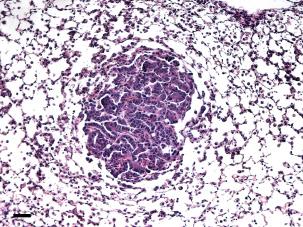
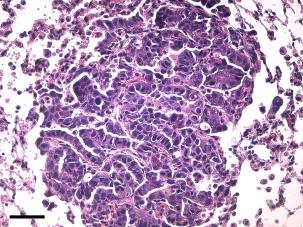
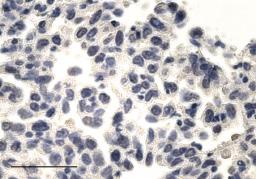
1 SUPPLEMENTARY FIGURE LEGENDS Supplementary Figure S1: Tumor grades in Ras G12D ; p53 / lung tumors. Representative histology (H&E) of K-Ras G12D ; p53 / lung tumors 13 weeks after tumor initiation. Grade I: atypical adenomatous hyperplasias (AAH); Grade II: adenomas; Grade III: adenocarcinomas; Grade IV: invasive adenocarcinomas. Size bar: 5 µm. Supplementary Figure S2: Deletion of Lin9 results in multiple mitotic defects. A) KPL cells were treated with 1nm 4-OHT for 72 hours and cells were fixed and stained with an anti-tubulin antibody (green). DNA was counterstained with Hoechst (blue). Deletion of Lin9 resulted in binucleated cells, multipolar spindles and cells with large multilobed nuclei. Size bar: 25 µm. B) Quantification of mitotic defects in KP and KPL cells upon deletion of Lin9 by treatment with 4-OHT for 6 days. Supplementary Figure S3: Myb-MuvB-dependent expression of mitotic kinesins in the human lung cancer cell line H23. A) B-MYB or LIN9 were depleted by RNAi in H23 cells. Expression of the indicated kinesins was analyzed by RT-qPCR. B) ChIP assay demonstrating direct binding of B-MYB and LIN9 to the promoters of kinesins but not to the GAPDH promoter in H23 cells. IgG was used as a control. Supplementary Figure S4: expression in lung adenocarcinomas. A) Immunohistochemistry staining of in lung tumors and adjacent normal lung tissue from LSL-Kras G12D ;p53 fl/fl mice 13 weeks after tumor initiation. Bar: 5 µm. B) NUSAP expression correlates with tumor grade. Expression of in grade 1 and grade 3 murine K-Ras G12 ; p53 / lung tumors was determined by immunohistochemistry. Left: Magnification 5 x. Bar: 15 µm; Right: Magnification: 2 x. Bar: 5 µm C) Quantification of and expression in murine lung tumors relative to tumor grade from grade 1 (see Supplemental Figure S1). 1
2 Supplementary Figure S5: Inducible knockdown of KIF23. Lung cancer cell lines stably expressing an inducible KIF23-specific shrna together with RFP were treated with the indicated concentrations of doxycycline. The expression of RFP was determined by microscopy. Supplementary Figure S6: Inducible knockdown of KIF23. Lung cancer cell lines stably expressing an inducible KIF23-specific shrna together with RFP were treated with the indicated concentrations of doxycycline. The expression of RFP was determined by FACS. Supplementary Figure S7: KIF23 is required for proliferation of lung cancer cell lines. A) The indicated NSCLC cell lines (non-shrna transfected controls or expressing the KIF23- specific shrnas) were cultured for 8 days with the indicated concentrations of doxycycline. Colonies were stained with crystal violet. B) Abnormal nuclei after depletion of KIF23. Bar: 25 µm. The indicated cell lines stably expressing the KIF23-specific shrna were treated with doxycycline for 4 days. Cells were fixed and stained with an anti-tubulin antibody (green). Nuclei were stained with Hoechst (blue). Bar: 25 µm. C) Knockdown of KIF23 in mouse NIH-3T3 cells by the KIF23-specific shrna was verified by RT-qPCR. 2
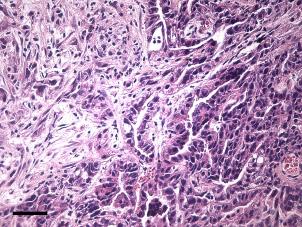
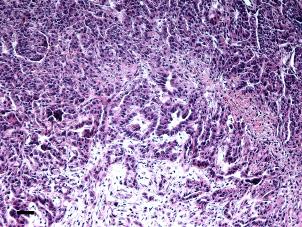
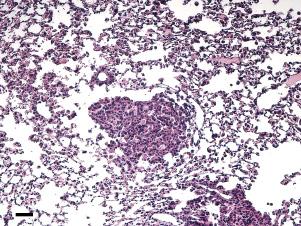
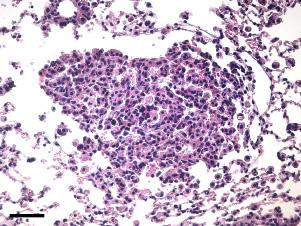

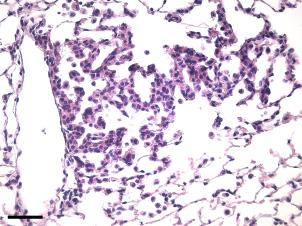
3 Supplementary Figure S1 1 x 2 x GI GII GIII GIV


 KPL2-Cre ER")
4 Supplementary Figure S2 A -OHT +OHT binucleated multipolar spindle multilobed nuclei tubulin, nuclei B % of cells % 97 % % of cells % 9 1 % 7 % 1 % 9 % of cells % 1 % 61 % 37 % % of cells % 1 % 43 % 11 % 47 % mega-multilobed binucleate mononucleate - OHT + OHT - OHT + OHT - OHT + OHT - OHT + OHT KP1-Cre ER (Lin9 +/+ ) KP2-Cre ER (Lin9 +/+ ) KPL1-Cre ER (Lin9 fl/fl ) KPL2-Cre ER (Lin9 fl/fl )
5 Supplementary Figure S3 A relative mrna expression ctrl. sirna LIN9 sirna B-MYB sirna B enrichment (% realtive to Input ) IgG LIN9 B-MYB KIF23/ MKLP1 KIF2A/ MKLP2 KIF14 KIF4A KIF2C/ MCAK KIFC1/ HSET GAPDH KIF23/ KIF2A/ KIF14 MKLP1 MKLP2 KIF4A KIF2C/ MCAK KIFC1/ HSET
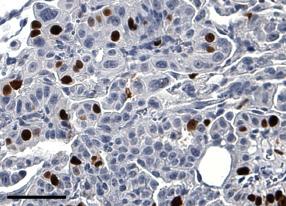
6 Supplementary Figure S4 A tumor normal B 1 x 2 x grade 1 C Tumors (%) n=7 n=54 n=57 n=5 negative positive grade Grade


7 Supplementary Figure S5 H46 Brightfield RFP merge H23 Brightfield RFP merge HOP62 Brightfield RFP merge HOP92 Brightfield RFP merge
8 Supplementary Figure S6 H46 H23 HOP62 HOP RFP-positive cells (%) H46 H23 HOP62 HOP92 doxycycline

")


9 Supplementary Figure S7 A doxycycline (µg/ml) doxycycline (µg/ml) H46 H23 HOP62 HOP92 control shrna KIF23 B -doxy +doxy -doxy +doxy H23 HOP92 H46 HOP62 C relative KIF23 mrna expression control shrna KIF23 shrna
stability and tumor suppression
 Supplementary information The stress kinase MKK7 couples oncogenic stress to p53 stability and tumor suppression Daniel Schramek 1, Athanassios Kotsinas 2, Arabella Meixner 1, Teiji Wada 1, Ulrich Elling
EPIGENETIC RE-EXPRESSION OF HIF-2α SUPPRESSES SOFT TISSUE SARCOMA GROWTH
 EPIGENETIC RE-EXPRESSION OF HIF-2α SUPPRESSES SOFT TISSUE SARCOMA GROWTH Supplementary Figure 1. Supplementary Figure 1. Characterization of KP and KPH2 autochthonous UPS tumors. a) Genotyping of KPH2
(A) RT-PCR for components of the Shh/Gli pathway in normal fetus cell (MRC-5) and a
 RT-PCR for components of the Shh/Gli pathway in normal fetus cell (MRC-5) and a") Supplementary figure legends Supplementary Figure 1. Expression of Shh signaling components in a panel of gastric cancer. (A) RT-PCR for components of the Shh/Gli pathway in normal fetus cell (MRC-5) and
Supplementary figure legends Supplementary Figure 1. Expression of Shh signaling components in a panel of gastric cancer. (A) RT-PCR for components of the Shh/Gli pathway in normal fetus cell (MRC-5) and
Supplementary Figure 1
 Supplementary Figure 1 Kif1a RNAi effect on basal progenitor differentiation Related to Figure 2. Representative confocal images of the VZ and SVZ of rat cortices transfected at E16 with scrambled or Kif1a
This is the author s final accepted version.
 Iltzsche, F. et al. (217) An important role for Myb-MuvB and its target gene KIF23 in a mouse model of lung adenocarcinoma. Oncogene, 36(1), pp. 11-121. (doi:1.138/onc.216.181) This is the author s final
Supplementary Figure 1. A. Bar graph representing the expression levels of the 19 indicated genes in the microarrays analyses comparing human lung
 Supplementary Figure 1. A. Bar graph representing the expression levels of the 19 indicated genes in the microarrays analyses comparing human lung immortalized broncho-epithelial cells (AALE cells) expressing
T H E J O U R N A L O F C E L L B I O L O G Y
 Supplemental material Díaz et al., http://www.jcb.org/cgi/content/full/jcb.201209151/dc1 T H E J O U R N A L O F C E L L B I O L O G Y Figure S1. Hypoxia induces invadopodia formation in different epithelial
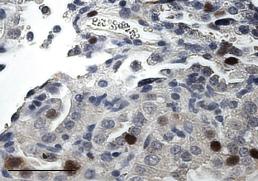
Supplementary Figure 1: GFAP positive nerves in patients with adenocarcinoma of
 SUPPLEMENTARY FIGURES AND MOVIE LEGENDS Supplementary Figure 1: GFAP positive nerves in patients with adenocarcinoma of the pancreas. (A) Images of nerves stained for GFAP (green), S100 (red) and DAPI
SUPPLEMENTARY LEGENDS...
 TABLE OF CONTENTS SUPPLEMENTARY LEGENDS... 2 11 MOVIE S1... 2 FIGURE S1 LEGEND... 3 FIGURE S2 LEGEND... 4 FIGURE S3 LEGEND... 5 FIGURE S4 LEGEND... 6 FIGURE S5 LEGEND... 7 FIGURE S6 LEGEND... 8 FIGURE
fl/+ KRas;Atg5 fl/+ KRas;Atg5 fl/fl KRas;Atg5 fl/fl KRas;Atg5 Supplementary Figure 1. Gene set enrichment analyses. (a) (b)
 (b)") KRas;At KRas;At KRas;At KRas;At a b Supplementary Figure 1. Gene set enrichment analyses. (a) GO gene sets (MSigDB v3. c5) enriched in KRas;Atg5 fl/+ as compared to KRas;Atg5 fl/fl tumors using gene set
KRas;At KRas;At KRas;At KRas;At a b Supplementary Figure 1. Gene set enrichment analyses. (a) GO gene sets (MSigDB v3. c5) enriched in KRas;Atg5 fl/+ as compared to KRas;Atg5 fl/fl tumors using gene set
Supplemental Figure S1. RANK expression on human lung cancer cells.
 Supplemental Figure S1. RANK expression on human lung cancer cells. (A) Incidence and H-Scores of RANK expression determined from IHC in the indicated primary lung cancer subgroups. The overall expression
Supplemental Figure 1. Western blot analysis indicated that MIF was detected in the fractions of
 Supplemental Figure Legends Supplemental Figure 1. Western blot analysis indicated that was detected in the fractions of plasma membrane and cytosol but not in nuclear fraction isolated from Pkd1 null
Supplemental Table S1
 Supplemental Table S. Tumorigenicity and metastatic potential of 44SQ cell subpopulations a Tumorigenicity b Average tumor volume (mm ) c Lung metastasis d CD high /4 8. 8/ CD low /4 6./ a Mice were injected
(a) Significant biological processes (upper panel) and disease biomarkers (lower panel)
 Significant biological processes (upper panel) and disease biomarkers (lower panel)") Supplementary Figure 1. Functional enrichment analyses of secretomic proteins. (a) Significant biological processes (upper panel) and disease biomarkers (lower panel) 2 involved by hrab37-mediated secretory
Supplementary Figure 1. Functional enrichment analyses of secretomic proteins. (a) Significant biological processes (upper panel) and disease biomarkers (lower panel) 2 involved by hrab37-mediated secretory
Supplementary Figures
 Supplementary Figures Supplementary Figure 1 Characterization of stable expression of GlucB and sshbira in the CT26 cell line (a) Live cell imaging of stable CT26 cells expressing green fluorescent protein
Supplementary Figure 1: STAT3 suppresses Kras-induced lung tumorigenesis
 Supplementary Figure 1: STAT3 suppresses Kras-induced lung tumorigenesis (a) Immunohistochemical (IHC) analysis of tyrosine 705 phosphorylation status of STAT3 (P- STAT3) in tumors and stroma (all-time
Supplementary Figures
 Supplementary Figures Supplementary Figure 1 DOT1L regulates the expression of epithelial and mesenchymal markers. (a) The expression levels and cellular localizations of EMT markers were confirmed by
Effects of UBL5 knockdown on cell cycle distribution and sister chromatid cohesion
 Supplementary Figure S1. Effects of UBL5 knockdown on cell cycle distribution and sister chromatid cohesion A. Representative examples of flow cytometry profiles of HeLa cells transfected with indicated
MII. Supplement Figure 1. CapZ β2. Merge. 250ng. 500ng DIC. Merge. Journal of Cell Science Supplementary Material. GFP-CapZ β2 DNA
 A GV GVBD MI DNA CapZ β2 CapZ β2 Merge B DIC GFP-CapZ β2 Merge CapZ β2-gfp 250ng 500ng Supplement Figure 1. MII A early MI late MI Control RNAi CapZαβ DNA Actin Tubulin B Phalloidin Intensity(A.U.) n=10
Inhibition of TGFβ enhances chemotherapy action against triple negative breast cancer by abrogation of
 SUPPLEMENTAL DATA Inhibition of TGFβ enhances chemotherapy action against triple negative breast cancer by abrogation of cancer stem cells and interleukin-8 Neil E. Bhola 1, Justin M. Balko 1, Teresa C.
SUPPLEMENTARY FIGURE LEGENDS
 SUPPLEMENTARY FIGURE LEGENDS Supplementary Figure 1. Hippocampal sections from new-born Pten+/+ and PtenFV/FV pups were stained with haematoxylin and eosin (H&E) and were imaged at (a) low and (b) high
SUPPLEMENTARY FIGURES AND TABLES
 SUPPLEMENTARY FIGURES AND TABLES Supplementary Figure S1: CaSR expression in neuroblastoma models. A. Proteins were isolated from three neuroblastoma cell lines and from the liver metastasis of a MYCN-non
SUPPLEMENTAL EXPERIMENTAL PROCEDURES
 SUPPLEMENTAL EXPERIMENTAL PROCEDURES Crystal violet assay Cells were seeded in 24-well plates and cultured in media supplemented with % FBS for 7 days. Media were then removed, plates were briefly washed
Figure S1. HP1α localizes to centromeres in mitosis and interacts with INCENP. (A&B) HeLa
 HeLa") SUPPLEMENTARY FIGURES Figure S1. HP1α localizes to centromeres in mitosis and interacts with INCENP. (A&B) HeLa tet-on cells that stably express HP1α-CFP, HP1β-CFP, or HP1γ-CFP were monitored with livecell
SUPPLEMENTARY FIGURES Figure S1. HP1α localizes to centromeres in mitosis and interacts with INCENP. (A&B) HeLa tet-on cells that stably express HP1α-CFP, HP1β-CFP, or HP1γ-CFP were monitored with livecell
supplementary information
 DOI: 10.1038/ncb1875 Figure S1 (a) The 79 surgical specimens from NSCLC patients were analysed by immunohistochemistry with an anti-p53 antibody and control serum (data not shown). The normal bronchi served
Soft Agar Assay. For each cell pool, 100,000 cells were resuspended in 0.35% (w/v)
") SUPPLEMENTARY MATERIAL AND METHODS Soft Agar Assay. For each cell pool, 100,000 cells were resuspended in 0.35% (w/v) top agar (LONZA, SeaKem LE Agarose cat.5004) and plated onto 0.5% (w/v) basal agar.
SUPPLEMENTARY MATERIAL AND METHODS Soft Agar Assay. For each cell pool, 100,000 cells were resuspended in 0.35% (w/v) top agar (LONZA, SeaKem LE Agarose cat.5004) and plated onto 0.5% (w/v) basal agar.
Breeding scheme, transgenes, histological analysis and site distribution of SB-mutagenized osteosarcoma.
 Supplementary Figure 1 Breeding scheme, transgenes, histological analysis and site distribution of SB-mutagenized osteosarcoma. (a) Breeding scheme. R26-LSL-SB11 homozygous mice were bred to Trp53 LSL-R270H/+
(a) Schematic diagram of the FS mutation of UVRAG in exon 8 containing the highly instable
 Schematic diagram of the FS mutation of UVRAG in exon 8 containing the highly instable") Supplementary Figure 1. Frameshift (FS) mutation in UVRAG. (a) Schematic diagram of the FS mutation of UVRAG in exon 8 containing the highly instable A 10 DNA repeat, generating a premature stop codon
Supplementary Figure 1. Frameshift (FS) mutation in UVRAG. (a) Schematic diagram of the FS mutation of UVRAG in exon 8 containing the highly instable A 10 DNA repeat, generating a premature stop codon
Supplementary Figures
 Supplementary Figures Supplementary Figure 1. Confirmation of Dnmt1 conditional knockout out mice. a, Representative images of sorted stem (Lin - CD49f high CD24 + ), luminal (Lin - CD49f low CD24 + )
Supplementary Figure 1: si-craf but not si-braf sensitizes tumor cells to radiation.
 Supplementary Figure 1: si-craf but not si-braf sensitizes tumor cells to radiation. (a) Embryonic fibroblasts isolated from wildtype (WT), BRAF -/-, or CRAF -/- mice were irradiated (6 Gy) and DNA damage
Supplemental Information
 Supplemental Information Tobacco-specific Carcinogen Induces DNA Methyltransferases 1 Accumulation through AKT/GSK3β/βTrCP/hnRNP-U in Mice and Lung Cancer patients Ruo-Kai Lin, 1 Yi-Shuan Hsieh, 2 Pinpin
SUPPLEMENTARY FIGURES
 SUPPLEMENTARY FIGURES 1 Supplementary Figure 1, Adult hippocampal QNPs and TAPs uniformly express REST a-b) Confocal images of adult hippocampal mouse sections showing GFAP (green), Sox2 (red), and REST
Supplemental Figure 1. Intracranial transduction of a modified ptomo lentiviral vector in the mouse
 Supplemental figure legends Supplemental Figure 1. Intracranial transduction of a modified ptomo lentiviral vector in the mouse hippocampus targets GFAP-positive but not NeuN-positive cells. (A) Stereotaxic
(A) Cells grown in monolayer were fixed and stained for surfactant protein-c (SPC,
 Cells grown in monolayer were fixed and stained for surfactant protein-c (SPC,") Supplemental Figure Legends Figure S1. Cell line characterization (A) Cells grown in monolayer were fixed and stained for surfactant protein-c (SPC, green) and co-stained with DAPI to visualize the nuclei.
Supplemental Figure Legends Figure S1. Cell line characterization (A) Cells grown in monolayer were fixed and stained for surfactant protein-c (SPC, green) and co-stained with DAPI to visualize the nuclei.
klp-18 (RNAi) Control. supplementary information. starting strain: AV335 [emb-27(g48); GFP::histone; GFP::tubulin] bleach
![klp-18 (RNAi) Control. supplementary information. starting strain: AV335 [emb-27(g48); GFP::histone; GFP::tubulin] bleach](/thumbs/91/104639484.jpg "klp-18 (RNAi) Control. supplementary information. starting strain: AV335 [emb-27(g48); GFP::histone; GFP::tubulin] bleach") DOI: 10.1038/ncb1891 A. starting strain: AV335 [emb-27(g48); GFP::histone; GFP::tubulin] bleach embryos let hatch overnight transfer to RNAi plates; incubate 5 days at 15 C RNAi food L1 worms adult worms
DOI: 10.1038/ncb1891 A. starting strain: AV335 [emb-27(g48); GFP::histone; GFP::tubulin] bleach embryos let hatch overnight transfer to RNAi plates; incubate 5 days at 15 C RNAi food L1 worms adult worms
Figure S1. (A) Schematic diagram of dnrar transgene allele. (B) X-Gal staining of testis from
 Schematic diagram of dnrar transgene allele. (B) X-Gal staining of testis from") Figure S1. (A) Schematic diagram of dnrar transgene allele. (B) X-Gal staining of testis from germ cell mutants (dnrar flox/flox, Stra8-Cre +, RARElacZ) (A ), controls (dnrar flox/flox, RARElacZ) (B ),
Figure S1. (A) Schematic diagram of dnrar transgene allele. (B) X-Gal staining of testis from germ cell mutants (dnrar flox/flox, Stra8-Cre +, RARElacZ) (A ), controls (dnrar flox/flox, RARElacZ) (B ),
Supplementary material. Supplementary Figure legends
 Supplementary material Supplementary Figure legends Supplementary Figure 1: Senescence-associated proliferation stop in response to oncogenic N-RAS expression Proliferation of NHEM cells without (ctrl.)
Supplementary Table 1. The primers used for quantitative RT-PCR. Gene name Forward (5 > 3 ) Reverse (5 > 3 )
 Reverse (5 > 3 )") 770 771 Supplementary Table 1. The primers used for quantitative RT-PCR. Gene name Forward (5 > 3 ) Reverse (5 > 3 ) Human CXCL1 GCGCCCAAACCGAAGTCATA ATGGGGGATGCAGGATTGAG PF4 CCCCACTGCCCAACTGATAG TTCTTGTACAGCGGGGCTTG
770 771 Supplementary Table 1. The primers used for quantitative RT-PCR. Gene name Forward (5 > 3 ) Reverse (5 > 3 ) Human CXCL1 GCGCCCAAACCGAAGTCATA ATGGGGGATGCAGGATTGAG PF4 CCCCACTGCCCAACTGATAG TTCTTGTACAGCGGGGCTTG
Supplementary Information and Figure legends
 Supplementary Information and Figure legends Table S1. Primers for quantitative RT-PCR Target Sequence (5 -> 3 ) Target Sequence (5 -> 3 ) DAB2IP F:TGGACGATGTGCTCTATGCC R:GGATGGTGATGGTTTGGTAG Snail F:CCTCCCTGTCAGATGAGGAC
Supplemental Information. Metabolic Maturation during Muscle Stem Cell. Differentiation Is Achieved by mir-1/133a-mediated
 Cell Metabolism, Volume 27 Supplemental Information Metabolic Maturation during Muscle Stem Cell Differentiation Is Achieved by mir-1/133a-mediated Inhibition of the Dlk1-Dio3 Mega Gene Cluster Stas Wüst,
Supplemental Materials. STK16 regulates actin dynamics to control Golgi organization and cell cycle
 Supplemental Materials STK16 regulates actin dynamics to control Golgi organization and cell cycle Juanjuan Liu 1,2,3, Xingxing Yang 1,3, Binhua Li 1, Junjun Wang 1,2, Wenchao Wang 1, Jing Liu 1, Qingsong
Supplementary Figure 1. Deletion of Smad3 prevents B16F10 melanoma invasion and metastasis in a mouse s.c. tumor model.
 A B16F1 s.c. Lung LN Distant lymph nodes Colon B B16F1 s.c. Supplementary Figure 1. Deletion of Smad3 prevents B16F1 melanoma invasion and metastasis in a mouse s.c. tumor model. Highly invasive growth
Supplementary Figure 1. Characterization of ALDH-positive cell population in MCF-7 cells. (a) Expression level of stem cell markers in MCF-7 cells or
 Expression level of stem cell markers in MCF-7 cells or") Supplementary Figure 1. Characterization of ALDH-positive cell population in MCF-7 cells. (a) Expression level of stem cell markers in MCF-7 cells or ALDH-positive cell population by qpcr. Data represent
Supplementary Figure 1. Characterization of ALDH-positive cell population in MCF-7 cells. (a) Expression level of stem cell markers in MCF-7 cells or ALDH-positive cell population by qpcr. Data represent
Postn MCM Smad2 fl/fl Postn MCM Smad3 fl/fl Postn MCM Smad2/3 fl/fl. Postn MCM. Tgfbr1/2 fl/fl TAC
 A Smad2 fl/fl Smad3 fl/fl Smad2/3 fl/fl Tgfbr1/2 fl/fl 1. mm B Tcf21 MCM Tcf21 MCM Smad3 fl/fl Tcf21 MCM Smad2/3 fl/fl Tcf21 MCM Tgfbr1/2 fl/fl αmhc MCM C 1. mm 1. mm D Smad2 fl/fl Smad3 fl/fl Smad2/3
Supplementary Figure 1 Induction of cellular senescence and isolation of exosome. a to c, Pre-senescent primary normal human diploid fibroblasts
 Supplementary Figure 1 Induction of cellular senescence and isolation of exosome. a to c, Pre-senescent primary normal human diploid fibroblasts (TIG-3 cells) were rendered senescent by either serial passage
SUPPLEMENTARY INFORMATION
 DOI:.38/ncb3399 a b c d FSP DAPI 5mm mm 5mm 5mm e Correspond to melanoma in-situ Figure a DCT FSP- f MITF mm mm MlanaA melanoma in-situ DCT 5mm FSP- mm mm mm mm mm g melanoma in-situ MITF MlanaA mm mm
Supplementary Figure S1
 Supplementary Figure S1 Supplementary Figure S1. PARP localization patterns using GFP-PARP and PARP-specific antibody libraries GFP-PARP localization in non-fixed (A) and formaldehyde fixed (B) GFP-PARPx
Prolonged mitotic arrest induces a caspase-dependent DNA damage
 SUPPLEMENTARY INFORMATION Prolonged mitotic arrest induces a caspase-dependent DNA damage response at telomeres that determines cell survival Karolina O. Hain, Didier J. Colin, Shubhra Rastogi, Lindsey
Supplementary information. The Light Intermediate Chain 2 Subpopulation of Dynein Regulates Mitotic. Spindle Orientation
 Supplementary information The Light Intermediate Chain 2 Subpopulation of Dynein Regulates Mitotic Spindle Orientation Running title: Dynein LICs distribute mitotic functions. Sagar Mahale a, d, *, Megha
SUPPLEMENTARY INFORMATION
 doi:10.1038/nature12652 Supplementary Figure 1. PRDM16 interacts with endogenous EHMT1 in brown adipocytes. Immunoprecipitation of PRDM16 complex by flag antibody (M2) followed by Western blot analysis
Supplemental Materials Molecular Biology of the Cell
 Supplemental Materials Molecular Biology of the Cell Garcia-Alvarez et al. Supplementary Figure Legends Figure S1.Expression and RNAi-mediated silencing of STIM1 in hippocampal neurons (DIV, days in vitro).
Supplementary Figure 1. Validation of astrocytes. Primary astrocytes were
 Supplementary Figure 1. Validation of astrocytes. Primary astrocytes were separated from the glial cultures using a mild trypsinization protocol. Anti-glial fibrillary acidic protein (GFAP) immunofluorescent
Supplementary Figures
 Supplementary Figures Supplementary Figure 1 Correlation between LKB1 and YAP expression in human lung cancer samples. (a) Representative photos showing LKB1 and YAP immunohistochemical staining in human
Samali A Figure S1.
 Deegan S, Saveljeva S, Logue SE, Pakos-Zebrucka K, Gupta S, Vandenabeele P, Bertrand MJ,Samali A. (2014) Deficiency in the mitochondrial apoptotic pathway reveals the toxic potential of autophagy under
condition. Left panel, the HCT-116 cells were lysed with RIPA buffer containing 0.1%
 FIGURE LEGENDS Supplementary Fig 1 (A) sumoylation pattern detected under denaturing condition. Left panel, the HCT-116 cells were lysed with RIPA buffer containing 0.1% SDS in the presence and absence
Dynamic Interaction of Stress Granule, DDX3X and IKK-α Mediates Multiple Functions in
 Dynamic Interaction of Stress Granule, and Mediates Multiple Functions in Hepatitis C Virus Infection Véronique Pène, Qisheng Li#, Catherine Sodroski, Ching-Sheng Hsu, T. Jake Liang# Liver Diseases Branch,
File Name: Supplementary Information Description: Supplementary Figures and Supplementary Tables. File Name: Peer Review File Description:
 File Name: Supplementary Information Description: Supplementary Figures and Supplementary Tables File Name: Peer Review File Description: Primer Name Sequence (5'-3') AT ( C) RT-PCR USP21 F 5'-TTCCCATGGCTCCTTCCACATGAT-3'
Supplementary Fig. 1. GPRC5A post-transcriptionally down-regulates EGFR expression. (a) Plot of the changes in steady state mrna levels versus
 Plot of the changes in steady state mrna levels versus") Supplementary Fig. 1. GPRC5A post-transcriptionally down-regulates EGFR expression. (a) Plot of the changes in steady state mrna levels versus changes in corresponding proteins between wild type and Gprc5a-/-
Supplementary Fig. 1. GPRC5A post-transcriptionally down-regulates EGFR expression. (a) Plot of the changes in steady state mrna levels versus changes in corresponding proteins between wild type and Gprc5a-/-
Supplemental Information. Menin Deficiency Leads to Depressive-like. Behaviors in Mice by Modulating. Astrocyte-Mediated Neuroinflammation
 Neuron, Volume 100 Supplemental Information Menin Deficiency Leads to Depressive-like Behaviors in Mice by Modulating Astrocyte-Mediated Neuroinflammation Lige Leng, Kai Zhuang, Zeyue Liu, Changquan Huang,
SUPPLEMENTARY INFORMATION
 1. Supplementary Figures and Legends Supplementary Fig. 1. S1P-mediated transcriptional regulation of integrins expressed in OP/monocytoid cells. Real-time quantitative PCR analyses of mrna for two integrins,
Supplementary information. MARCH8 inhibits HIV-1 infection by reducing virion incorporation of envelope glycoproteins
 Supplementary information inhibits HIV-1 infection by reducing virion incorporation of envelope glycoproteins Takuya Tada, Yanzhao Zhang, Takayoshi Koyama, Minoru Tobiume, Yasuko Tsunetsugu-Yokota, Shoji
Supplementary Figure 1. Genotyping strategies for Mcm3 +/+, Mcm3 +/Lox and Mcm3 +/- mice and luciferase activity in Mcm3 +/Lox mice. A.
 Supplementary Figure 1. Genotyping strategies for Mcm3 +/+, Mcm3 +/Lox and Mcm3 +/- mice and luciferase activity in Mcm3 +/Lox mice. A. Upper part, three-primer PCR strategy at the Mcm3 locus yielding
Supplementary Information
 Supplementary Information Supplementary Figure 1. Effect of mir mimics and anti-mirs on DTPs a, Representative fluorescence microscopy images of GFP vector control or mir mimicexpressing parental and DTP
Supplementary Figure 1
 Supplementary Figure 1 14 12 SEM4C PLXN2 8 SEM4C C 3 Cancer Cell Non Cancer Cell Expression 1 8 6 6 4 log2 ratio Expression 2 1 4 2 2 p value.1 D Supplementary Figure 1. Expression of Sema4C and Plexin2
SUPPLEMENTARY INFORMATION
 DOI: 1.138/ncb222 / b. WB anti- WB anti- ulin Mitotic index (%) 14 1 6 2 T (h) 32 48-1 1 2 3 4 6-1 4 16 22 28 3 33 e. 6 4 2 Time (min) 1-6- 11-1 > 1 % cells Figure S1 depletion leads to mitotic defects
Irf1 fold changes (D) 24h 48h. p-p65. t-p65. p-irf3. t-irf3. β-actin SKO TKO 100% 80% 60% 40% 20%
 24h 48h. p-p65. t-p65. p-irf3. t-irf3. β-actin SKO TKO 100% 80% 60% 40% 20%") Irf7 Fold changes 3 1 Irf1 fold changes 3 1 8h h 8h 8h h 8h p-p6 p-p6 t-p6 p-irf3 β-actin p-irf3 t-irf3 β-actin TKO TKO STKO (E) (F) TKO TKO % of p6 nuclear translocation % % 1% 1% % % p6 TKO % of IRF3
Irf7 Fold changes 3 1 Irf1 fold changes 3 1 8h h 8h 8h h 8h p-p6 p-p6 t-p6 p-irf3 β-actin p-irf3 t-irf3 β-actin TKO TKO STKO (E) (F) TKO TKO % of p6 nuclear translocation % % 1% 1% % % p6 TKO % of IRF3
Supplemental Figure 1. (A) The localization of Cre DNA recombinase in the testis of Cyp19a1-Cre mice was detected by immunohistchemical analyses
 The localization of Cre DNA recombinase in the testis of Cyp19a1-Cre mice was detected by immunohistchemical analyses") Supplemental Figure 1. (A) The localization of Cre DNA recombinase in the testis of Cyp19a1-Cre mice was detected by immunohistchemical analyses using an anti-cre antibody; testes at 1 week (left panel),
Supplemental Figure 1. (A) The localization of Cre DNA recombinase in the testis of Cyp19a1-Cre mice was detected by immunohistchemical analyses using an anti-cre antibody; testes at 1 week (left panel),
SUPPLEMENTARY INFORMATION
 doi:10.1038/nature12215 Supplementary Figure 1. The effects of full and dissociated GR agonists in supporting BFU-E self-renewal divisions. BFU-Es were cultured in self-renewal medium with indicated GR
SUPPLEMENTARY INFORMATION
 Supplementary Information included with Nature MS 2008-02-01484B by Colantonio et al., entitled The dynein regulatory complex is required for ciliary motility and otolith biogenesis in the inner ear. This
hexahistidine tagged GRP78 devoid of the KDEL motif (GRP78-His) on SDS-PAGE. This
 on SDS-PAGE. This") SUPPLEMENTAL FIGURE LEGEND Fig. S1. Generation and characterization of. (A) Coomassie staining of soluble hexahistidine tagged GRP78 devoid of the KDEL motif (GRP78-His) on SDS-PAGE. This protein was expressed
SUPPLEMENTAL FIGURE LEGEND Fig. S1. Generation and characterization of. (A) Coomassie staining of soluble hexahistidine tagged GRP78 devoid of the KDEL motif (GRP78-His) on SDS-PAGE. This protein was expressed
Supplementary Figure 1. a. b. Relative cell viability. Nature Genetics: doi: /ng SCR shyap1-1 shyap
 Supplementary Figure 1. a. b. p-value for depletion in vehicle (DMSO) 1e-05 1e-03 1e-01 1 0 1000 2000 3000 4000 5000 Genes log2 normalized shrna counts in T0 0 2 4 6 8 sh1 shluc 0 2 4 6 8 log2 normalized
Supplementary Figure 1
 A B D Relative TAp73 mrna p73 Supplementary Figure 1 25 2 15 1 5 p63 _-tub. MDA-468 HCC1143 HCC38 SUM149 MDA-468 HCC1143 HCC38 SUM149 HCC-1937 MDA-MB-468 ΔNp63_ TAp73_ TAp73β E C Relative ΔNp63 mrna TAp73
a) Primary cultures derived from the pancreas of an 11-week-old Pdx1-Cre; K-MADM-p53
 Primary cultures derived from the pancreas of an 11-week-old Pdx1-Cre; K-MADM-p53") 1 2 3 4 5 6 7 8 9 10 Supplementary Figure 1. Induction of p53 LOH by MADM. a) Primary cultures derived from the pancreas of an 11-week-old Pdx1-Cre; K-MADM-p53 mouse revealed increased p53 KO/KO (green,
1 2 3 4 5 6 7 8 9 10 Supplementary Figure 1. Induction of p53 LOH by MADM. a) Primary cultures derived from the pancreas of an 11-week-old Pdx1-Cre; K-MADM-p53 mouse revealed increased p53 KO/KO (green,
effects on organ development. a-f, Eye and wing discs with clones of ε j2b10 show no
 Supplementary Figure 1. Loss of function clones of 14-3-3 or 14-3-3 show no significant effects on organ development. a-f, Eye and wing discs with clones of 14-3-3ε j2b10 show no obvious defects in Elav
Loss of Calreticulin Uncovers a Critical Role for Calcium in Regulating Cellular Lipid Homeostasis
 SUPPLEMENTARY MATERIAL Loss of Calreticulin Uncovers a Critical Role for Calcium in Regulating Cellular Lipid Homeostasis Wen-An Wang 1, Wen-Xin Liu 1, Serpen Durnaoglu 2, Sun-Kyung Lee 2, Jihong Lian
Supplementary Figure 1. Characterization of NMuMG-ErbB2 and NIC breast cancer cells expressing shrnas targeting LPP. NMuMG-ErbB2 cells (a) and NIC
 and NIC") Supplementary Figure 1. Characterization of NMuMG-ErbB2 and NIC breast cancer cells expressing shrnas targeting LPP. NMuMG-ErbB2 cells (a) and NIC cells (b) were engineered to stably express either a LucA-shRNA
Supplementary Figure 1. Characterization of NMuMG-ErbB2 and NIC breast cancer cells expressing shrnas targeting LPP. NMuMG-ErbB2 cells (a) and NIC cells (b) were engineered to stably express either a LucA-shRNA
Hopkins University, Howard Hughes Medical Institute, USA) (27). Cells were maintained in DMEM
 (27). Cells were maintained in DMEM") Supplementary Materials and Methods Cell Culture HCT116 (TP53 +/+ and TP53 -/- ) cells were provided by Dr. Bert Vogelstein (Johns Hopkins University, Howard Hughes Medical Institute, USA) (27). Cells
Supplementary Materials and Methods Cell Culture HCT116 (TP53 +/+ and TP53 -/- ) cells were provided by Dr. Bert Vogelstein (Johns Hopkins University, Howard Hughes Medical Institute, USA) (27). Cells
SUPPLEMENTARY FIGURES
 SUPPLEMENTARY FIGURES Supplementary Figure S1: Fibroblast-induced elongation of cancer cells requires direct contact with living fibroblasts. A. Representative images of HT29-GFP cultured in the presence
Supplementary Figures
 Supplementary Figures Supplementary Figure 1 Increased ABHD5 expression in human colon cancer associated macrophages. (a) Murine peritoneal macrophages were treated with regular culture medium (Ctrl) or
Type of file: PDF Size of file: 0 KB Title of file for HTML: Supplementary Information Description: Supplementary Figures
 Type of file: PDF Size of file: 0 KB Title of file for HTML: Supplementary Information Description: Supplementary Figures Supplementary Figure 1 mir-128-3p is highly expressed in chemoresistant, metastatic
Supplementary Information Supplementary Fig. 1. Elevated Usp9x in melanoma and NRAS mutant melanoma cells are dependent on NRAS for 3D growth.
 Supplementary Information Supplementary Fig. 1. Elevated Usp9x in melanoma and NRAS mutant melanoma cells are dependent on NRAS for 3D growth. a. Immunoblot for Usp9x protein in NRAS mutant melanoma cells
Nature Biotechnology: doi: /nbt Supplementary Figure 1
 Supplementary Figure 1 Overview of the transplant procedure and supplementary data to Figure 1. a. Under isofluorane anesthesia, the lumen of the colon is washed by a gentle PBS enema. b. Using a p200
SUPPLEMENTARY FIGURES
 SUPPLEMENTARY FIGURES Supplementary Figure 1. (A) Left, western blot analysis of ISGylated proteins in Jurkat T cells treated with 1000U ml -1 IFN for 16h (IFN) or left untreated (CONT); right, western
Supplementary Figure 1. Repression of hepcidin expression in the liver of mice treated with
 Supplementary Figure 1. Repression of hepcidin expression in the liver of mice treated with DMN Immunohistochemistry for hepcidin and H&E staining (left). qrt-pcr assays for hepcidin in the liver (right).
SOPten flox/flox (KO) Pten flox/flox (WT) flox allele 6.0 kb. Pten. Actin. ! allele 2.3 kb. Supplementary Figure S1. Yanagi, et al.
 Pten flox/flox (WT) flox allele 6.0 kb. Pten. Actin. ! allele 2.3 kb. Supplementary Figure S1. Yanagi, et al.") s1 A Pten flox/flox () SOPten flox/flox () flox allele 6. kb B Pten flox/flox () SOPten flox/flox () Pten Actin! allele 2.3 kb Supplementary Figure S1. Yanagi, et al. A B BrdU BrdU positive cells ( ) 3
s1 A Pten flox/flox () SOPten flox/flox () flox allele 6. kb B Pten flox/flox () SOPten flox/flox () Pten Actin! allele 2.3 kb Supplementary Figure S1. Yanagi, et al. A B BrdU BrdU positive cells ( ) 3
Nature Neuroscience: doi: /nn Supplementary Figure 1
 Supplementary Figure 1 EGFR inhibition activates signaling pathways (a-b) EGFR inhibition activates signaling pathways (a) U251EGFR cells were treated with erlotinib (1µM) for the indicated times followed
Supplementary Figures
 Supplementary Figures Supplementary Fig. 1. Galectin-3 is present within tumors. (A) mrna expression levels of Lgals3 (galectin-3) and Lgals8 (galectin-8) in the four classes of cell lines as determined
Supplementary fig. 1. Crystals induce necroptosis does not involve caspases, TNF receptor or NLRP3. A. Mouse tubular epithelial cells were pretreated
 Supplementary fig. 1. Crystals induce necroptosis does not involve caspases, TNF receptor or NLRP3. A. Mouse tubular epithelial cells were pretreated with zvad-fmk (10µM) and exposed to calcium oxalate
Nature Medicine: doi: /nm.4322
 1 2 3 4 5 6 7 8 9 10 11 Supplementary Figure 1. Predicted RNA structure of 3 UTR and sequence alignment of deleted nucleotides. (a) Predicted RNA secondary structure of ZIKV 3 UTR. The stem-loop structure
Supplementary Figure S1 Supplementary Figure S2
 Supplementary Figure S A) The blots shown in Figure B were qualified by using Gel-Pro analyzer software (Rockville, MD, USA). The ratio of LC3II/LC3I to actin was then calculated. The data are represented
SUPPLEMENTARY INFORMATION
 DOI: 10.1038/ncb2566 Figure S1 CDKL5 protein expression pattern and localization in mouse brain. (a) Multiple-tissue western blot from a postnatal day (P) 21 mouse probed with an antibody against CDKL5.
Supplementary Figure 1 IMQ-Induced Mouse Model of Psoriasis. IMQ cream was
 Supplementary Figure 1 IMQ-Induced Mouse Model of Psoriasis. IMQ cream was painted on the shaved back skin of CBL/J and BALB/c mice for consecutive days. (a, b) Phenotypic presentation of mouse back skin
Supplementary Information
 Supplementary Information Astrocytes regulate adult hippocampal neurogenesis through ephrin-b signaling Randolph S. Ashton, Anthony Conway, Chinmay Pangarkar, Jamie Bergen, Kwang-Il Lim, Priya Shah, Mina
(A) PCR primers (arrows) designed to distinguish wild type (P1+P2), targeted (P1+P2) and excised (P1+P3)14-
 PCR primers (arrows) designed to distinguish wild type (P1+P2), targeted (P1+P2) and excised (P1+P3)14-") 1 Supplemental Figure Legends Figure S1. Mammary tumors of ErbB2 KI mice with 14-3-3σ ablation have elevated ErbB2 transcript levels and cell proliferation (A) PCR primers (arrows) designed to distinguish
1 Supplemental Figure Legends Figure S1. Mammary tumors of ErbB2 KI mice with 14-3-3σ ablation have elevated ErbB2 transcript levels and cell proliferation (A) PCR primers (arrows) designed to distinguish
TRAF6 ubiquitinates TGFβ type I receptor to promote its cleavage and nuclear translocation in cancer
 Supplementary Information TRAF6 ubiquitinates TGFβ type I receptor to promote its cleavage and nuclear translocation in cancer Yabing Mu, Reshma Sundar, Noopur Thakur, Maria Ekman, Shyam Kumar Gudey, Mariya
m 6 A mrna methylation regulates AKT activity to promote the proliferation and tumorigenicity of endometrial cancer
 SUPPLEMENTARY INFORMATION Articles https://doi.org/10.1038/s41556-018-0174-4 In the format provided by the authors and unedited. m 6 A mrna methylation regulates AKT activity to promote the proliferation
Primary Cilia Can Both Mediate and Suppress Hedgehog Pathway- Dependent Tumorigenesis (Supplementary Figures and Materials)
") Primary Cilia Can Both Mediate and Suppress Hedgehog Pathway- Dependent Tumorigenesis (Supplementary Figures and Materials) Sunny Y. Wong, Allen D. Seol, Po-Lin So, Alexandre N. Ermilov, Christopher K.
Primary Cilia Can Both Mediate and Suppress Hedgehog Pathway- Dependent Tumorigenesis (Supplementary Figures and Materials) Sunny Y. Wong, Allen D. Seol, Po-Lin So, Alexandre N. Ermilov, Christopher K.
Supplementary Figure 1.TRIM33 binds β-catenin in the nucleus. a & b, Co-IP of endogenous TRIM33 with β-catenin in HT-29 cells (a) and HEK 293T cells
 and HEK 293T cells") Supplementary Figure 1.TRIM33 binds β-catenin in the nucleus. a & b, Co-IP of endogenous TRIM33 with β-catenin in HT-29 cells (a) and HEK 293T cells (b). TRIM33 was immunoprecipitated, and the amount of
Supplementary Figure 1.TRIM33 binds β-catenin in the nucleus. a & b, Co-IP of endogenous TRIM33 with β-catenin in HT-29 cells (a) and HEK 293T cells (b). TRIM33 was immunoprecipitated, and the amount of
Macrophages form functional vascular mimicry channels in vivo. SI Figures and Legend
 Macrophages form functional vascular mimicry channels in vivo Authors: *Faith H. Barnett, *Mauricio Rosenfeld, Malcolm Wood, William Kiosses, Yoshihiko Usui, Valentina Marchetti, Edith Aguilar, and Martin
Supporting Information
 Supporting Information Palmisano et al. 10.1073/pnas.1202174109 Fig. S1. Expression of different transgenes, driven by either viral or human promoters, is up-regulated by amino acid starvation. (A) Quantification