Critical role for peptide YY in protein-mediated satiation and bodyweight
|
|
|
- Lucas Stokes
- 5 years ago
- Views:
Transcription
1 Cell Metabolism, Volume 4 Supplemental data Critical role for peptide YY in protein-mediated satiation and bodyweight regulation Rachel L. Batterham, Helen Heffron, Saloni Kapoor, Joanna E. Chivers, Keval Chandarana, Herbert Herzog, Carel W. Le Roux, E. Louise Thomas, Jimmy D. Bell, Dominic J. Withers Supplemental experimental procedures Human studies and assays Test meals were prepared using conventional pasta (Sainsbury, London UK) or highprotein pasta (Atkins, Shelton, CT, USA) with a tomato based sauce. Additional protein, carbohydrate and fat supplements were added (Maxipro, UK, Maxijuel and Calogen, SHS International, Merseyside, UK) to the tomato sauce and dessert. Blood was collected into EDTA tubes containing 5000 kallikrein inhibitor units of aprotonin (Bayer, Newbury, Berks, U.K.) per ml. Plasma samples were separated immediately by centrifugation at 4 C. For subsequent PYY (total and PYY3-36) and active GLP-1 DPPIV inhibitor (Linco Research Inc., St Louis, MO, USA) was added to plasma samples to give a final concentration of 100 µm. Samples for analysis of active ghrelin had 100 µl of 1M HCL added per ml of plasma. ELISA kits were used to quantify desacyl-ghrelin, active-ghrelin, active-glp 1 and leptin (Linco Research Inc, St Louis, MO, USA). Total PYY and PYY3-36 were quantified by radioimmunoassay (Linco Research Inc., St Louis, MO, USA). Insulin was analyzed by microparticle enzyme immunoassay (AxSYM, Abbott laboratories, UK). Plasma glucose was measured using a hexokinase method (Olympus AU640 analyser, Olympus, Germany)
2 Murine studies Blood was taken by cardiac puncture under terminal anaesthesia and collected as above. The mediobasal hypothalamus, the stomach, a 3 cm section of the terminal ileum and a 3 cm section of colon were dissected, snap frozen in liquid nitrogen and then stored at -80 C. For assays, insulin and leptin ELISAs (Crystal Chem, Chicago, USA), active ghrelin and desacyl ghrelin ELISAs (Linco Research Inc, MO, USA) and total PYY ELISAs (DSL, Texas, USA) were used. RT-PCR for hypothalamic and gut peptide mrna RT-PCR was performed as previously described (Choudhury et al., 2005) using proprietary sequence Taqman Gene Expression assay FAM/TAMRA primers. For Pyy, pancreatic polypeptide (Ppy) and ghrelin mrna expression relative to transcription elongation factor A (SII) 1 (Tcea1) was calculated. For Npy, Pomc and Agrp expression relative to hypoxanthine phosphoribosyl transferase-encoding gene (Hprt1) was calculated. Magnetic resonance imaging (MRI) MRI was performed on terminally anaesthetised mice as previously described (Choudhury et al., 2005). Targeting of the mouse Pyy gene. The mouse Pyy gene locus was cloned from a 129Sv mouse genomic PAC library. A targeting vector was constructed with an frt site-flanked neomycin cassette placed 5 of the
3 Pyy gene which was itself flanked by loxp sites (Figure 3). ES cell targeting, generation of chimaeric mice and breeding to germ-line transmission was performed as previously described with Southern blotting used to identify homologous recombination and germ-line transmission (Choudhury et al., 2005). In vivo deletion of the neomycin cassette and the Pyy locus was achieved through crossing these mice with eflp-expressing mice (Dymecki, 1996) and with EIIa-Cre transgenic mice (Lakso et al., 1996) both of which were maintained on a pure C57Bl/6 background. These events were identified using PCR primers as indicated in Figure 3C and D. Mice were backcrossed after each stage of these crosses onto pure C57Bl/6 to remove the eflp and EIIa-Cre alleles. The resulting mice, heterozygote for the Pyy null allele, were then intercrossed to obtain Pyy null, heterozygote and wild type littermate mice. The breeding strategy undertaken to delete the neomycin cassette and Pyy locus as described above effectively resulted in four backcrosses into pure C57Bl/6 mice and therefore the predominant (>90%) genetic background for the animals used in these studies was C57Bl/6. Male and female Pyy null mice both displayed the energy homeostasis phenotype. We also maintained in the homozygous state and on the same genetic background Pyy lox/lox mice which lacked the neomycin cassette but retained the loxp flanked Pyy locus. Genotyping of mice was performed by PCR amplification of tail DNA (Figure 3E). ELISA for PYY confirmed the absence of detectable plasma PYY in fed Pyy null mice (Figure 3F). Ppy mrna expression was normal in pancreatic tissue (Figure 3G). The generation and genotyping of Npy2r null mice has been described previously (Baldock et al., 2002).
4 Supplemental Table S1: Test meal composition for human diet studies. Isocaloric meals with high-protein (HP), high-carbohydrate (HC) and high-fat (HF) were used. HP HC HF kcals % kcals % kcals % CHO Pasta Fat Protein Total CHO Dessert Fat Protein Total CHO Total meal Fat Protein Total
5 Normal weight Obese Diet HC HF HP HC HF HP 8,052 ± ,258 1 ± ,246 3 ± ,388 8 ± ,202 3 ± ,899 1 ± Total PYY AUC pmol/l.180 min HP vs. HC P < HP vs. HF P < 0 05 HF vs. HC P < 0 01 Active ghrelin AUC pmol/l.180 min GLP-1 AUC pmol/l.180 min Leptin ng/ml Time 0 Leptin ng/ml Time 180 Insulin AUC pmol/l.180 min 4, ,838 1 ± ± HP vs. HC P > ,208 9 ± ,241 5 ± HP vs. HC P > ± 0 31 ± ± 0 22 ± HP vs. HC P > ,205 ± 17, 160 7,173 ± 2,274 HP vs. HC P < HF vs. HC P < ,347 ± ,306 3 ± ± ± ,074 ± 2,679 HP vs. HC P < 0 05 HP vs. HF P < , ,165 1 ± 340 ± HP vs. HC P > ± ± HP vs. HC P > ± 3 27 ± ± 2 90 ± 2 58 HP vs. HC P > ,313 49,092 ± 26,791 ± 5,889 HP vs. HC P < HP vs. HF P > 0 5 HF vs. HC P < ,842 3 ± ± ± ± ,400 ± 11,061 Supplemental Table S2. Metabolic characteristics in human subjects during studies with high-protein (HP), high-carbohydrate (HC) and high-fat (HF) meals. Values represent mean
6 ± SEM or integrated area under the curve (AUC) profiles, n = 9 for obese group and n = 10 for normal weight group HFNP HFHP LFNP LFHP CHO (% energy) Fat (% energy) Protein (% energy) Energy/g kcal Supplemental Table S3. Mouse diet composition. Composition of the high-fat normalprotein (HFNP), high-fat high-protein (HFHP), low-fat normal-protein (LFNP) and low-fat high-protein (LFHP) diets used in mouse studies.
7 Figure S1. Active ghrelin and active GLP-1 levels in normal weight and obese human subjects following high-protein, high-fat and high carbohydrate meals. A and B) Time course of plasma active ghrelin in normal weight subjects (A) and obese subjects (B) after ingestion at time 0 of isocaloric meals. C and D) Time course of plasma active GLP-1 in normal weight subjects (C) and obese subjects (D) after ingestion at time 0 of isocaloric meals. PROT = high-protein. CHO = high-carbohydrate. FAT = high-fat. All
8 values represent group mean ± SEM, n = 10 for normal weight subjects and n = 9 for obese subjects.


9
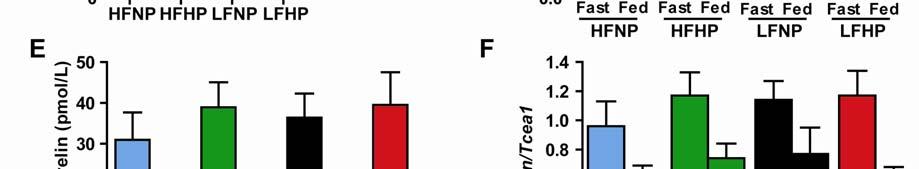
10 Figure S2. Effect of high-protein diets on plasma ghrelin profiles, leptin, gut and hypothalamic peptide expression in mice. For all panels high-fat normal-protein (HFNP: blue symbols), high-fat high-protein (HFHP: green symbols), low-fat normal-protein (LFNP: black symbols) and low-fat high-protein (LFHP: red symbols) diets. A) Plasma active ghrelin profiles in 10-week-old male C57Bl/6 mice after ingestion of isocaloric meals, n = 6 per diet. B) Plasma desacyl ghrelin levels in 10-week-old male C57Bl/6 mice after ingestion of isocaloric meals, n = 6 per diet C) Plasma leptin levels in male C57Bl/6 mice exposed to 16 weeks of different diets, n = 10 per diet. HFNP vs. HFHP, ** p < 0.01; LFNP vs. LFHP # p < D) Fasted (fast) and fed ileal Pyy mrna levels in male C57Bl/6 mice after 16 weeks of different diets, n = 10 per diet (HFNP vs. HFHP, * p < 0.05; LFNP vs. LFHP, # p < 0.05). Pyy mrna levels are expressed as relative to Tcea1. E) Fasted (fast) and fed plasma active ghrelin levels in male C57Bl/6 mice after 16 weeks on different diets, n = 10 per diet. F) Fasted (fast) and fed stomach ghrelin mrna levels in male C57Bl/6 mice after 16 weeks on different diets, n = 10 per diet. Ghrelin mrna levels are expressed as relative to Tcea1. G) Fasted (fast) and fed hypothalamic Pomc mrna levels in male C57Bl/6 mice after 16 weeks of different diets, n = 10 per diet. Pomc mrna levels are expressed as relative to Hprt. All values represent group mean ± SEM.
11
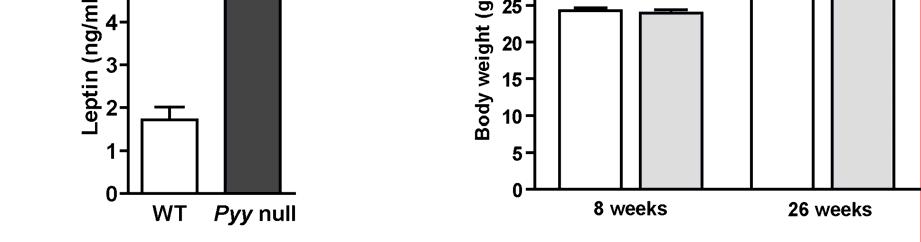
12 Figure S3. Pyy null mice have increased body fat, leptin and normal hypothalamic Pomc mrna levels and PYY lox/lox mice have normal body weight. A and B) Volume of internal adipose tissue (A) and subcutaneous adipose tissue (B) in 10- week-old male wild type control (WT) and Pyy null mice determined by MRI, n = 6 per group, *** p < C) Plasma leptin levels in 10-week-old male WT and Pyy null mice, n = 10 per group, ** p < D) Body weights in 8 and 26-week-old male WT and PYY lox/lox mice, n = 15 per genotype. E) Fasted (fast) and fed hypothalamic Pomc mrna levels in 10-week-old male WT and Pyy null mice. Pomc mrna levels are expressed as relative to Hprt. All values represent group mean ± SEM. Supplemental references Baldock, P.A., Sainsbury, A., Couzens, M., Enriquez, R.F., Thomas, G.P., Gardiner, E.M., and Herzog, H. (2002). Hypothalamic Y2 receptors regulate bone formation. J. Clin. Invest. 109, Choudhury, A.I., Heffron, H., Smith, M.A., Al-Qassab, H., Xu, A.W., Selman, C., Simmgen, M., Clements, M., Claret, M., Maccoll, G., et al. (2005). The role of insulin receptor substrate 2 in hypothalamic and beta cell function. J. Clin. Invest. 115, Dymecki, S.M. (1996). Flp recombinase promotes site-specific DNA recombination in embryonic stem cells and transgenic mice. Proc. Natl. Acad. Sci. USA 93, Lakso, M., Pichel, J.G., Gorman, J.R., Sauer, B., Okamoto, Y., Lee, E., Alt, F.W., and Westphal, H. (1996). Efficient in vivo manipulation of mouse genomic sequences at the zygote stage. Proc. Natl. Acad. Sci. USA 93,
The autoimmune disease-associated PTPN22 variant promotes calpain-mediated Lyp/Pep
 SUPPLEMENTARY INFORMATION The autoimmune disease-associated PTPN22 variant promotes calpain-mediated Lyp/Pep degradation associated with lymphocyte and dendritic cell hyperresponsiveness Jinyi Zhang, Naima
Supplementary Information
 Supplementary Information Overexpression of Fto leads to increased food intake and results in obesity Chris Church, Lee Moir, Fiona McMurray, Christophe Girard, Gareth T Banks, Lydia Teboul, Sara Wells,
Supporting Information
 Supporting Information Franco et al. 10.1073/pnas.1015557108 SI Materials and Methods Drug Administration. PD352901 was dissolved in 0.5% (wt/vol) hydroxyl-propyl-methylcellulose, 0.2% (vol/vol) Tween
(Stratagene, La Jolla, CA) (Supplemental Fig. 1A). A 5.4-kb EcoRI fragment
 (Supplemental Fig. 1A). A 5.4-kb EcoRI fragment") SUPPLEMENTAL INFORMATION Supplemental Methods Generation of RyR2-S2808D Mice Murine genomic RyR2 clones were isolated from a 129/SvEvTacfBR λ-phage library (Stratagene, La Jolla, CA) (Supplemental Fig.
SUPPLEMENTAL INFORMATION Supplemental Methods Generation of RyR2-S2808D Mice Murine genomic RyR2 clones were isolated from a 129/SvEvTacfBR λ-phage library (Stratagene, La Jolla, CA) (Supplemental Fig.
Supplemental methods. Total RNA was extracted from the stomach, liver, pancreas, pituitary, and
 Supplemental methods Real-time quantitative RT-PCR and Semi-quantitative PCR Total RNA was extracted from the stomach, liver, pancreas, pituitary, and hypothalamus as previously described (). Primers and
Figure S1. Body composition, energy homeostasis and substrate utilization in LRH-1 hep+/+ (white bars) and LRH-1 hep-/- (black bars) mice.
 and LRH-1 hep-/- (black bars) mice.") Figure S1. Body composition, energy homeostasis and substrate utilization in LRH-1 hep+/+ (white bars) and LRH-1 hep-/- (black bars) mice. (A) Lean and fat masses, determined by EchoMRI. (B) Food and water
Figure S1. Body composition, energy homeostasis and substrate utilization in LRH-1 hep+/+ (white bars) and LRH-1 hep-/- (black bars) mice. (A) Lean and fat masses, determined by EchoMRI. (B) Food and water
A 10.8 kb ghr fragment containing exons 4 and 5 was PCR amplified with Pfu Turbo. DNA polymerase (Stratagene) and cloned into pcr Blunt II-TOPO vector
 and cloned into pcr Blunt II-TOPO vector") Supplemental Method: Generation of a conditional GHR knockout mice. A 1.8 kb ghr fragment containing exons 4 and 5 was PCR amplified with Pfu Turbo DNA polymerase (Stratagene) and cloned into pcr Blunt
Supplemental Method: Generation of a conditional GHR knockout mice. A 1.8 kb ghr fragment containing exons 4 and 5 was PCR amplified with Pfu Turbo DNA polymerase (Stratagene) and cloned into pcr Blunt
TITLE: A Mouse Model to Investigate the Role of DBC2 in Breast Cancer
 AD Award Number: W81XWH-04-1-0325 TITLE: A Mouse Model to Investigate the Role of DBC2 in Breast Cancer PRINCIPAL INVESTIGATOR: Valerie Boka CONTRACTING ORGANIZATION: University of Texas Health Science
a b c Physical appearance of mice Lean mass Adipocyte size d e f
 LFD HFD LFD HFD Area under curve (GTT) HFD-VSL#3 LFD HFD Area under curve (ITT) HFD-VSL#3 Liver TG content (% l) HFD-VSL#3 LFD HFD HFD-VSL#3 LFD HFD HFD-VSL#3 LFD HFD HFD + VSL#3 Lean mass (gm) Mean adipocyte
Supplementary Figure 1. AdipoR1 silencing and overexpression controls. (a) Representative blots (upper and lower panels) showing the AdipoR1 protein
 Representative blots (upper and lower panels) showing the AdipoR1 protein") Supplementary Figure 1. AdipoR1 silencing and overexpression controls. (a) Representative blots (upper and lower panels) showing the AdipoR1 protein content relative to GAPDH in two independent experiments.
Supplementary Figure 1. AdipoR1 silencing and overexpression controls. (a) Representative blots (upper and lower panels) showing the AdipoR1 protein content relative to GAPDH in two independent experiments.
Supporting Information Table of Contents
 Supporting Information Table of Contents Supporting Information Figure 1 Page 2 Supporting Information Figure 2 Page 4 Supporting Information Figure 3 Page 5 Supporting Information Figure 4 Page 6 Supporting
Figure S1. Generation of inducible PTEN deficient mice and the BMMCs (A) B6.129 Pten loxp/loxp mice were mated with B6.
 B6.129 Pten loxp/loxp mice were mated with B6.") Figure S1. Generation of inducible PTEN deficient mice and the BMMCs (A) B6.129 Pten loxp/loxp mice were mated with B6.129-Gt(ROSA)26Sor tm1(cre/ert2)tyj /J mice. To induce deletion of the Pten locus,
Figure S1. Generation of inducible PTEN deficient mice and the BMMCs (A) B6.129 Pten loxp/loxp mice were mated with B6.129-Gt(ROSA)26Sor tm1(cre/ert2)tyj /J mice. To induce deletion of the Pten locus,
Probe. Hind III Q,!?R'!! /0!!!!D1"?R'! vector. Homologous recombination
 Supple-Zhang Page 1 Wild-type locus Targeting construct Targeted allele Exon Exon3 Exon Probe P1 P P3 FRT FRT loxp loxp neo vector amh I Homologous recombination neo P1 P P3 FLPe recombination Q,!?R'!!
Genotype analysis by Southern blots of nine independent recombinated ES cell clones by
 Supplemental Figure 1 Selected ES cell clones show a correctly recombined conditional Ngn3 allele Genotype analysis by Southern blots of nine independent recombinated ES cell clones by hybridization with
SUPPLEMENTARY INFORMATION
 DOI: 10.1038/ncb2211 a! mir-143! b! mir-103/107! let-7a! mir-144! mir-122a! mir-126-3p! mir-194! mir-27a! mir-30c! Figure S1 Northern blot analysis of mir-143 expression dependent on feeding conditions.
Rat Leptin-HS ELISA FOR LABORATORY USE ONLY YANAIHARA INSTITUTE INC AWAKURA, FUJINOMIYA - SHI SHIZUOKA, JAPAN
 YK051 Rat Leptin-HS ELISA FOR LABORATORY USE ONLY YANAIHARA INSTITUTE INC. 2480-1 AWAKURA, FUJINOMIYA - SHI SHIZUOKA, JAPAN 418 0011 Contents Introduction 2 Characteristics 3 Composition 4 Method 5-6 Notes
Supplemental Table 1. Plasma NEFA and liver triglyceride levels in ap2-hif1ako and ap2-hif2ako mice under control and high fat diets.
 Supplemental Table 1. Plasma NEFA and liver triglyceride levels in Hif1aKO and Hif2aKO mice under control and high fat diets. Hif1a (n=6) Hif1aK O (n=6) Hif2a Hif2aK O Hif1a (n=5) Hif1aKO (n=5) Hif2a Hif2aK
Mouse Glu-OC (undercarboxylated osteocalcin) and Gla-OC (carboxylated osteocalcin) levels were
 and Gla-OC (carboxylated osteocalcin) levels were") Supplemental Data Supplemental Materials and Methods Plasma measurements Mouse Glu-OC (undercarboxylated osteocalcin) and Gla-OC (carboxylated osteocalcin) levels were determined using ELISA kits according
Supplemental Data Supplemental Materials and Methods Plasma measurements Mouse Glu-OC (undercarboxylated osteocalcin) and Gla-OC (carboxylated osteocalcin) levels were determined using ELISA kits according
Supplementary Figure 1. Generation of knockin mice expressing L-selectinN138G. (a) Schematics of the Sellg allele (top), the targeting vector, the
 Schematics of the Sellg allele (top), the targeting vector, the") Supplementary Figure 1. Generation of knockin mice expressing L-selectinN138G. (a) Schematics of the Sellg allele (top), the targeting vector, the targeted allele in ES cells, and the mutant allele in
Supplementary Figure 1. Generation of knockin mice expressing L-selectinN138G. (a) Schematics of the Sellg allele (top), the targeting vector, the targeted allele in ES cells, and the mutant allele in
GPR120 *** * * Liver BAT iwat ewat mwat Ileum Colon. UCP1 mrna ***
 a GPR120 GPR120 mrna/ppia mrna Arbitrary Units 150 100 50 Liver BAT iwat ewat mwat Ileum Colon b UCP1 mrna Fold induction 20 15 10 5 - camp camp SB202190 - - - H89 - - - - - GW7647 Supplementary Figure
SUPPLEMENTARY INFORMATION
 SUPPLEMENTARY INFORMATION Supplementary Figure 1. Generation of a conditional allele of the Kindlin-2 gene. (A) A restriction map of the relevant genomic region of Kindlin-2 (top), the targeting construct
Supplementary Figure S1 Targeted disruption and overexpression of Gpr43 in mice. (a) A targeting vector was constructed by ligation of 3 fragments:
 A targeting vector was constructed by ligation of 3 fragments:") Supplementary Figure S1 Targeted disruption and overexpression of Gpr43 in mice. (a) A targeting vector was constructed by ligation of 3 fragments: the 5' and 3' homology recombination arms and a fragment
Supplementary Figure S1 Targeted disruption and overexpression of Gpr43 in mice. (a) A targeting vector was constructed by ligation of 3 fragments: the 5' and 3' homology recombination arms and a fragment
Expression of acid base transporters in the kidney collecting duct in Slc2a7 -/-
 Supplemental Material Results. Expression of acid base transporters in the kidney collecting duct in Slc2a7 -/- and Slc2a7 -/- mice. The expression of AE1 in the kidney was examined in Slc26a7 KO mice.
Division of Hypothalamic Research, Departments of Internal Medicine and
 1 5-HT 2C Rs Expressed by Pro-opiomelanocortin Neurons Regulate Insulin Sensitivity in Liver Yong Xu 1, 3*, Eric D. Berglund 1*, Jong-Woo Sohn 1, William L. Holland 2, Jen-Chieh Chuang 1, Makoto Fukuda
PYY (Human/Mouse/Rat) ELISA Kit
 ELISA Kit") PYY (Human/Mouse/Rat) ELISA Kit Catalog Number KA1686 96 assays Version: 05 Intended for research use only www.abnova.com Table of Contents Introduction... 3 Background... 3 Principle of the Assay... 3
PYY (Human/Mouse/Rat) ELISA Kit Catalog Number KA1686 96 assays Version: 05 Intended for research use only www.abnova.com Table of Contents Introduction... 3 Background... 3 Principle of the Assay... 3
Generating Mouse Models of Pancreatic Cancer
 Generating Mouse Models of Pancreatic Cancer Aom Isbell http://www2.massgeneral.org/cancerresourceroom/types/gi/index.asp Spring/Summer 1, 2012 Alexandros Tzatsos, MD PhD Bardeesy Lab: Goals and Objectives
Rat Leptin ELISA FOR LABORATORY USE ONLY YANAIHARA INSTITUTE INC AWAKURA, FUJINOMIYA - SHI SHIZUOKA, JAPAN
 YK050 Rat Leptin ELISA FOR LABORATORY USE ONLY YANAIHARA INSTITUTE INC. 2480-1 AWAKURA, FUJINOMIYA - SHI SHIZUOKA, JAPAN 418-0011 Contents Introduction 2 Characteristics 3 Composition 4 Method 5-6 Notes
Supplementary Figure 1. DNA methylation of the adiponectin promoter R1, Pparg2, and Tnfa promoter in adipocytes is not affected by obesity.
 Supplementary Figure 1. DNA methylation of the adiponectin promoter R1, Pparg2, and Tnfa promoter in adipocytes is not affected by obesity. (a) Relative amounts of adiponectin, Ppar 2, C/ebp, and Tnf mrna
Nature Immunology: doi: /ni Supplementary Figure 1. Huwe1 has high expression in HSCs and is necessary for quiescence.
 Supplementary Figure 1 Huwe1 has high expression in HSCs and is necessary for quiescence. (a) Heat map visualizing expression of genes with a known function in ubiquitin-mediated proteolysis (KEGG: Ubiquitin
Supplementary Figures
 Supplementary Figures Supplementary Figure 1. Confirmation of Dnmt1 conditional knockout out mice. a, Representative images of sorted stem (Lin - CD49f high CD24 + ), luminal (Lin - CD49f low CD24 + )
Balancing intestinal and systemic inflammation through cell type-specific expression of
 Supplementary Information Balancing intestinal and systemic inflammation through cell type-specific expression of the aryl hydrocarbon receptor repressor Olga Brandstätter 1,2,6, Oliver Schanz 1,6, Julia
Recent results of the research into the possible contribution of whey powders in the fight against obesity. David J Baer, PhD
 Recent results of the research into the possible contribution of whey powders in the fight against obesity David J Baer, PhD Beltsville Human Nutrition Research Center Funded by USDA, ARS and the Whey
Supplemental Information. Increased 4E-BP1 Expression Protects. against Diet-Induced Obesity and Insulin. Resistance in Male Mice
 Cell Reports, Volume 16 Supplemental Information Increased 4E-BP1 Expression Protects against Diet-Induced Obesity and Insulin Resistance in Male Mice Shih-Yin Tsai, Ariana A. Rodriguez, Somasish G. Dastidar,
Supplementary Figure 1
 VO (ml kg - min - ) VCO (ml kg - min - ) Respiratory exchange ratio Energy expenditure (cal kg - min - ) Locomotor activity (x count) Body temperature ( C) Relative mrna expression TA Sol EDL PT Heart
Dynamics of Gut-Brain Communication Underlying Hunger
 Article Dynamics of Gut-Brain Communication Underlying Hunger Highlights d Intragastric nutrients rapidly and durably inhibit hungerpromoting AgRP neurons d d d AgRP neuron inhibition by nutrients depends
SUPPLEMENTARY INFORMATION. Rett Syndrome Mutation MeCP2 T158A Disrupts DNA Binding, Protein Stability and ERP Responses
 SUPPLEMENTARY INFORMATION Rett Syndrome Mutation T158A Disrupts DNA Binding, Protein Stability and ERP Responses Darren Goffin, Megan Allen, Le Zhang, Maria Amorim, I-Ting Judy Wang, Arith-Ruth S. Reyes,
AdPLA ablation increases lipolysis and prevents obesity induced by high fat feeding or leptin deficiency
 AdPLA AdPLA ablation increases lipolysis and prevents obesity induced by high fat feeding or leptin deficiency Kathy Jaworski, Maryam Ahmadian, Robin E. Duncan, Eszter Sarkadi-Nagy, Krista A. Va rady,
ZL ZDF ZDF + E2 *** Visceral (g) ZDF
 ZDF") Body Weight (g) 4 3 2 1 ** * ZL ZDF 6 8 1 12 14 16 Age (weeks) B * Sub-cutaneous (g) 16 12 8 4 ZL ZDF Visceral (g) 25 2 15 1 5 ZL ZDF Total fat pad weight (g) 4 3 2 1 ZDF ZL Supplemental Figure 1: Effect
Body Weight (g) 4 3 2 1 ** * ZL ZDF 6 8 1 12 14 16 Age (weeks) B * Sub-cutaneous (g) 16 12 8 4 ZL ZDF Visceral (g) 25 2 15 1 5 ZL ZDF Total fat pad weight (g) 4 3 2 1 ZDF ZL Supplemental Figure 1: Effect
YK052 Mouse Leptin ELISA
 YK052 Mouse Leptin ELISA FOR LABORATORY USE ONLY YANAIHARA INSTITUTE INC. 2480-1 AWAKURA, FUJINOMIYA-SHI SHIZUOKA, JAPAN 418-0011 Contents Ⅰ. Introduction 2 Ⅱ. Characteristics 3 Ⅲ. Composition 4 Ⅳ. Method
1.5 ASK1KO fed. fasted 16 hrs w/o water. Fed. 4th. 4th WT ASK1KO N=29, 11(WT), ,5(ASK1KO) ASK1KO ASK1KO **** Time [h]
![1.5 ASK1KO fed. fasted 16 hrs w/o water. Fed. 4th. 4th WT ASK1KO N=29, 11(WT), ,5(ASK1KO) ASK1KO ASK1KO **** Time [h]](/thumbs/87/97258189.jpg "1.5 ASK1KO fed. fasted 16 hrs w/o water. Fed. 4th. 4th WT ASK1KO N=29, 11(WT), ,5(ASK1KO) ASK1KO ASK1KO **** Time [h]") 7: 13: 19: 1: 7: 151117 a 151117 4th 4th b c RQ.95 KO.9.85.8.75.7 light dark light dark.65 7: 19: 7: 19: 7: Means ± SEM, N=6 RQ 1..9.8.7.6.6 KO CL (-) CL (+) ibat weight ratio (/body weight) [%].5.4.3.2.1
7: 13: 19: 1: 7: 151117 a 151117 4th 4th b c RQ.95 KO.9.85.8.75.7 light dark light dark.65 7: 19: 7: 19: 7: Means ± SEM, N=6 RQ 1..9.8.7.6.6 KO CL (-) CL (+) ibat weight ratio (/body weight) [%].5.4.3.2.1
Supplemental data Supplemental Figure Legends Supplemental Figure 1. Supplemental Figure 2.
 Supplemental data Supplemental Figure Legends Supplemental Figure 1. Analysis of deletion of AMPK!2 in POMC and AgRP neurons in control and POMC!2KO and AgRP!2KO mice. (A) mmunofluorescence analysis for
SUPPLEMENTARY FIGURES
 SUPPLEMENTARY FIGURES Supplementary Figure 1: Chemokine receptor expression profiles of CCR6 + and CCR6 - CD4 + IL-17A +/ex and Treg cells. Quantitative PCR analysis of chemokine receptor transcript abundance
Energy Homeostasis and Gastrointestinal Endocrine Differentiation Do Not Require the Anorectic Hormone Peptide YY
 MOLECULAR AND CELLULAR BIOLOGY, May 2005, p. 4189 4199 Vol. 25, No. 10 0270-7306/05/$08.00 0 doi:10.1128/mcb.25.10.4189 4199.2005 Copyright 2005, American Society for Microbiology. All Rights Reserved.
BRaf V600E cooperates with Pten silencing to elicit metastatic melanoma (Nature Genetics Supplementary Information)
") BRaf V600E cooperates with Pten silencing to elicit metastatic melanoma (Nature Genetics Supplementary Information) David Dankort, David P. Curley, Robert A. Cartlidge, Betsy Nelson, Anthony N. Karnezis,
BRaf V600E cooperates with Pten silencing to elicit metastatic melanoma (Nature Genetics Supplementary Information) David Dankort, David P. Curley, Robert A. Cartlidge, Betsy Nelson, Anthony N. Karnezis,
General Laboratory methods Plasma analysis: Gene Expression Analysis: Immunoblot analysis: Immunohistochemistry:
 General Laboratory methods Plasma analysis: Plasma insulin (Mercodia, Sweden), leptin (duoset, R&D Systems Europe, Abingdon, United Kingdom), IL-6, TNFα and adiponectin levels (Quantikine kits, R&D Systems
SUPPLEMENTARY INFORMATION
 SUPPLEMENTARY INFORMATION doi:10.1038/nature11429 S1a 6 7 8 9 Nlrc4 allele S1b Nlrc4 +/+ Nlrc4 +/F Nlrc4 F/F 9 Targeting construct 422 bp 273 bp FRT-neo-gb-PGK-FRT 3x.STOP S1c Nlrc4 +/+ Nlrc4 F/F casp1
THE EFFECT OF BREAKFAST CONSUMPTION ON THE ACUTE RESPONSE OF PLASMA ACYLATED-GHRELIN AND GLUCAGON-LIKE PEPTIDE 1 CONCENTRATIONS IN ADULT WOMEN
 THE EFFECT OF BREAKFAST CONSUMPTION ON THE ACUTE RESPONSE OF PLASMA ACYLATED-GHRELIN AND GLUCAGON-LIKE PEPTIDE 1 CONCENTRATIONS IN ADULT WOMEN by Thomas A. Hritz, MS, RD, LDN B.S., University of Pittsburgh,
Nature Structural & Molecular Biology: doi: /nsmb Supplementary Figure 1. Generation and validation of mtef4-knockout mice.
 Supplementary Figure 1 Generation and validation of mtef4-knockout mice. (a) Alignment of EF4 (E. coli) with mouse, yeast and human EF4. (b) Domain structures of mouse mtef4 compared to those of EF4 (E.
Neurophysiology of the Regulation of Food Intake and the Common Reward Pathways of Obesity and Addiction. Laura Gunter
 Neurophysiology of the Regulation of Food Intake and the Common Reward Pathways of Obesity and Addiction Laura Gunter The Brain as the Regulatory Center for Appetite The brain is the integration center
Figure S1 (A) Comparison of body weight and blood glucose levels in male wild-type (WT) and Cre littermates. Mice were maintained on a normal chow
 Comparison of body weight and blood glucose levels in male wild-type (WT) and Cre littermates. Mice were maintained on a normal chow") Figure S1 (A) Comparison of body weight and blood glucose levels in male wild-type (WT) and Cre littermates. Mice were maintained on a normal chow diet (n = 7 per genotype). Body weight and fed blood glucose
Figure S1 (A) Comparison of body weight and blood glucose levels in male wild-type (WT) and Cre littermates. Mice were maintained on a normal chow diet (n = 7 per genotype). Body weight and fed blood glucose
Supplementary Figure S1. Generation of LSL-EZH2 conditional transgenic mice.
 Downstream Col1A locus S P P P EP Genotyping with P1, P2 frt PGKneopA + frt hygro-pa Targeting vector Genotyping with P3, P4 P1 pcag-flpe P2 P3 P4 frt SApA CAG LSL PGKATG frt hygro-pa C. D. E. ormal KRAS
Supporting Information
 Supporting Information Pang et al. 10.1073/pnas.1322009111 SI Materials and Methods ELISAs. These assays were performed as previously described (1). ELISA plates (MaxiSorp Nunc; Thermo Fisher Scientific)
Supplementary Figure 1. Genotyping strategies for Mcm3 +/+, Mcm3 +/Lox and Mcm3 +/- mice and luciferase activity in Mcm3 +/Lox mice. A.
 Supplementary Figure 1. Genotyping strategies for Mcm3 +/+, Mcm3 +/Lox and Mcm3 +/- mice and luciferase activity in Mcm3 +/Lox mice. A. Upper part, three-primer PCR strategy at the Mcm3 locus yielding
Tissue-Specific Role of Glycogen Synthase Kinase 3 in Glucose Homeostasis and Insulin Action
 MOLECULAR AND CELLULAR BIOLOGY, Oct. 28, p. 6314 6328 Vol. 28, No. 2 27-736/8/$8. doi:1.1128/mcb.763-8 Copyright 28, American Society for Microbiology. All Rights Reserved. Tissue-Specific Role of Glycogen
Altered Mouse Adipose Tissue IGF-1 Expression Influences Glucose Control
 Altered Mouse Adipose Tissue IGF-1 Expression Influences Glucose Control Jan Trost Prof. Gudrun A. Brockmann Humboldt Universität zu Berlin Department of Crop and Animal Sciences Breeding Biology and Molecular
(A) PCR primers (arrows) designed to distinguish wild type (P1+P2), targeted (P1+P2) and excised (P1+P3)14-
 PCR primers (arrows) designed to distinguish wild type (P1+P2), targeted (P1+P2) and excised (P1+P3)14-") 1 Supplemental Figure Legends Figure S1. Mammary tumors of ErbB2 KI mice with 14-3-3σ ablation have elevated ErbB2 transcript levels and cell proliferation (A) PCR primers (arrows) designed to distinguish
1 Supplemental Figure Legends Figure S1. Mammary tumors of ErbB2 KI mice with 14-3-3σ ablation have elevated ErbB2 transcript levels and cell proliferation (A) PCR primers (arrows) designed to distinguish
Roux-en-Y gastric bypass surgery but not vertical sleeve gastrectomy decreases bone mass in male rats
 SUPPLEMENTAL DATA Roux-en-Y gastric bypass surgery but not vertical sleeve gastrectomy decreases bone mass in male rats 1 Kerstin Stemmer, 2 Maximilian Bielohuby, 3 Bernadette E. Grayson, 3 Denovan P.
Human Leptin ELISA Kit
 Product Manual Human Leptin ELISA Kit Catalog Numbers MET-5057 MET-5057-5 96 assays 5 x 96 assays FOR RESEARCH USE ONLY Not for use in diagnostic procedures Introduction Leptin is a polypeptide hormone
BIOL2005 WORKSHEET 2008
 BIOL2005 WORKSHEET 2008 Answer all 6 questions in the space provided using additional sheets where necessary. Hand your completed answers in to the Biology office by 3 p.m. Friday 8th February. 1. Your
Supplemental Figure 1. (A) The localization of Cre DNA recombinase in the testis of Cyp19a1-Cre mice was detected by immunohistchemical analyses
 The localization of Cre DNA recombinase in the testis of Cyp19a1-Cre mice was detected by immunohistchemical analyses") Supplemental Figure 1. (A) The localization of Cre DNA recombinase in the testis of Cyp19a1-Cre mice was detected by immunohistchemical analyses using an anti-cre antibody; testes at 1 week (left panel),
Supplemental Figure 1. (A) The localization of Cre DNA recombinase in the testis of Cyp19a1-Cre mice was detected by immunohistchemical analyses using an anti-cre antibody; testes at 1 week (left panel),
Mary ET Boyle, Ph. D. Department of Cognitive Science UCSD
 Mary ET Boyle, Ph. D. Department of Cognitive Science UCSD Is obesity a brain disorder? What is the evidence to support obesity is a brain disorder? Environmental, biological, and behavioral issues Over
The antiparasitic drug ivermectin is a novel FXR ligand that regulates metabolism
 Supplementary Information The antiparasitic drug ivermectin is a novel FXR ligand that regulates metabolism Address correspondence to Yong Li (yongli@xmu.edu.cn, Tel: 86-592-218151) GW464 CDCA Supplementary
Ghrelin mediates stressinduced. behavior in mice. Chuang et al 2011 L3: Love, Lust, Labor
 Ghrelin mediates stressinduced food-reward behavior in mice Chuang et al 2011 L3: Love, Lust, Labor Agenda Introduction What is Ghrelin? Previous Models New model Methods Results Discussion Conclusion
Supplementary Materials for
 www.sciencesignaling.org/cgi/content/full/8/407/ra127/dc1 Supplementary Materials for Loss of FTO in adipose tissue decreases Angptl4 translation and alters triglyceride metabolism Chao-Yung Wang,* Shian-Sen
For pair feeding, mice were fed 2.7g of HFD containing tofogliflozin
 Materials and Methods Pair Feeding Experiment For pair feeding, mice were fed 2.7g of HFD containing tofogliflozin (0.005%), which is average daily food intake of mice fed control HFD ad libitum at week
Figure 1: The leptin/melanocortin pathway Neuronal populations propagate the signaling of various molecules (leptin, insulin, ghrelin) to control
 to control") Leptin Deficiency Introduction The leptin/melanocortin pathway plays a key role in the hypothalamic control of food intake. It is activated following the systemic release of the adipokine leptin (LEP)
Leptin Deficiency Introduction The leptin/melanocortin pathway plays a key role in the hypothalamic control of food intake. It is activated following the systemic release of the adipokine leptin (LEP)
AMPK is essential for energy homeostasis regulation and glucose sensing by POMC and AgRP neurons
 Related Commentary, page 2089 Research article AMPK is essential for energy homeostasis regulation and glucose sensing by POMC and AgRP neurons Marc Claret, 1 Mark A. Smith, 2 Rachel L. Batterham, 1 Colin
Supplementary Information Titles Journal: Nature Medicine
 Supplementary Information Titles Journal: Nature Medicine Article Title: Corresponding Author: Supplementary Item & Number Supplementary Fig.1 Fig.2 Fig.3 Fig.4 Fig.5 Fig.6 Fig.7 Fig.8 Fig.9 Fig. Fig.11
Supporting Information
 Supporting Information Charalambous et al. 10.1073/pnas.1406119111 SI Experimental Procedures Serum and Tissue Biochemistry. Enzymatic assay kits were used for determination of plasma FFAs (Roche), TAGs
Central insulin action regulates peripheral glucose and fat metabolism in mice
 Research article Central insulin action regulates peripheral glucose and fat metabolism in mice Linda Koch, 1 F. Thomas Wunderlich, 1 Jost Seibler, 2 A. Christine Könner, 1 Brigitte Hampel, 1 Sigrid Irlenbusch,
Polycomb protein Ezh2 regulates pancreatic β-cell Ink4a/Arf expression and regeneration in streptozotocin-induced diabetes mellitus
 Chen et al. 1 Polycomb protein Ezh2 regulates pancreatic β-cell Ink4a/Arf expression and regeneration in streptozotocin-induced diabetes mellitus Hainan Chen 1, Xueying Gu 1, I-hsin Su 2, Rita Bottino
Supplemental Information. Differential Effects of EGFL6 on Tumor. versus Wound Angiogenesis
 Cell Reports, Volume 21 Supplemental Information Differential Effects of EGFL6 on Tumor versus Wound Angiogenesis Kyunghee Noh, Lingegowda S. Mangala, Hee-Dong Han, Ningyan Zhang, Sunila Pradeep, Sherry
Digestion: Endocrinology of Appetite
 Digestion: Endocrinology of Dr. Ritamarie Loscalzo Medical Disclaimer: The information in this presentation is not intended to replace a one on one relationship with a qualified health care professional
Zhu et al, page 1. Supplementary Figures
 Zhu et al, page 1 Supplementary Figures Supplementary Figure 1: Visual behavior and avoidance behavioral response in EPM trials. (a) Measures of visual behavior that performed the light avoidance behavior
Nature Immunology: doi: /ni Supplementary Figure 1. Gene expression profile of CD4 + T cells and CTL responses in Bcl6-deficient mice.
 Supplementary Figure 1 Gene expression profile of CD4 + T cells and CTL responses in Bcl6-deficient mice. (a) Gene expression profile in the resting CD4 + T cells were analyzed by an Affymetrix microarray
Central injection of fibroblast growth factor 1 induces sustained remission of diabetic hyperglycemia in rodents
 Central injection of fibroblast growth factor 1 induces sustained remission of diabetic hyperglycemia in rodents Jarrad M Scarlett 1,,1, Jennifer M Rojas 1,1, Miles E Matsen 1, Karl J Kaiyala 3, Darko
IL-34 is a tissue-restricted ligand of CSF1R required for the development of Langerhans cells and microglia
 Supplementary Figures IL-34 is a tissue-restricted ligand of CSF1R required for the development of Langerhans cells and microglia Yaming Wang, Kristy J. Szretter, William Vermi, Susan Gilfillan, Cristina
Albert Einstein College of Medicine Bronx, NY 10461
 AWARD NUMBER: W81XWH-15-1-0557 TITLE: Central and Peripheral Mechanisms of Antipsychotic Medication-Induced Metabolic Dysregulation PRINCIPAL INVESTIGATOR: Gary J. Schwartz, Ph.D. CONTRACTING ORGANIZATION:
LESSON 3.3 WORKBOOK. How do we decide when and how much to eat?
 Appetite The psychological desire to eat, driven by feelings of pleasure from the brain. Hunger The biological or physiological need to eat, caused by a release of hormones from the digestive tract. LESSON
Supplemental Figure 1. Western blot analysis indicated that MIF was detected in the fractions of
 Supplemental Figure Legends Supplemental Figure 1. Western blot analysis indicated that was detected in the fractions of plasma membrane and cytosol but not in nuclear fraction isolated from Pkd1 null
Empower Preventive Medicine. Timothy J. McCormick, DO, MPH 4221 Baymeadows Suite 6 Jacksonville, FL
 Empower Preventive Medicine Timothy J. McCormick, DO, MPH 4221 Baymeadows Suite 6 Jacksonville, FL 32217 904-367-4005 Drtim@emprevmed.com Obesity Medicine Old paradigm: Obesity was a matter of willpower,
perk/erk STAT5B
 pakt/akt relative to saline (fold).5.5.5 control perk/erk relative to saline (fold).6.4..8.6.4. p=.6 control db/+ Hsp6 VDAC Hsp6/VDAC (relative to db/+) 8 6 4 db/+ C db/+ Hsp6 Hsp6/actin (relative to db/+)
GENE Forward primer Reverse primer FABP4 CCTTTGTGGGGACCTGGAAA TGACCGGATGACGACCAAGT CD68 AATGTGTCCTTCCCACAAGC GGCAGCAAGAGAGATTGGTC
 Published in "" which should be cited to refer to this work. mrna extraction and RT-PCR Total RNA from 5 15 mg of crushed white adipose tissue was isolated using the technique described by Chomczynski
Supplementary Table 1. The primers used for quantitative RT-PCR. Gene name Forward (5 > 3 ) Reverse (5 > 3 )
 Reverse (5 > 3 )") 770 771 Supplementary Table 1. The primers used for quantitative RT-PCR. Gene name Forward (5 > 3 ) Reverse (5 > 3 ) Human CXCL1 GCGCCCAAACCGAAGTCATA ATGGGGGATGCAGGATTGAG PF4 CCCCACTGCCCAACTGATAG TTCTTGTACAGCGGGGCTTG
770 771 Supplementary Table 1. The primers used for quantitative RT-PCR. Gene name Forward (5 > 3 ) Reverse (5 > 3 ) Human CXCL1 GCGCCCAAACCGAAGTCATA ATGGGGGATGCAGGATTGAG PF4 CCCCACTGCCCAACTGATAG TTCTTGTACAGCGGGGCTTG
BMI risk SNPs associate with increased CADM1 and CADM2 expression in the cerebellum of human subjects.
 Supplementary Figure 1 BMI risk SNPs associate with increased CADM1 and CADM2 expression in the cerebellum of human subjects. Boxplots show the 25% and 75% quantiles of normalized mrna expression levels
marker. DAPI labels nuclei. Flies were 20 days old. Scale bar is 5 µm. Ctrl is
 Supplementary Figure 1. (a) Nos is detected in glial cells in both control and GFAP R79H transgenic flies (arrows), but not in deletion mutant Nos Δ15 animals. Repo is a glial cell marker. DAPI labels
Energy Balance. Applied Human Metabolism VII. Energy Out. Factors that effect BMR/RMR 17/03/2016
 Energy Balance Applied Human Metabolism VII Weight Regulation The balance of energy taken in or leaving the body determines body mass Energy In = Energy Out Weight Maintenance Energy In < Energy Out Weight
I. Introduction. II. Characteristics
 YK050 Rat Leptin ELISA I. Introduction Leptin, which is a product of ob gene, is a protein consisting of 167 amino acids and it is secreted from white adipose tissue. It is known that leptin acts on hypothalamus
2.1 Reproduction At the end of this sequence of lessons I can:
 2.1 Reproduction 1. State that reproduction is the method of producing new offspring 2. State that sexual reproduction involves two parents 3. State that sexual reproduction leads to variation in offspring
Supplementary Figure 1) GABAergic enhancement by leptin hyperpolarizes POMC neurons A) Representative recording samples showing the membrane
 GABAergic enhancement by leptin hyperpolarizes POMC neurons A) Representative recording samples showing the membrane") Supplementary Figure 1) GABAergic enhancement by leptin hyperpolarizes POMC neurons A) Representative recording samples showing the membrane potential recorded from POMC neurons following treatment with
Supplementary Figure 1) GABAergic enhancement by leptin hyperpolarizes POMC neurons A) Representative recording samples showing the membrane potential recorded from POMC neurons following treatment with
BIOL212 Biochemistry of Disease. Metabolic Disorders - Obesity
 BIOL212 Biochemistry of Disease Metabolic Disorders - Obesity Obesity Approx. 23% of adults are obese in the U.K. The number of obese children has tripled in 20 years. 10% of six year olds are obese, rising
Supplementary Figures
 Supplementary Figures Supplementary Figure 1 Increased ABHD5 expression in human colon cancer associated macrophages. (a) Murine peritoneal macrophages were treated with regular culture medium (Ctrl) or
stability and tumor suppression
 Supplementary information The stress kinase MKK7 couples oncogenic stress to p53 stability and tumor suppression Daniel Schramek 1, Athanassios Kotsinas 2, Arabella Meixner 1, Teiji Wada 1, Ulrich Elling
The role of proteins and amino acids in food intake and satiety
 The role of proteins and amino acids in food intake and satiety Daniel TOME AGROPARISTECH Departement of Life Sciences and Health INRA, UMR914 Nutrition physiology and ingestive behavior, Paris, France
SUPPLEMENTARY INFORMATION
 doi: 1.138/nature7221 Brown fat selective genes 12 1 Control Q-RT-PCR (% of Control) 8 6 4 2 Ntrk3 Cox7a1 Cox8b Cox5b ATPase b2 ATPase f1a1 Sirt3 ERRα Elovl3/Cig3 PPARα Zic1 Supplementary Figure S1. stimulates
AMDCC Progress Report Duke/UNC/Stanford Unit. Program Director Thomas M. Coffman, MD
 AMDCC Progress Report Duke/UNC/Stanford Unit Program Director Thomas M. Coffman, MD Susceptibility Mutation Model Development + ApoE-/- +STZ Kidney Phenotype Screen Vascular & Kidney Phenotype Screen Generate
Supplementary methods:
 Supplementary methods: Primers sequences used in real-time PCR analyses: β-actin F: GACCTCTATGCCAACACAGT β-actin [11] R: AGTACTTGCGCTCAGGAGGA MMP13 F: TTCTGGTCTTCTGGCACACGCTTT MMP13 R: CCAAGCTCATGGGCAGCAACAATA
A suppressor locus for MODY3-diabetes
 A suppressor locus for MODY3-diabetes Miguel A. Garcia-Gonzalez 1,2, Claire Carette 1,3, Alessia Bagattin 1, Magali Chiral 1, Munevver Parla Makinistoglu 1, Serge Garbay 1, Géraldine Prévost 4, Cécile
Supplemental Table 1: Demographics and characteristics of study participants. Male, n (%) 3 (20%) 6 (50%) Age, years [mean ± SD] 33.3 ± ± 9.
![Supplemental Table 1: Demographics and characteristics of study participants. Male, n (%) 3 (20%) 6 (50%) Age, years [mean ± SD] 33.3 ± ± 9.](/thumbs/90/103696086.jpg "Supplemental Table 1: Demographics and characteristics of study participants. Male, n (%) 3 (20%) 6 (50%) Age, years [mean ± SD] 33.3 ± ± 9.") SUPPLEMENTAL DATA Supplemental Table 1: Demographics and characteristics of study participants Lean (n=15) Obese (n=12) Male, n (%) 3 (20%) 6 (50%) Age, years [mean ± SD] 33.3 ± 9.5 44.8 ± 9.1 White, n
SUPPLEMENTAL DATA Supplemental Table 1: Demographics and characteristics of study participants Lean (n=15) Obese (n=12) Male, n (%) 3 (20%) 6 (50%) Age, years [mean ± SD] 33.3 ± 9.5 44.8 ± 9.1 White, n
SUPPLEMENTARY INFORMATION
 a c e doi:10.1038/nature10407 b d f Supplementary Figure 1. SERCA2a complex analysis. (a) Two-dimensional SDS-PAGE gels of SERCA2a complexes. A silver-stained SDSPAGE gel is shown, which reveals a 12 kda