SUPPLEMENTARY INFORMATION
|
|
|
- Alexandra Lloyd
- 5 years ago
- Views:
Transcription
1 SUPPLEMENTARY INORMATION Activation of the reward system boosts innate and adaptive immunity Tamar L. Ben-Shaanan 1,2, Hilla Azulay-Debby 1,2, Tania Dubovik 1, Elina Starosvetsky 1, Ben Korin 1,2, Maya Schiller 1,2, Nathaniel L. Green 1,2, Yasmin Admon 1, ahed Hakim 1,3, Shai S. Shen-Orr 1,4#*, Asya Rolls 1,2#* Affiliations: (1) Department of Immunology, Rappaport aculty of Medicine, Technion - Israel Institute of Technology, Haifa, Israel. (2) Center of Science and Engineering of Neuronal Systems, Rappaport aculty of Medicine, Technion - Israel Institute of Technology, Haifa Israel. (3) Pediatric Pulmonary Unit, Rambam Health Care Campus, Haifa, Israel. (4) aculty of Biology, Technion Israel Institute of Technology, Haifa, Israel.
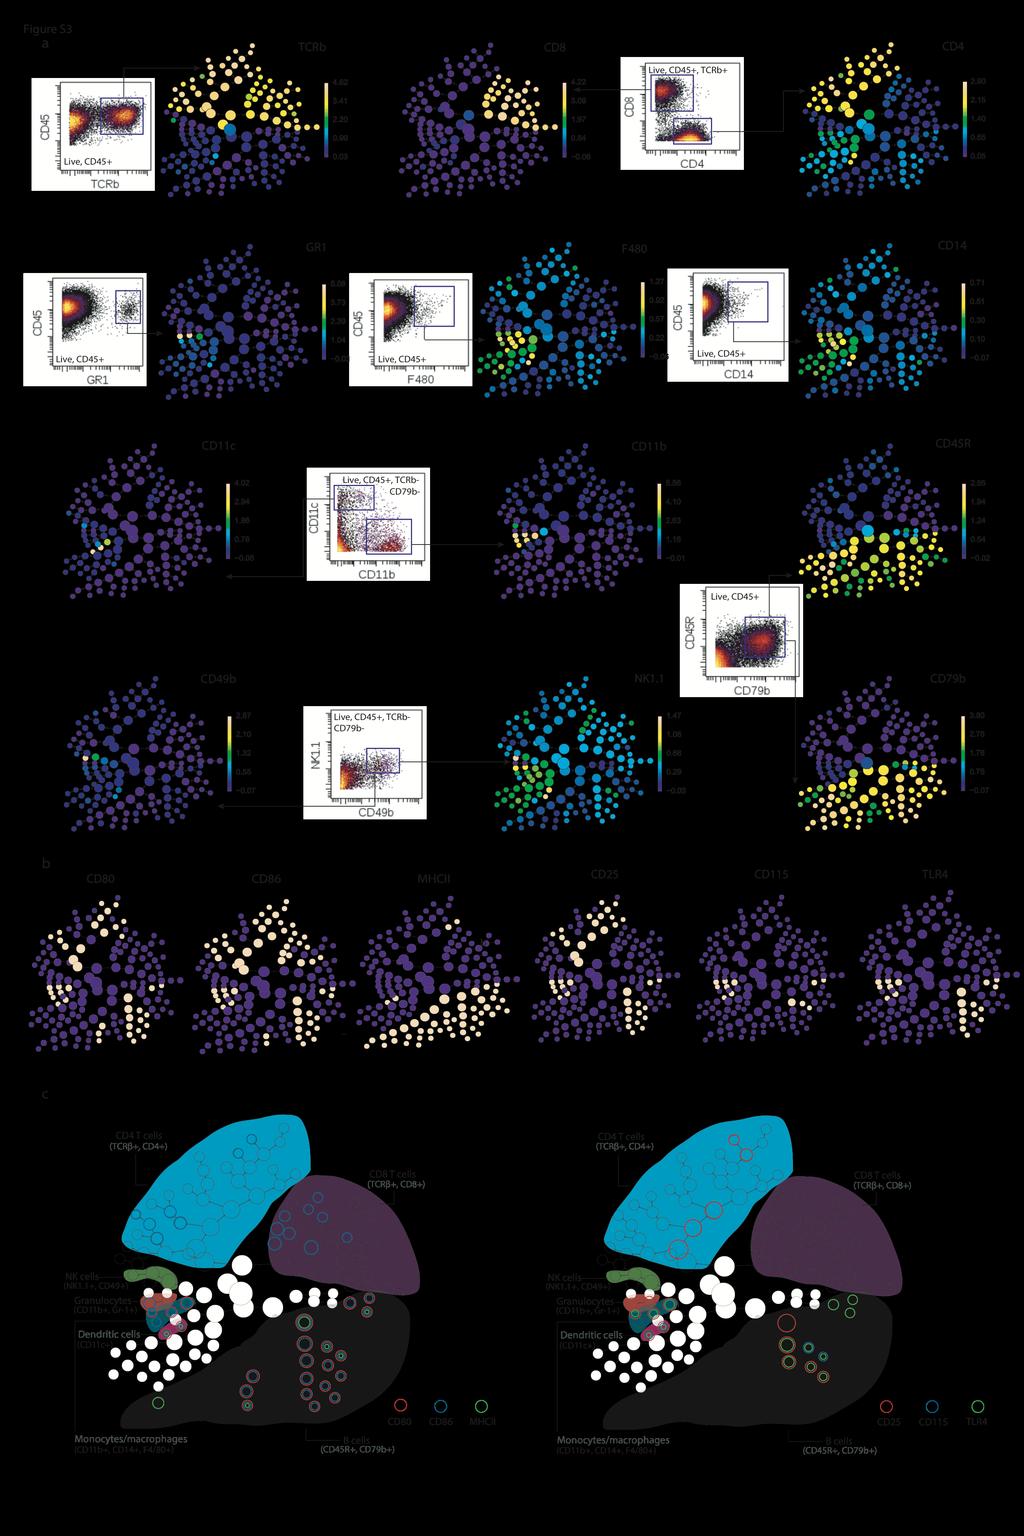
2 Supplementary Table S1: Effects of VTA activation replicated in all three repeats of the experiments. B cells- CD80 MAC- CD80 Experiment # Experiment # Barcoded Experiment B cells- CD86 MAC- CD86 Experiment # Experiment # Barcoded Experiment B cells- TLR4 MAC- TLR4 Experiment # Experiment # Barcoded Experiment B cells- CD25 Experiment # Experiment # Barcoded Experiment Experiment #1-2 with non-barcoded data (n=5 mice per group) and an additional experiment, evaluated by barcoding (n=3 VTA and 5 controls). Significant differences are reported as a percentage of increase in the expression intensity in the group compared to the control group. Of note, we provide in igure S3 and S4 the specific details of one representative experiment done without barcoding and in Table S1, we provide a summary of the effects replicated in all three experiments including the barcoded data. Thus, for example, we did not identify differences in DCs in the barcoded experiment and, therefore, we do not refer to these cells in the text.
3 Table S2: CyTO antibody panel. Isotope Ab (In115)Di CD45 (La139)Di CCR3 (Pr141)Di CD80 (Nd142)Di GR1 (Nd143)Di CD86 (Nd144)Di 4/80 (Nd145)Di CD4 (Nd146)Di CD45R (Sm147)Di CD152 (Nd148)Di CD138 (Sm149)Di CD8 (Nd150)Di NK1.1 (Eu151)Di CD206 (Sm152)Di CD25 (Eu153)Di CD14 (Sm154)Di CD11c (Gd155)Di IgM (Gd156)Di CD49b Clone Catalog no JO73E A RB6-8C GL BM RM RA3-6B C PK C068C C Sa N RMM DX Experiment Use C C, C, C, C, C = Clustering = unction A = Cell-subset annotation NA = Not analysed (barcoded) 24h = (non- barcoded) VTA activation CyTO analysis = VTA activation = 6-OHDA 24h E. coli (i.p.) 2 days 3 days/7 days 24h CyTO analysis CyTO analysis X No SNS + VTA activation Isotope Ab Clone Experiment Catalog no. Use (Gd157)Di CD19 6D C (Gd158)Di CD34 MEC C (Tb159)Di CD27 LG.3A (Gd160)Di CD69 H (Dy161)Di CD123 5B NA (Dy162)Di TCRb H (Dy163)Di CCR7 4B (Dy164)Di CD (Ho165)Di CD115 AS (Er166)Di CD C C (Er167)Di TLR4 SA (Er168)Di CD117 ACK C (Tm169)Di CD79b HM (Er170)Di CD62L MEL C (Yb171)Di CD44 IM C (Yb173)Di (Yb173)Di TLR2 CD45RA T sc NA (Yb174)Di IA-IE M5/ C, (Lu175)Di IgD 11-26c.2a (Yb176)D i CD11b M1/ Isotope Ab Clone Catalog no. Experiment Use (Sm147) Di CD3e 145-2C (Dy161)Di CD21 7E (Dy163)Di CD127 A7R (Yb172)Di CD23 B3B The antibodies used for clustering (C), annotation (A) and functional () analysis of the immune populations are shown with the clone details and the CyTO channels for each antibody. Markers discarded from the analysis altogether are marked NA (not analyzed). Clustering was performed with Citrus based on similarity of expression of all clustering markers. The antibodies used in each panel are specified with a color code. All antibodies were purchased from BioLegend, except CD45RA that was purchased from Santa-Cruz Biotechnology. All antibodies were validated by the manufacturer s for flow application as indicated on the manufacturer s website
, substantia nigra (SN), lateral hypothalamus (LA), nucleus accumbens (NAcc), medial")
4 Bregma mm Bregma mm Bregma 1.1.mm Supplementary igure 1: DREADD expression in the VTA. Coronal sections of a virus-infected brain evaluating mcherry labeling in the ventral tegmental area (VTA), substantia nigra (SN), lateral hypothalamus (LA), nucleus accumbens (NAcc), medial forebrain bundle (mfb) and the frontal cortex. mcherry expression is evident only within the VTA. Blue-DAPI, redbregma 1.78 mm mcherry. Scale bar, 0.5 mm
5 % of change in social interactions (before and after CNO injection) ** Supplementary igure 2: DREADD-induced VTA activation increases social interaction. DREADD-induced activation increased the number of social interactions between cage mates. (n = 5; P < 0.01). Data represented as mean ± s.e.m.
6
7 Supplementary igure 3: activation induces small but specific changes in immune populations. Spleens from and control mice were subjected to analysis by CyTO mass cytometry (n = 5 per group; experiment #1 in Table S1). The identified cell clusters are represented as nodes in a Citrus derived circular dendrogram delineating lineage relationships as identified from the data. Cluster granularity (i.e. cell subset specificity) increases from the center of the diagram to the periphery. (a) The expression intensity of each marker used for cell population characterization is overlaid per cluster on the Citrus circular dendrogram and is indicated, independently for each marker, by the colored gradient whose range corresponds to the arcsinh transformed expression of the median marker expression measured across all Citrus clusters. or each marker we also provide a dot plot graph demonstrating the marker labeling in the manually gated indicated population. (b) Citrus plots showing, per marker, the clusters (pink) for which testing of group differences was restricted to based on an unsupervised application of a Probability of Expression (POE) algorithm. Shown is the POE information for the six markers in which group differences were identified, (c) Citrus plots delineating lineage relationships as identified from the data and group differences. Individual cell clusters are mapped to well established, gross-cell types: B cells (CD45R + CD79b + ), CD8 + T cells (TCRβ + CD8 + ), CD4 + T cells (TCRβ + CD4 + ), NK cells (NK1.1 + CD49b + ), granulocytes (CD11b + Gr-1 + ), monocytes/macrophages (CD11b + CD14 + 4/80 + ) and dendritic cells (CD11c+) identifiable by annotated shaded background groupings. Cell subsets, not well defined by these criteria were left white. Differences in functional markers expression for cell clusters in the spleen of and control mice are indicated for each cell cluster by one or more colored rings, corresponding to different functional markers, in which the median expression is different between the two experimental groups. Changes are shown for CD80, CD86 and MHCII (left) and CD25, CD115 and TLR4 (right).
 was analyzed using ViSNE, an orthogonal analysis paradigm to Citrus, which relies on a")
8 Supplementary igure 4: ViSNE dimensionality reduction reveals subtle upregulation of protein expression in immune subpopulations. CyTO analysis of VTA and control mice (n = 5 per group, same experiment shown in Supplementary igure 3) was analyzed using ViSNE, an orthogonal analysis paradigm to Citrus, which relies on a nonlinear dimensionality reduction to two dimensions of single cell distances (measured on the same markers used for clustering in the Citrus analysis). On the upper left, is a ViSNE plot, colored for CD45 marker expression with ViSNE islands annotated to gross cell-types. Additional plots provide the baseline comparison ViSNE representation of TLR4, CD115, CD25, CD80, CD86 and MHCII median expression levels in control and mice. Color code indicates expression intensity.

9 Supplementary igure 5: Changes in blood cells following VTA activation. Blood cells from mice and controls were assayed by CyTO followed by Citrus clustering and analysis of group differences. Clusters represented as nodes in a Citrus-derived circular dendrogram. Individual cell clusters are mapped to well established, gross-cell types, identifiable by annotated shaded grey background groupings, with cluster granularity (i.e. cell subset specificity) increasing moving from the center of the diagram to the periphery. Colored clusters represent an increase in median expression of CD86 (n = 5 and 7).
10 a Serum IL4 (pg/ml) b Serum IL10 (pg/ml) c Serum TN- α (pg/ml) d Serum IN- (ng/ml) γ Supplementary igure 6: VTA activation does not induce changes in mouse serum cytokines. Serum samples of and control mice were analyzed for their cytokines levels using standard ELISA kits. The results are reported following background subtraction and calculation of pg or ng /ml levels of each cytokine (n = 6). Data represented as mean ± s.e.m.
 Peritoneal unstained cells two hours following i.p. injection of non- fluorescent E.")

11 a b c Unstained cells CD11b stain only CD11b+ GP GP CD11b (PerCP) Supplementary igure 7: Validation of GP fluorescence on peritoneal CD11b+ cells. Validation of the GP levels of peritoneal CD11b+ cells from mice infected with nonfluorescent E. coli or GP-E. coli. (a) Peritoneal unstained cells two hours following i.p. injection of non- fluorescent E. coli. (b) Peritoneal cells two hours after i.p. injection of nonfluorescent E. coli stained with anti CD11b PerCP conjugated antibody. (c) Peritoneal cells two hours after i.p. injection of GP-expressing E. coli stained with anti CD11b PerCP conjugated antibody. CD11b high cells show increased levels of GP only after infection with GP-expressing bacteria.
 CyTO analysis of the changes in splenocytes derived from VTA mice and their controls seven days following E. coli i.p. injection. CyTO data using ViSNE analysis is represented on the left panel.")
12 Supplementary igure 8: CyTO and low cytometry analyses of splenocytes seven days after E. coli challenge reveal similar pattern of activation in control and VTA mice. (a) CyTO analysis of the changes in splenocytes derived from VTA mice and their controls seven days following E. coli i.p. injection. CyTO data using ViSNE analysis is represented on the left panel. The percentage of abundance for each population is provided in the right panel for each mouse. The gating strategy of the different cell subsets is demonstrated on a representative mouse. (b) Intracellular IN-γ expression represented as median fluorescence intensity (MI) of spleen T cells from VTA mice and their controls (n = 4). Data represented as mean ± s.e.m.
13 Supplementary igure 9: VTA activation has no effect on the immune system in sympathetically-ablated mice. To evaluate the impact of VTA activation in the absence of SNS, we compared the CyTO analysis between two groups of mice, both treated with 6- OHDA. Cell clusters are represented as nodes in a circular dendrogram delineating lineage relationships as identified from the data. Individual cell clusters are mapped to well established, gross-cell types, identifiable by annotated shaded grey background groupings, with cluster granularity (i.e. cell subset specificity) increasing moving from the center of the diagram to the periphery. Cell clusters that demonstrated change in cell abundance are circled in grey. The observed changes were mainly in cell clusters that could not be characterized, as they did not express any of the cell-type markers used in the assay. No other differences were detected even at DR 50%. We repeated the experiment two independent times, with qualitatively similar results (n = 6 and 8).
 CD25 VTA 0.68 0.83 0.83 0.93 0.76 0.74 0.77 0.85 0.72 0.85 0.75 0.84 (P<0.067) CD80 VTA 1.34 1.83 1.55 1.76 1.57 1.75 1.58 1.85 1.42 1.65 1.49 1.77 (P<0.018) CD86 VTA 1.21 1.46 1.39 1.52 1.33 1.")
 CD25 0.28 0.36 0.35 0.42 0.32 0.43 0.36 0.48 0.30 0.37 0.32 0.41 (P<0.020) CD80 0.58 0.92 0.72 0.88 0.69 0.89 0.75 0.93 0.57 0.71 0.66 0.87 (P<0.020) CD86 0.53 0.74 0.64 0.77 0.58 0.80 0.66 0.84 0.")
 CD115 0.34 0.34 0.33 0.41 0.31 0.38 0.40 0.45 0.37 0.51 0.35 0.42 (P<0.083) CD25 0.74 0.79 0.73 0.92 0.65 0.93 0.78 0.92 0.72 0.88 0.72 0.89 (P<0.018) CD80 1.42 1.65 1.48 1.49 1.35 1.62 1.48 1.79 1.")
14 igure S10 4/80 CD11b CD11b+ 4/80+ TLR4 VTA (P<0.065) CD115 VTA (P<0.067) CD25 VTA (P<0.067) CD80 VTA (P<0.018) CD86 VTA (P<0.02) CD79b CD45R+ CD79b+ TLR (P<0.020) CD (P<0.020) CD (P<0.020) CD (P<0.020) CD (P<0.020) MHCII (P<0.258) CD45R CD11b CD11c CD11c+ TLR (P<0.028) CD (P<0.083) CD (P<0.018) CD (P<0.021) CD (P<0.020) MHCII (P<0.021) CD4 TCRβ TCRβ+ CD4+ CD25 VTA (P<0.056) Supplementary igure 10: Manually gated single cell CyTO data and effect size of functional marker differences. Broad manual gates of single cell CyTO data are shown for the key populations (macrophages, B-cells, dendritic cells and CD4 T-cells) in which the Citrus-based analysis identified differences between naive and control mice in a single independent experiment (experiment #1 of Table S1). Median (arcsinh transformed) functional marker intensity values are shown for TLR4, CD115, CD25, CD80, CD86 and MHCII in each mouse, as well as a Student t-test Benjamini-Hochberg adjusted p-value for group differences. The gating strategy is demonstrated on a single mouse.

15 igure S11 Macrophages CD11b+ 4/80+ Dendritic cells CD11c+ B cells CD45R+ CD79b+ CD4 T cells TCR β+ CD4+ CD8 T cells TCR β+ CD8+ CD45 CD115 CD115 Macrophages CD11b+ 4/80+ Dendritic cells CD11c+ B cells CD45R+ CD79b+ CD4 T cells TCR β+ CD4+ CD8 T cells TCR β+ CD8+ TLR4 Macrophages CD11b+ 4/80+ Dendritic cells CD11c+ B cells CD45R+ CD79b+ CD4 T cells TCR β+ CD4+ CD8 T cells TCR β+ CD8+ CD80 Macrophages CD11b+ 4/80+ Dendritic cells CD11c+ B cells CD45R+ CD79b+ CD4 T cells TCR β+ CD4+ CD8 T cells TCR β+ CD8+ CD86 Macrophages CD11b+ 4/80+ Dendritic cells CD11c+ B cells CD45R+ CD79b+ CD4 T cells TCR β+ CD4+ CD8 T cells TCR β+ CD8+ CD45 CD45 CD45 CD45 CD45 CD25 Supplementary igure 11: Expression pattern of low intensity markers affected by VTA activation across immune populations. Single cell dot plots representing CD115, TLR4, CD80, CD86, and CD25 expression of different immune populations as indicated above each panel in immunologically naïve mice. The scale of marker intensity is adjusted for each marker as indicated.


16 B cells: CD45R+, CD79b+ 4.16% CD4 T cells: TCRβ+, CD % B cells: CD45R+, CD79b+ CD4 T cells: TCRβ+,CD % 9.65% CCR7 expression CD69 expression CCR7 CCR7 CD69 CD69 CD4 T cells: TCRβ+,CD % Granulocytes: CD11b+,Gr % CD8 T cells: TCRβ+, CD8+ B cells: CD45R+, CD79b+ 0.11% 64.53% CCR3 expression IgM expression CCR3 CCR3 IgM IgM CD8 T cells: TCRβ +, CD8+ Macrophages: CD11b+, 4/ % 10.45% B cells: CD45R+, CD79b+ CD4 T cells: TCR β+,cd % 19.0% CD206 expression CD28 expression CD206 CD206 CD206 CD206 CD28 CD28 CD8 T cells: TCRβ +, CD8+ Dendritic cells: CD11c % 33.64% TLR2 expression TLR2 TLR2 B cells: CD45R+, CD79b+ CD4 T cells: TCR β +,CD % 79.92% CD27 expression CD27 CD27 CD8 T cells: TCRβ+, CD8+ B cells: CD45R+, CD79b % 21.68% CD138 expression CD138 CD138 Supplementary igure 12: Single cell CyTO data demonstrating marker reliability. Arcsinh transformed CyTO single cell data shown for all pertinent functional markers not affected by activation, in immunologically naïve mice.
 CD11b CD80 Count CD86 (MI±SEM) 994±54 1254±59 (P<0.")
 TLR4 Count CD115 (MI±SEM) 1784±75 2036 ± 36 (P<0.04) CD115 Count CD25 (MI±SEM) 196±7 236±2 (P<0.")


17 4/80 Count CD80 (MI±SEM) 1961± ±266 (P<0.018) CD11b CD80 Count CD86 (MI±SEM) 994± ±59 (P<0.058) CD86 Count TLR4 (MI±SEM) 386±14 550±14 (P<0.003) TLR4 Count CD115 (MI±SEM) 1784± ± 36 (P<0.04) CD115 Count CD25 (MI±SEM) 196±7 236±2 (P<0.013) CD25 Supplementary igure 13: low cytometry validation of activation effects on the expression of CD80, CD86, TLR4, CD115 and CD25 on monocytes and macrophages. We isolated monocytes/macrophages from the spleens of mice and their controls 24h after CNO injection. We labeled the cells with fluorescently labeled antibodies to CD11b, 4/80, CD80, CD86, TLR4, CD115 and CD25. The cells were then analyzed by flow cytometry for the expression of these markers of cells gated based on the CD11b, 4/80 staining as demonstrated in the left panel. In the right panels, representative histograms are shown. The average MI ± s.e.m. per group are shown. As each marker was analyzed individually, p values were evaluated by student s t- test (n = 3 mice per group).
Nature Immunology: doi: /ni Supplementary Figure 1. Examples of staining for each antibody used for the mass cytometry analysis.
 Supplementary Figure 1 Examples of staining for each antibody used for the mass cytometry analysis. To illustrate the functionality of each antibody probe, representative plots illustrating the expected
Categorical analysis of human T cell heterogeneity with One-SENSE
 1 2 3 4 Supplementary Information Categorical analysis of human T cell heterogeneity with One-SENSE 5 6 Running title: T cell Analysis by One-SENSE 7 8 9 1 11 12 13 14 15 16 17 18 19 2 21 22 23 24 25 26
Supplementary Figure 1. Characterization of basophils after reconstitution of SCID mice
 Supplementary figure legends Supplementary Figure 1. Characterization of after reconstitution of SCID mice with CD4 + CD62L + T cells. (A-C) SCID mice (n = 6 / group) were reconstituted with 2 x 1 6 CD4
SUPPLEMENTARY INFORMATION
 doi:1.138/nature1554 a TNF-α + in CD4 + cells [%] 1 GF SPF 6 b IL-1 + in CD4 + cells [%] 5 4 3 2 1 Supplementary Figure 1. Effect of microbiota on cytokine profiles of T cells in GALT. Frequencies of TNF-α
Supplementary Figure 1: TSLP receptor skin expression in dcssc. A: Healthy control (HC) skin with TSLP receptor expression in brown (10x
 skin with TSLP receptor expression in brown (10x") Supplementary Figure 1: TSLP receptor skin expression in dcssc. A: Healthy control (HC) skin with TSLP receptor expression in brown (10x magnification). B: Second HC skin stained for TSLP receptor in brown
Supplementary Figure 1: TSLP receptor skin expression in dcssc. A: Healthy control (HC) skin with TSLP receptor expression in brown (10x magnification). B: Second HC skin stained for TSLP receptor in brown
SUPPLEMENTARY INFORMATION
 doi:10.1038/nature10134 Supplementary Figure 1. Anti-inflammatory activity of sfc. a, Autoantibody immune complexes crosslink activating Fc receptors, promoting activation of macrophages, and WWW.NATURE.COM/NATURE
Eosinophils are required. for the maintenance of plasma cells in the bone marrow
 Eosinophils are required for the maintenance of plasma cells in the bone marrow Van Trung Chu, Anja Fröhlich, Gudrun Steinhauser, Tobias Scheel, Toralf Roch, Simon Fillatreau, James J. Lee, Max Löhning
Supplementary Figure 1. mrna expression of chitinase and chitinase-like protein in splenic immune cells. Each splenic immune cell population was
 Supplementary Figure 1. mrna expression of chitinase and chitinase-like protein in splenic immune cells. Each splenic immune cell population was sorted by FACS. Surface markers for sorting were CD11c +
Supplementary Materials Extracting a Cellular Hierarchy from High-dimensional Cytometry Data with SPADE
 Supplementary Materials Extracting a Cellular Hierarchy from High-dimensional Cytometry Data with SPADE Peng Qiu1,4, Erin F. Simonds2, Sean C. Bendall2, Kenneth D. Gibbs Jr.2, Robert V. Bruggner2, Michael
Supplemental Table I.
 Supplemental Table I Male / Mean ± SEM n Mean ± SEM n Body weight, g 29.2±0.4 17 29.7±0.5 17 Total cholesterol, mg/dl 534.0±30.8 17 561.6±26.1 17 HDL-cholesterol, mg/dl 9.6±0.8 17 10.1±0.7 17 Triglycerides,
% of live splenocytes. STAT5 deletion. (open shapes) % ROSA + % floxed
 % ROSA + % floxed") Supp. Figure 1. a 14 1 1 8 6 spleen cells (x1 6 ) 16 % of live splenocytes 5 4 3 1 % of live splenocytes 8 6 4 b 1 1 c % of CD11c + splenocytes (closed shapes) 8 6 4 8 6 4 % ROSA + (open shapes) % floxed
Supp. Figure 1. a 14 1 1 8 6 spleen cells (x1 6 ) 16 % of live splenocytes 5 4 3 1 % of live splenocytes 8 6 4 b 1 1 c % of CD11c + splenocytes (closed shapes) 8 6 4 8 6 4 % ROSA + (open shapes) % floxed
Supplemental Figure 1. Signature gene expression in in vitro differentiated Th0, Th1, Th2, Th17 and Treg cells. (A) Naïve CD4 + T cells were cultured
 Naïve CD4 + T cells were cultured") Supplemental Figure 1. Signature gene expression in in vitro differentiated Th0, Th1, Th2, Th17 and Treg cells. (A) Naïve CD4 + T cells were cultured under Th0, Th1, Th2, Th17, and Treg conditions. mrna
Supplemental Figure 1. Signature gene expression in in vitro differentiated Th0, Th1, Th2, Th17 and Treg cells. (A) Naïve CD4 + T cells were cultured under Th0, Th1, Th2, Th17, and Treg conditions. mrna
SUPPORTING INFORMATIONS
 SUPPORTING INFORMATIONS Mice MT/ret RetCD3ε KO α-cd25 treated MT/ret Age 1 month 3 mnths 6 months 1 month 3 months 6 months 1 month 3 months 6 months 2/87 Survival 87/87 incidence of 17/87 1 ary tumor
sequences of a styx mutant reveals a T to A transversion in the donor splice site of intron 5
 sfigure 1 Styx mutant mice recapitulate the phenotype of SHIP -/- mice. (A) Analysis of the genomic sequences of a styx mutant reveals a T to A transversion in the donor splice site of intron 5 (GTAAC
Supplemental Information. Aryl Hydrocarbon Receptor Controls. Monocyte Differentiation. into Dendritic Cells versus Macrophages
 Immunity, Volume 47 Supplemental Information Aryl Hydrocarbon Receptor Controls Monocyte Differentiation into Dendritic Cells versus Macrophages Christel Goudot, Alice Coillard, Alexandra-Chloé Villani,
Supplementary Figure S1. Flow cytometric analysis of the expression of Thy1 in NH cells. Flow cytometric analysis of the expression of T1/ST2 and
 Supplementary Figure S1. Flow cytometric analysis of the expression of Thy1 in NH cells. Flow cytometric analysis of the expression of T1/ST2 and Thy1 in NH cells derived from the lungs of naïve mice.
SUPPLEMENTARY FIGURES
 SUPPLEMENTARY FIGURES Supplementary Figure 1: Chemokine receptor expression profiles of CCR6 + and CCR6 - CD4 + IL-17A +/ex and Treg cells. Quantitative PCR analysis of chemokine receptor transcript abundance
pplementary Figur Supplementary Figure 1. a.
 pplementary Figur Supplementary Figure 1. a. Quantification by RT-qPCR of YFV-17D and YFV-17D pol- (+) RNA in the supernatant of cultured Huh7.5 cells following viral RNA electroporation of respective
Supporting Information
 Supporting Information Desnues et al. 10.1073/pnas.1314121111 SI Materials and Methods Mice. Toll-like receptor (TLR)8 / and TLR9 / mice were generated as described previously (1, 2). TLR9 / mice were
L-selectin Is Essential for Delivery of Activated CD8 + T Cells to Virus-Infected Organs for Protective Immunity
 Cell Reports Supplemental Information L-selectin Is Essential for Delivery of Activated CD8 + T Cells to Virus-Infected Organs for Protective Immunity Rebar N. Mohammed, H. Angharad Watson, Miriam Vigar,
Supplementary Information. Tissue-wide immunity against Leishmania. through collective production of nitric oxide
 Supplementary Information Tissue-wide immunity against Leishmania through collective production of nitric oxide Romain Olekhnovitch, Bernhard Ryffel, Andreas J. Müller and Philippe Bousso Supplementary
IMMUNE CELL SURFACE RECEPTORS AND THEIR FUNCTIONS
 LECTURE: 07 Title: IMMUNE CELL SURFACE RECEPTORS AND THEIR FUNCTIONS LEARNING OBJECTIVES: The student should be able to: The chemical nature of the cellular surface receptors. Define the location of the
Supplemental Figure 1
 Supplemental Figure 1 1a 1c PD-1 MFI fold change 6 5 4 3 2 1 IL-1α IL-2 IL-4 IL-6 IL-1 IL-12 IL-13 IL-15 IL-17 IL-18 IL-21 IL-23 IFN-α Mut Human PD-1 promoter SBE-D 5 -GTCTG- -1.2kb SBE-P -CAGAC- -1.kb
W/T Itgam -/- F4/80 CD115. F4/80 hi CD115 + F4/80 + CD115 +
 F4/8 % in the peritoneal lavage 6 4 2 p=.15 n.s p=.76 CD115 F4/8 hi CD115 + F4/8 + CD115 + F4/8 hi CD115 + F4/8 + CD115 + MHCII MHCII Supplementary Figure S1. CD11b deficiency affects the cellular responses
Supplementary Figure 1 Protease allergens induce IgE and IgG1 production. (a-c)
") 1 Supplementary Figure 1 Protease allergens induce IgE and IgG1 production. (a-c) Serum IgG1 (a), IgM (b) and IgG2 (c) concentrations in response to papain immediately before primary immunization (day
1 Supplementary Figure 1 Protease allergens induce IgE and IgG1 production. (a-c) Serum IgG1 (a), IgM (b) and IgG2 (c) concentrations in response to papain immediately before primary immunization (day
Supplementary Figure 1. IL-12 serum levels and frequency of subsets in FL patients. (A) IL-12
 IL-12") 1 Supplementary Data Figure legends Supplementary Figure 1. IL-12 serum levels and frequency of subsets in FL patients. (A) IL-12 serum levels measured by multiplex ELISA (Luminex) in FL patients before
1 Supplementary Data Figure legends Supplementary Figure 1. IL-12 serum levels and frequency of subsets in FL patients. (A) IL-12 serum levels measured by multiplex ELISA (Luminex) in FL patients before
Nature Immunology: doi: /ni Supplementary Figure 1. Cytokine pattern in skin in response to urushiol.
 Supplementary Figure 1 Cytokine pattern in skin in response to urushiol. Wild-type (WT) and CD1a-tg mice (n = 3 per group) were sensitized and challenged with urushiol (uru) or vehicle (veh). Quantitative
CD44
 MR1-5-OP-RU CD24 CD24 CD44 MAIT cells 2.78 11.2 WT RORγt- GFP reporter 1 5 1 4 1 3 2.28 1 5 1 4 1 3 4.8 1.6 8.1 1 5 1 4 1 3 1 5 1 4 1 3 3.7 3.21 8.5 61.7 1 2 1 3 1 4 1 5 TCRβ 2 1 1 3 1 4 1 5 CD44 1 2 GFP
Blocking antibodies and peptides. Rat anti-mouse PD-1 (29F.1A12, rat IgG2a, k), PD-
, PD-") Supplementary Methods Blocking antibodies and peptides. Rat anti-mouse PD-1 (29F.1A12, rat IgG2a, k), PD- L1 (10F.9G2, rat IgG2b, k), and PD-L2 (3.2, mouse IgG1) have been described (24). Anti-CTLA-4 (clone
Supplementary Methods Blocking antibodies and peptides. Rat anti-mouse PD-1 (29F.1A12, rat IgG2a, k), PD- L1 (10F.9G2, rat IgG2b, k), and PD-L2 (3.2, mouse IgG1) have been described (24). Anti-CTLA-4 (clone
Supplemental Figure Legends
 Supplemental Figure Legends Supplemental Figure 1. SemaB / mice have normal immune cell populations. Cells were prepared from the spleens of WT and SemaB / mice, stained with various antibodies and then
Supplementary Figure 1
 Supplementary Figure 1 Identification of IFN-γ-producing CD8 + and CD4 + T cells with naive phenotype by alternative gating and sample-processing strategies. a. Contour 5% probability plots show definition
SUPPLEMENTARY INFORMATION
 Supplemental Figure 1. Furin is efficiently deleted in CD4 + and CD8 + T cells. a, Western blot for furin and actin proteins in CD4cre-fur f/f and fur f/f Th1 cells. Wild-type and furin-deficient CD4 +
Table S1. Viral load and CD4 count of HIV-infected patient population
 Table S1. Viral load and CD4 count of HIV-infected patient population Subject ID Viral load (No. of copies per ml of plasma) CD4 count (No. of cells/µl of blood) 28 7, 14 29 7, 23 21 361,99 94 217 7, 11
<10. IL-1β IL-6 TNF + _ TGF-β + IL-23
 3 ns 25 ns 2 IL-17 (pg/ml) 15 1 ns ns 5 IL-1β IL-6 TNF
B220 CD4 CD8. Figure 1. Confocal Image of Sensitized HLN. Representative image of a sensitized HLN
 B220 CD4 CD8 Natarajan et al., unpublished data Figure 1. Confocal Image of Sensitized HLN. Representative image of a sensitized HLN showing B cell follicles and T cell areas. 20 µm thick. Image of magnification
D CD8 T cell number (x10 6 )
") IFNγ Supplemental Figure 1. CD T cell number (x1 6 ) 18 15 1 9 6 3 CD CD T cells CD6L C CD5 CD T cells CD6L D CD8 T cell number (x1 6 ) 1 8 6 E CD CD8 T cells CD6L F Log(1)CFU/g Feces 1 8 6 p
IFNγ Supplemental Figure 1. CD T cell number (x1 6 ) 18 15 1 9 6 3 CD CD T cells CD6L C CD5 CD T cells CD6L D CD8 T cell number (x1 6 ) 1 8 6 E CD CD8 T cells CD6L F Log(1)CFU/g Feces 1 8 6 p
Supplementary Materials for
 www.sciencesignaling.org/cgi/content/full/8/381/ra59/dc1 Supplementary Materials for Analysis of single-cell cytokine secretion reveals a role for paracrine signaling in coordinating macrophage responses
Supporting Information
 Supporting Information Idoyaga et al. 10.1073/pnas.0812247106 SSC a) Single cell suspension 99 Aqua b) Live cells 96 -W c) Singlets 92 -A CD19+ER119 d) CD19 ER119 cells 97 CD3 e) CD3 cells 27 f) DX5 cells
Nature Neuroscience: doi: /nn Supplementary Figure 1. Splenic atrophy and leucopenia caused by T3 SCI.
 Supplementary Figure 1 Splenic atrophy and leucopenia caused by T3 SCI. (a) Gross anatomy of representative spleens from control and T3 SCI mice at 28 days post-injury. (b and c) Hematoxylin and eosin
Supplementary Figures. T Cell Factor-1 initiates T helper 2 fate by inducing GATA-3 and repressing Interferon-γ
 Supplementary Figures T Cell Factor-1 initiates T helper 2 fate by inducing GATA-3 and repressing Interferon-γ Qing Yu, Archna Sharma, Sun Young Oh, Hyung-Geun Moon, M. Zulfiquer Hossain, Theresa M. Salay,
BCR-ABL - LSK BCR-ABL + LKS - (%)
") Marker Clone BCR-ABL + LSK (%) BCR-ABL + LKS - (%) BCR-ABL - LSK (%) P value vs. BCR-ABL + LKS - P value vs. BCR-ABL - LSK CD2 RM2-5 12.9 ± 3.6 36.7 ± 6.5 19.3 ± 2.4 0.01 0.10 CD5 53-7.3 13.9 ± 3.2 20.8
Marker Clone BCR-ABL + LSK (%) BCR-ABL + LKS - (%) BCR-ABL - LSK (%) P value vs. BCR-ABL + LKS - P value vs. BCR-ABL - LSK CD2 RM2-5 12.9 ± 3.6 36.7 ± 6.5 19.3 ± 2.4 0.01 0.10 CD5 53-7.3 13.9 ± 3.2 20.8
Supplemental Information. Genomic Characterization of Murine. Monocytes Reveals C/EBPb Transcription. Factor Dependence of Ly6C Cells
 Immunity, Volume 46 Supplemental Information Genomic Characterization of Murine Monocytes Reveals C/EBPb Transcription Factor Dependence of Ly6C Cells Alexander Mildner, Jörg Schönheit, Amir Giladi, Eyal
Dual Targeting Nanoparticle Stimulates the Immune
 Dual Targeting Nanoparticle Stimulates the Immune System to Inhibit Tumor Growth Alyssa K. Kosmides, John-William Sidhom, Andrew Fraser, Catherine A. Bessell, Jonathan P. Schneck * Supplemental Figure
Supplementary Figure 1. Immune profiles of untreated and PD-1 blockade resistant EGFR and Kras mouse lung tumors (a) Total lung weight of untreated
 Total lung weight of untreated") 1 Supplementary Figure 1. Immune profiles of untreated and PD-1 blockade resistant EGFR and Kras mouse lung tumors (a) Total lung weight of untreated (U) EGFR TL mice (n=7), Kras mice (n=7), PD-1 blockade
1 Supplementary Figure 1. Immune profiles of untreated and PD-1 blockade resistant EGFR and Kras mouse lung tumors (a) Total lung weight of untreated (U) EGFR TL mice (n=7), Kras mice (n=7), PD-1 blockade
SUPPLEMENTARY METHODS
 SUPPLEMENTARY METHODS Histological analysis. Colonic tissues were collected from 5 parts of the middle colon on day 7 after the start of DSS treatment, and then were cut into segments, fixed with 4% paraformaldehyde,
Supplementary Figure 1. BMS enhances human T cell activation in vitro in a
 Supplementary Figure 1. BMS98662 enhances human T cell activation in vitro in a concentration-dependent manner. Jurkat T cells were activated with anti-cd3 and anti-cd28 antibody in the presence of titrated
well for 2 h at rt. Each dot represents an individual mouse and bar is the mean ±
 Supplementary data: Control DC Blimp-1 ko DC 8 6 4 2-2 IL-1β p=.5 medium 8 6 4 2 IL-2 Medium p=.16 8 6 4 2 IL-6 medium p=.3 5 4 3 2 1-1 medium IL-1 n.s. 25 2 15 1 5 IL-12(p7) p=.15 5 IFNγ p=.65 4 3 2 1
Kerdiles et al - Figure S1
 Kerdiles et al - Figure S1 a b Homo sapiens T B ce ce l ls c l M ls ac r PM oph N ag es Mus musculus Foxo1 PLCγ Supplementary Figure 1 Foxo1 expression pattern is conserved between mouse and human. (a)
Supplementary Figure 1. Nature Neuroscience: doi: /nn.4547
 Supplementary Figure 1 Characterization of the Microfetti mouse model. (a) Gating strategy for 8-color flow analysis of peripheral Ly-6C + monocytes from Microfetti mice 5-7 days after TAM treatment. Living
Hua Tang, Weiping Cao, Sudhir Pai Kasturi, Rajesh Ravindran, Helder I Nakaya, Kousik
 SUPPLEMENTARY FIGURES 1-19 T H 2 response to cysteine-proteases requires dendritic cell-basophil cooperation via ROS mediated signaling Hua Tang, Weiping Cao, Sudhir Pai Kasturi, Rajesh Ravindran, Helder
Supplementary Figures
 Inhibition of Pulmonary Anti Bacterial Defense by IFN γ During Recovery from Influenza Infection By Keer Sun and Dennis W. Metzger Supplementary Figures d a Ly6G Percentage survival f 1 75 5 1 25 1 5 1
Supplementary Figure S1. PTPN2 levels are not altered in proliferating CD8+ T cells. Lymph node (LN) CD8+ T cells from C57BL/6 mice were stained with
 CD8+ T cells from C57BL/6 mice were stained with") Supplementary Figure S1. PTPN2 levels are not altered in proliferating CD8+ T cells. Lymph node (LN) CD8+ T cells from C57BL/6 mice were stained with CFSE and stimulated with plate-bound α-cd3ε (10µg/ml)
Supplementary Figure S1. PTPN2 levels are not altered in proliferating CD8+ T cells. Lymph node (LN) CD8+ T cells from C57BL/6 mice were stained with CFSE and stimulated with plate-bound α-cd3ε (10µg/ml)
NK cell flow cytometric assay In vivo DC viability and migration assay
 NK cell flow cytometric assay 6 NK cells were purified, by negative selection with the NK Cell Isolation Kit (Miltenyi iotec), from spleen and lymph nodes of 6 RAG1KO mice, injected the day before with
The autoimmune disease-associated PTPN22 variant promotes calpain-mediated Lyp/Pep
 SUPPLEMENTARY INFORMATION The autoimmune disease-associated PTPN22 variant promotes calpain-mediated Lyp/Pep degradation associated with lymphocyte and dendritic cell hyperresponsiveness Jinyi Zhang, Naima
Nature Neuroscience doi: /nn Supplementary Figure 1. Characterization of viral injections.
 Supplementary Figure 1 Characterization of viral injections. (a) Dorsal view of a mouse brain (dashed white outline) after receiving a large, unilateral thalamic injection (~100 nl); demonstrating that
Supplemental Information. Granulocyte-Monocyte Progenitors and. Monocyte-Dendritic Cell Progenitors Independently
 Immunity, Volume 47 Supplemental Information Granulocyte-Monocyte Progenitors and Monocyte-endritic ell Progenitors Independently Produce Functionally istinct Monocytes lberto Yáñez, Simon G. oetzee, ndre
Supplemental Materials for. Effects of sphingosine-1-phosphate receptor 1 phosphorylation in response to. FTY720 during neuroinflammation
 Supplemental Materials for Effects of sphingosine-1-phosphate receptor 1 phosphorylation in response to FTY7 during neuroinflammation This file includes: Supplemental Table 1. EAE clinical parameters of
effect on the upregulation of these cell surface markers. The mean peak fluorescence intensity
 SUPPLEMENTARY FIGURE 1 Supplementary Figure 1 ASIC1 disruption or blockade does not effect in vitro and in vivo antigen-presenting cell activation. (a) Flow cytometric analysis of cell surface molecules
Supplemental Table 1. Primer sequences for transcript analysis
 Supplemental Table 1. Primer sequences for transcript analysis Primer Sequence (5 3 ) Primer Sequence (5 3 ) Mmp2 Forward CCCGTGTGGCCCTC Mmp15 Forward CGGGGCTGGCT Reverse GCTCTCCCGGTTTC Reverse CCTGGTGTGCCTGCTC
The encephalitogenicity of TH17 cells is dependent on IL-1- and IL-23- induced production of the cytokine GM-CSF
 CORRECTION NOTICE Nat.Immunol. 12, 568 575 (2011) The encephalitogenicity of TH17 cells is dependent on IL-1- and IL-23- induced production of the cytokine GM-CSF Mohamed El-Behi, Bogoljub Ciric, Hong
Supplementary Figure 1. Recording sites.
 Supplementary Figure 1 Recording sites. (a, b) Schematic of recording locations for mice used in the variable-reward task (a, n = 5) and the variable-expectation task (b, n = 5). RN, red nucleus. SNc,
Supplementary Materials for
 www.sciencemag.org/content/348/6241/aaa825/suppl/dc1 Supplementary Materials for A mucosal vaccine against Chlamydia trachomatis generates two waves of protective memory T cells Georg Stary,* Andrew Olive,
CD4 + T cells recovered in Rag2 / recipient ( 10 5 ) Heart Lung Pancreas
 Heart Lung Pancreas") a CD4 + T cells recovered in Rag2 / recipient ( 1 5 ) Heart Lung Pancreas.5 1 2 4 6 2 4 6 Ctla4 +/+ Ctla4 / Ctla4 / Lung Ctla4 / Pancreas b Heart Lung Pancreas Ctla4 +/+ Ctla4 / Ctla4 / Lung Ctla4 / Pancreas
a CD4 + T cells recovered in Rag2 / recipient ( 1 5 ) Heart Lung Pancreas.5 1 2 4 6 2 4 6 Ctla4 +/+ Ctla4 / Ctla4 / Lung Ctla4 / Pancreas b Heart Lung Pancreas Ctla4 +/+ Ctla4 / Ctla4 / Lung Ctla4 / Pancreas
Supporting Information Table of Contents
 Supporting Information Table of Contents Supporting Information Figure 1 Page 2 Supporting Information Figure 2 Page 4 Supporting Information Figure 3 Page 5 Supporting Information Figure 4 Page 6 Supporting
Supplementary information to: Mechanism of lipopolysaccharide-induced skin edema formation in the mouse
 Supplementary information to: Mechanism of lipopolysaccharide-induced skin edema formation in the mouse Ivan Zanoni*, Renato Ostuni*, Simona Barresi, Marco Di Gioia, Achille Broggi, Barbara Costa, Roberta
Etv4 BU EMM Etv5 BC MMM UI-M-BH3- Elk1 BC MMM
 Supplementary Tables In situ hybridization probes Genbank Gene Accession Number Clone ID Cat. No Etv1 BC005645 PCR Etv4 BU053662 5062538 EMM1002-5544031 Etv5 BC034680 4036564 MMM1013-7511524 Fev AI876263
Supplementary Data. Treg phenotype
 Supplementary Data Additional Experiment An additional experiment was performed using cryopreserved peripheral blood mononuclear cells (PBMC) derived from five renal cell carcinoma (RCC) patients [see
CD80 and PD-L2 define functionally distinct memory B cell subsets that are. Griselda V Zuccarino-Catania, Saheli Sadanand, Florian J Weisel, Mary M
 Supplementary Figures CD8 and PD-L define functionally distinct memory B cell subsets that are independent of antibody isotype Running title: Memory B Cell Subset Function Griselda V Zuccarino-Catania,
Fluorochrome Panel 1 Panel 2 Panel 3 Panel 4 Panel 5 CTLA-4 CTLA-4 CD15 CD3 FITC. Bio) PD-1 (MIH4, BD) ICOS (C398.4A, Biolegend) PD-L1 (MIH1, BD)
 PD-1 (MIH4, BD) ICOS (C398.4A, Biolegend) PD-L1 (MIH1, BD)") Additional file : Table S. Antibodies used for panel stain to identify peripheral immune cell subsets. Panel : PD- signaling; Panel : CD + T cells, CD + T cells, B cells; Panel : Tregs; Panel :, -T, cdc,
Additional file : Table S. Antibodies used for panel stain to identify peripheral immune cell subsets. Panel : PD- signaling; Panel : CD + T cells, CD + T cells, B cells; Panel : Tregs; Panel :, -T, cdc,
4. Th1-related gene expression in infected versus mock-infected controls from Fig. 2 with gene annotation.
 List of supplemental information 1. Graph of mouse weight loss during course of infection- Line graphs showing mouse weight data during course of infection days 1 to 10 post-infections (p.i.). 2. Graph
Online supplement. Phenotypic, functional and plasticity features of classical and alternatively activated
 Online supplement Phenotypic, functional and plasticity features of classical and alternatively activated human macrophages Abdullah Al Tarique*, Jayden Logan *, Emma Thomas *, Patrick G Holt *, Peter
and follicular helper T cells is Egr2-dependent. (a) Diagrammatic representation of the
 Diagrammatic representation of the") Supplementary Figure 1. LAG3 + Treg-mediated regulation of germinal center B cells and follicular helper T cells is Egr2-dependent. (a) Diagrammatic representation of the experimental protocol for the
Supplementary Figure 1. LAG3 + Treg-mediated regulation of germinal center B cells and follicular helper T cells is Egr2-dependent. (a) Diagrammatic representation of the experimental protocol for the
Nature Immunology: doi: /ni Supplementary Figure 1. Cellularity of leukocytes and their progenitors in naive wild-type and Spp1 / mice.
 Supplementary Figure 1 Cellularity of leukocytes and their progenitors in naive wild-type and Spp1 / mice. (a, b) Gating strategies for differentiated cells including PMN (CD11b + Ly6G hi and CD11b + Ly6G
Supplementary Information
 Supplementary Information Distinct bone marrow-derived and tissue resident macrophage lineages proliferate at key stages during inflammation. 1 Luke C. Davies, 1 Marcela Rosas, 2 Stephen J. Jenkins, 1
Bezzi et al., Supplementary Figure 1 *** Nature Medicine: doi: /nm Pten pc-/- ;Zbtb7a pc-/- Pten pc-/- ;Pml pc-/- Pten pc-/- ;Trp53 pc-/-
 Gr-1 Gr-1 Gr-1 Bezzi et al., Supplementary Figure 1 a Gr1-CD11b 3 months Spleen T cells 3 months Spleen B cells 3 months Spleen Macrophages 3 months Spleen 15 4 8 6 c CD11b+/Gr1+ cells [%] 1 5 b T cells
Nature Immunology: doi: /ni Supplementary Figure 1. RNA-Seq analysis of CD8 + TILs and N-TILs.
 Supplementary Figure 1 RNA-Seq analysis of CD8 + TILs and N-TILs. (a) Schematic representation of the tumor and cell types used for the study. HNSCC, head and neck squamous cell cancer; NSCLC, non-small
a surface permeabilized
 a surface permeabilized RAW 64.7 P388D1 J774 b CD11b + Ly-6G - Blood Monocytes WT Supplementary Figure 1. Cell surface expression on macrophages and DCs. (a) RAW64.7, P388D1, and J774 cells were subjected
Nature Immunology: doi: /ni Supplementary Figure 1. Huwe1 has high expression in HSCs and is necessary for quiescence.
 Supplementary Figure 1 Huwe1 has high expression in HSCs and is necessary for quiescence. (a) Heat map visualizing expression of genes with a known function in ubiquitin-mediated proteolysis (KEGG: Ubiquitin
SUPPLEMENTARY FIGURE 1
 SUPPLEMENTARY FIGURE 1 A LN Cell count (1 ) 1 3 1 CD+ 1 1 CDL lo CD hi 1 CD+FoxP3+ 1 1 1 7 3 3 3 % of cells 9 7 7 % of cells CD+ 3 1 % of cells CDL lo CD hi 1 1 % of CD+ cells CD+FoxP3+ 3 1 % of CD+ T
ILC1 and ILC3 isolation and culture Following cell sorting, we confirmed that the recovered cells belonged to the ILC1, ILC2 and
 Supplementary Methods and isolation and culture Following cell sorting, we confirmed that the recovered cells belonged to the, ILC2 and subsets. For this purpose we performed intracellular flow cytometry
IL-34 is a tissue-restricted ligand of CSF1R required for the development of Langerhans cells and microglia
 Supplementary Figures IL-34 is a tissue-restricted ligand of CSF1R required for the development of Langerhans cells and microglia Yaming Wang, Kristy J. Szretter, William Vermi, Susan Gilfillan, Cristina
Supplementary Figure 1. Efficient DC depletion in CD11c.DOG transgenic mice
 Supplementary Figure 1. Efficient DC depletion in CD11c.DOG transgenic mice (a) CD11c.DOG transgenic mice (tg) were treated with 8 ng/g body weight (b.w.) diphtheria toxin (DT) i.p. on day -1 and every
Supplementary Table 1
 Supplementary Table 1 Flow Cytometry Antibodies Antibody Fluorochrome Clone Vendor CD45 PE-cyanine 7 30-F11 D ioscience CD3 Pacific lue 17A2 iolegend (San Diego, CA) CD11b APC M1/70 iolegend (San Diego,
Suppl Video: Tumor cells (green) and monocytes (white) are seeded on a confluent endothelial
 and monocytes (white) are seeded on a confluent endothelial") Supplementary Information Häuselmann et al. Monocyte induction of E-selectin-mediated endothelial activation releases VE-cadherin junctions to promote tumor cell extravasation in the metastasis cascade
Supplementary Information Häuselmann et al. Monocyte induction of E-selectin-mediated endothelial activation releases VE-cadherin junctions to promote tumor cell extravasation in the metastasis cascade
Nature Medicine: doi: /nm.3922
 Title: Glucocorticoid-induced tumor necrosis factor receptor-related protein co-stimulation facilitates tumor regression by inducing IL-9-producing helper T cells Authors: Il-Kyu Kim, Byung-Seok Kim, Choong-Hyun
Supplementary Figure 1 Cytokine receptors on developing thymocytes that can potentially signal Runx3d expression.
 Supplementary Figure 1 Cytokine receptors on developing thymocytes that can potentially signal Runx3d expression. (a) Characterization of c-independent SP8 cells. Stainings for maturation markers (top)
Expanded View Figures
 Gregory T Ellis et al Lung damage by monocyte TRIL allows coinfection EMO reports Expanded View Figures % survival Clinical score Influenza Matrix /HPRT (log ) CFU/L (log ) 3 irway early.7.7 + h Survival
DURACLONE IF BE CERTAIN ABOUT THE RESPONSE. l res. a il n c n. For Research Use Only - Not for use in Diagnostic procedures
 DURACLONE IF earch tria l res lc a om ic il n c n nio pa Yo ur BE CERTAIN ABOUT THE RESPONSE For Research Use Only - Not for use in Diagnostic procedures BE CERTAIN ABOUT THE RESPONSE The sensitive and
Supporting Information
 Supporting Information Aldridge et al. 10.1073/pnas.0900655106 Fig. S1. Flow diagram of sublethal (a) and lethal (b) influenza virus infections. (a) Infection of lung epithelial cells by influenza virus
Dopamine in Ube3a m-/p+ mice. Online Supplemental Material
 Online Supplemental Material S1 Supplemental Figure 1. Schematic of rate-dependent intracranial self-stimulation (ICSS) (A) Mice implanted with monopolar stimulating electrodes to the medial forebrain
Supplementary Information
 Supplementary Information Memory-type ST2 + CD + T cells participate in the steroid-resistant pathology of eosinophilic pneumonia Naoko Mato 1, 2, Kiyoshi Hirahara 2, Tomomi Ichikawa 2, Jin Kumagai 2,
Crucial role for human Toll-like receptor 4 in the development of contact allergy to nickel
 Supplementary Figures 1-8 Crucial role for human Toll-like receptor 4 in the development of contact allergy to nickel Marc Schmidt 1,2, Badrinarayanan Raghavan 1,2, Verena Müller 1,2, Thomas Vogl 3, György
Targeting tumour associated macrophages in anti-cancer therapies. Annamaria Gal Seminar Series on Drug Discovery Budapest 5 January 2018
 Targeting tumour associated macrophages in anti-cancer therapies Annamaria Gal Seminar Series on Drug Discovery Budapest 5 January 2018 Macrophages: Professional phagocytes of the myeloid lineage APC,
Nature Neuroscience: doi: /nn.4642
 Supplementary Figure 1 Recording sites and example waveform clustering, as well as electrophysiological recordings of auditory CS and shock processing following overtraining. (a) Recording sites in LC
Supplementary Figures
 Supplementary Figures Supplementary Fig. 1. Surface thiol groups and reduction of activated T cells. (a) Activated CD8 + T-cells have high expression levels of free thiol groups on cell surface proteins.
A Slfn2 mutation causes lymphoid and myeloid immunodeficiency due to loss of immune cell quiescence
 Supplementary Information A Slfn mutation causes lymphoid and myeloid immunodeficiency due to loss of immune cell quiescence Michael Berger, Philippe Kres, Karine Crozat, Xiaohong Li, Ben A. Croker, Owen
Fig. S1 A. week 4 week 6
 Fig. S1 Trabecular Number Trabecular Thickness number/mm 3.5 3. 2.5 2. 1.5 1..5 mm.45.4.35.3.25.2.15.1.5 SKG-c SKG-A mm 1.4 1.2 1..8.6.4.2 Trabecular Spacing D. week 4 week 6 Figure S1. MicroCT analysis
Supplemental Information. Checkpoint Blockade Immunotherapy. Induces Dynamic Changes. in PD-1 CD8 + Tumor-Infiltrating T Cells
 Immunity, Volume 50 Supplemental Information Checkpoint Blockade Immunotherapy Induces Dynamic Changes in PD-1 CD8 + Tumor-Infiltrating T Cells Sema Kurtulus, Asaf Madi, Giulia Escobar, Max Klapholz, Jackson
pro-b large pre-b small pre-b CCCP (µm) Rag1 -/- ;33.C9HCki
 Rag1 -/- ;33.C9HCki") a TMRM FI (Median) b TMRM FI (Median) c 20 15 10 5 0 8 6 4 2 0 pro-b large pre-b small pre-b 0 10 20 30 40 50 60 70 80 90 100 TMRM (nm) pro-b large pre-b small pre-b 0 1 2 4 8 16 32 64 128 256 CCCP (mm)
a TMRM FI (Median) b TMRM FI (Median) c 20 15 10 5 0 8 6 4 2 0 pro-b large pre-b small pre-b 0 10 20 30 40 50 60 70 80 90 100 TMRM (nm) pro-b large pre-b small pre-b 0 1 2 4 8 16 32 64 128 256 CCCP (mm)
(a) Significant biological processes (upper panel) and disease biomarkers (lower panel)
 Significant biological processes (upper panel) and disease biomarkers (lower panel)") Supplementary Figure 1. Functional enrichment analyses of secretomic proteins. (a) Significant biological processes (upper panel) and disease biomarkers (lower panel) 2 involved by hrab37-mediated secretory
Supplementary Figure 1. Functional enrichment analyses of secretomic proteins. (a) Significant biological processes (upper panel) and disease biomarkers (lower panel) 2 involved by hrab37-mediated secretory