Supplementary Figure 1. Immune profiles of untreated and PD-1 blockade resistant EGFR and Kras mouse lung tumors (a) Total lung weight of untreated
|
|
|
- Deborah Brown
- 5 years ago
- Views:
Transcription

1 1
 Total lung weight of untreated (U) EGFR TL mice (n=7), Kras mice (n=7), PD-1 blockade sensitive (S) EGFR")

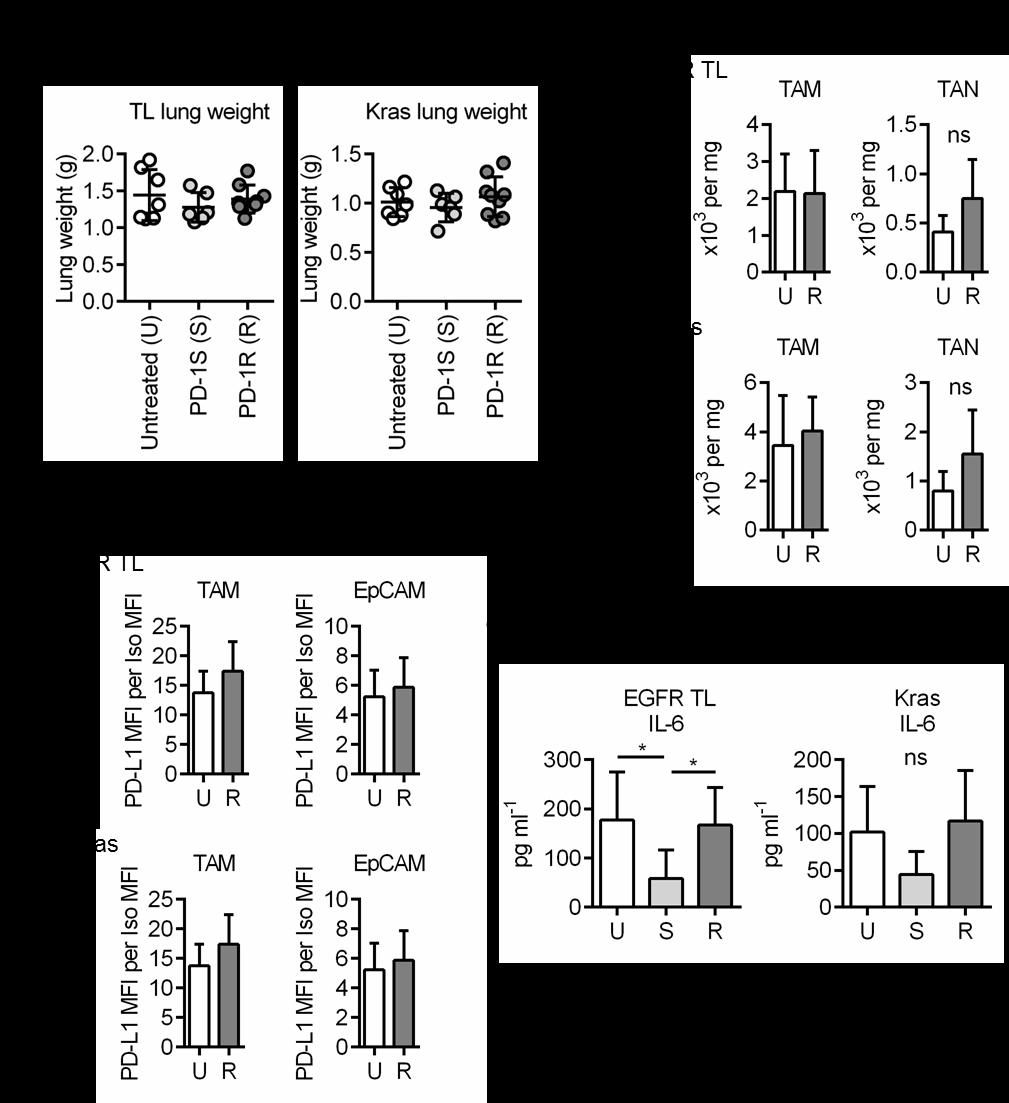
2 Supplementary Figure 1. Immune profiles of untreated and PD-1 blockade resistant EGFR and Kras mouse lung tumors (a) Total lung weight of untreated (U) EGFR TL mice (n=7), Kras mice (n=7), PD-1 blockade sensitive (S) EGFR TL mice (n=6), Kras mice (n=6) and resistant (R) EGFR TL mice (n=9), Kras mice (n=9). (b) Numbers of myeloid cells in EGFR TL (U:n=7, R:n=9) and Kras lung tumors (U:n=7, R:n=9). TAM: tumor associated macrophage, TAN: tumor associated neutrophil. (c) Mean of fold expression of PD-L1 MFI (mean fluorescent intensity) in tumorassociated macrophages (TAM) and tumor cells (CD45 - EpCAM + ) from EGFR TL (U:n=7, R:n=9) and Kras (U:n=7, R:n=9) lung tumors. (d) IL-6 production in BALFs from untreated (U) EGFR TL mice (n=7), Kras mice (n=7), PD-1S (S) EGFR TL mice (n=6), Kras mice (n=6) and PD-1R (R) EGFR TL mice (n=9), Kras mice (n=9). (e) Plots showing the relationship between therapeutic PD-1 antibody binding in CD4 and CD8 T cells and the duration of 2
3 treatment in PD-1 blockade resistant EGFR TL lung tumors (n=9) and Kras lung tumors (n=9). (f) TIM-3 expression and IFNγ production in CD8 T cells from EGFR TL mice (untreated: n=7, sensitive (1wk after treatment): n=6) and Kras (untreated: n=7 and sensitive: n=6). Data are shown as mean ± standard deviation (b,c,d,f). Statistical analysis was performed using Student's t test (b,c,f), one-way ANOVA with Tukey s multiple comparison test (d) and Pearson's correlation coefficient (e). 3
 RNAseq analysis of CD45 - EpCAM + tumor cells from PD-1")
 (b) Mean of fold expression of Galectin-9 and CEACAM1 in EGFR TL (untreated:n=3 and")
4 Supplementary Figure 2. The expression of Galectin-9 and CEACAM1 in untreated vs PD-1 resistant tumors (a) RNAseq analysis of CD45 - EpCAM + tumor cells from PD-1 naïve or PD-1 resistant tumors showing expression of selected immune related markers (*p=0.02, statistical analysis was performed using Limma) (b) Mean of fold expression of Galectin-9 and CEACAM1 in EGFR TL (untreated:n=3 and PD-1R:n=3) and Kras tumor cells (untreated:n=3 and PD-1R:n=3) shown as MFI (mean fluorescent intensity). Data are shown as mean ± standard deviation. *P<0.05, Student s t test. 4

5 Supplementary Figure 3. Co-expression of TIM-3 and CEACAM1 in T cells from PD-1 resistant tumors (a) Representative flow cytometry data of anti-pd-1 resistant EGFR TL tumors for CEACAM1 and TIM-3. Experiments were repeated three times. (b) Levels of CEACAM1 in CD4 and CD8 T cells as determined by flow showed no significant difference between untreated (EGFR TL:n=4 and Kras:n=5) and PD-1 resistance (EGFR TL:n=5 and Kras;n=6). Data are shown as mean ± standard deviation. 5
 MRI tumor volume measurements of all mice treated in the PD-1 and Tim3")
 Waterfall plots of MRI tumor volume measurements for individual EGFR TL mice treated in the anti-pd-1 and anti-tim-3 sequential treatment study.")
6 Supplementary Figure 4. Tumor volume measurements from mice treated with anti- PD-1 alone and anti-pd-1 plus sequential TIM-3 blockade (a) MRI tumor volume measurements of all mice treated in the PD-1 and Tim3 sequential treatment study. Each data point represents a different mouse at that time point. (b) Waterfall plots of MRI tumor volume measurements for individual EGFR TL mice treated in the anti-pd-1 and anti-tim-3 sequential treatment study. Mouse ID numbers are indicated on top of each graph and each data point represents MRI measurement at the indicated time points (in weeks) indicated on top of the columns. Black bars show tumor volumes on anti- PD-1 treatment, red bars show tumor volumes after anti-tim-3 is added to the anti-pd-1 treatment. 6
 Total lung weight of PD-1 resistant (PD-1R) (n=6), sequential anti-tim-3")
 Representative flow cytometry data showing CD8 T cells from sequential combo resistant tumors (Seq combr) with both PD-1 and TIM-3 therapeutic antibodies bound on their surface express high LAG-3")
7 Supplementary Figure 5. Anti-tumor efficacy and characteristics of T cells from EGFR TL mice treated with PD-1 and TIM-3 sequential combination (a) Total lung weight of PD-1 resistant (PD-1R) (n=6), sequential anti-tim-3 treated EGFR TL mice following anti-pd-1 blockade failure (Seq combs: n=6) and sequential combination resistance (Seq combr; n=3). (b) Representative flow cytometry data showing CD8 T cells from sequential combo resistant tumors (Seq combr) with both PD-1 and TIM-3 therapeutic antibodies bound on their surface express high LAG-3 and CTLA-4 but not BTLA nor VISTA. (c) The time-dependent increase in LAG-3 and CTLA-4 expression in CD8 T cells from sequential combo resistance (Seq combr: n=3) as compared to CD8 T cells from PD-1 resistant tumors (PD-1R) (n=6) and sequential combo sensitive (Seq combs; n=6). Data are shown as mean ± standard deviation. (*P<0.05, **P<0.01. ***P<0.001, one-way ANOVA with Tukey s multiple comparison test) 7
 Comparison of MRI tumor volume")

8 Supplementary Figure 6. Concurrent PD-1 and TIM-3 blockade did not show any significant advantage in anti-tumor effect in EGFR TL mice (a) Comparison of MRI tumor volume measurement of PD-1 antibody treatment alone or PD- 1 and TIM-3 antibody concurrent treatment. Each data point represents tumor volume of a different mouse at that time point. (b) Total lung weight and lung tumor immune analysis including T cell activation and checkpoint markers in short term PD-1 (n=5) or PD-1 and TIM- 3 antibody treated mice (concurrent comb) (n=5). Data are shown as mean ± standard deviation. 8

9 9
 and two effusion samples from patients whose tumor developed resistance to anti-pd-1")

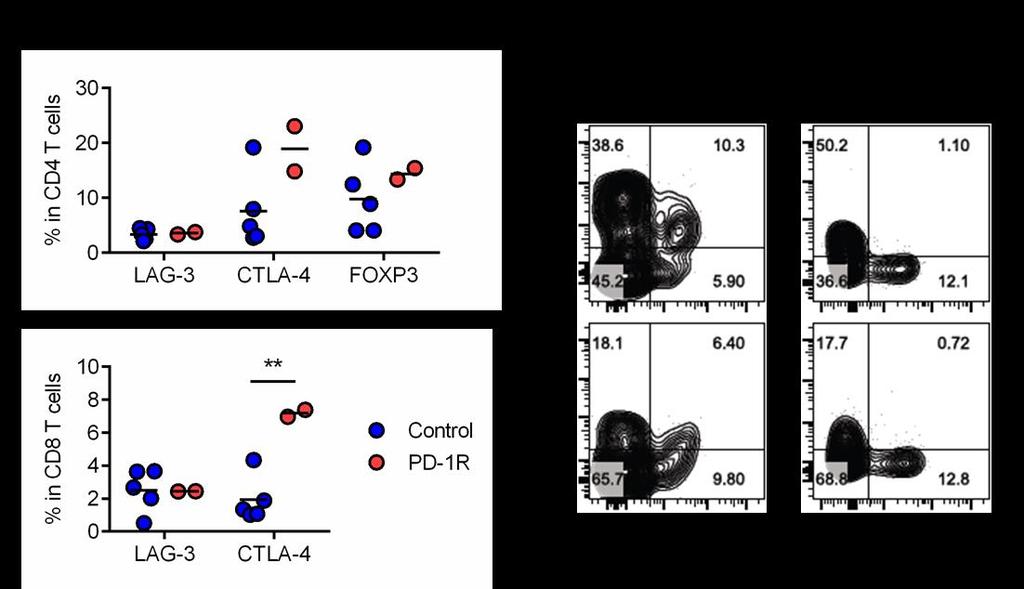
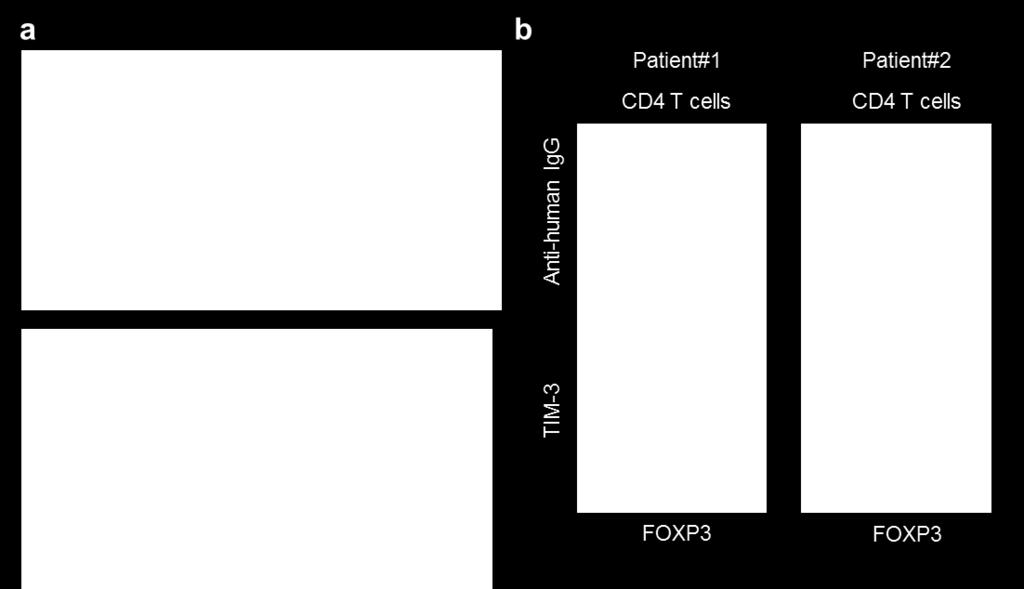
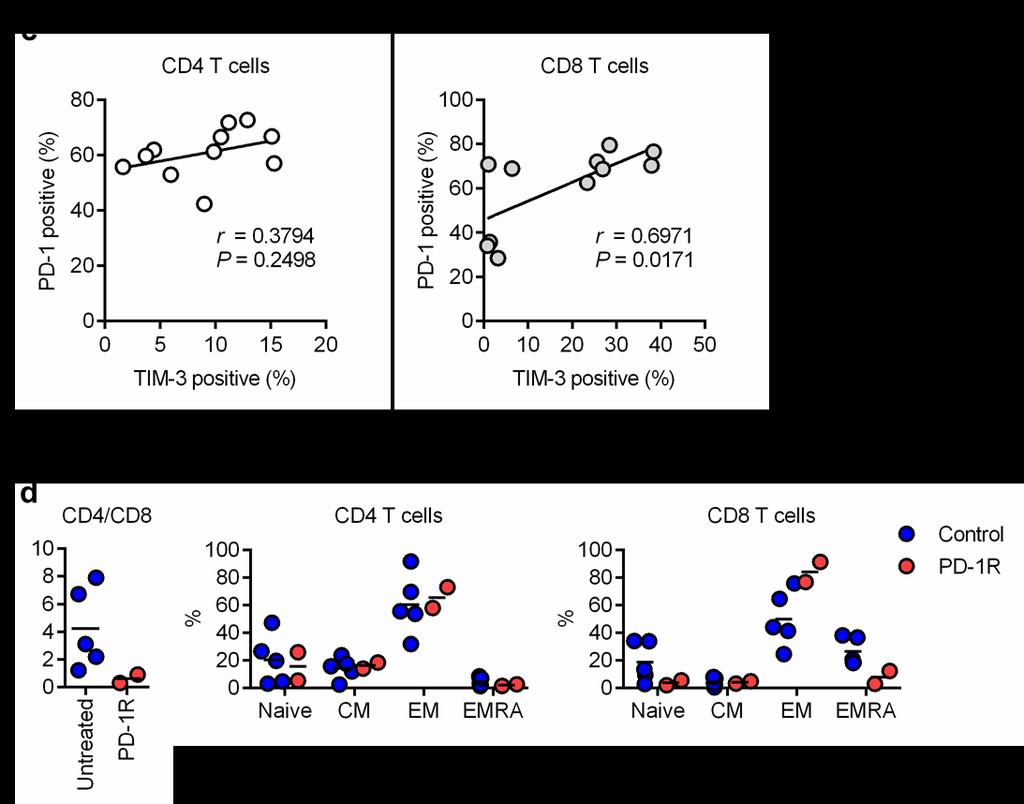
10 Supplementary Figure 7. Characteristics of immune cells from patient samples (a) Inhibitory T cell markers in CD4 and CD8 T cells from human effusion samples. Expression of LAG-3, CTLA-4, and FOXP3 was compared between control effusions from untreated patients (n=5) and two effusion samples from patients whose tumor developed resistance to anti-pd-1 treatment (PD-1R). **P=0.0041, Student s t test. (b) Therapeutic anti- PD-1 antibody binding and TIM-3 expression in regulatory T cells. In the effusion sample from Patient #1, 63.5% or 39.5% of FOXP3 + CD4 T cells show therapeutic antibody binding and TIM-3 expression. In the effusion sample from Patient #2, less than 10% of FOXP3 + CD4 T cells show anti-pd-1 antibody binding and TIM-3 positivity. (c) Correlation between PD-1 and TIM-3 expression in CD4 and CD8 T cells from surgically resected tumor samples. The expression of PD-1 and TIM-3 was evaluated in CD4 and CD8 T cells from surgically resected non-small cell lung tumor tissues (n=11). A positive correlation between PD-1 and TIM-3 was detected in CD8 T cells but not CD4 T cells. (d) Characteristics of T cells in 10
11 patient effusion samples. Left: CD4/CD8 ratio in anti-pd-1 resistant samples (PD-1R) compared to control. Mean of CD4/CD8 ratio in effusions: Control (Con) vs anti-pd-1 resistant (PD-1R) =4.231 vs (P=0.1594). Right: ratio of each T cell subset in CD4 and CD8 T cells in effusions from two PD-1R patients compared to control (n=5). T cells were classified into naive: CD45RA + CCR7 +, central memory (CM): CCR7 + CD45RA -, effector memory (EM): CCR7 - CD45RA -, effector memory re-expressing RA (EMRA): CCR7 - CD45RA +. Mean of EM CD8 T cells: Control vs PD-1R = 50.12% vs 84.10%. (e,f) Characteristics of myeloid cells in patient effusion samples. No significant change was detected in major myeloid cell populations; granulocytes (CD66b + ) and non-granulocytic myeloid cells (CD33 + CD66b - ) between untreated vs PD-1R samples (e). PD-L1 expression was evaluated in monocytes (CD33 + CD66b - CD14 + cells). Mean of fold increase in PD-L1 MFI (effusion: untreated vs PD-1R=8.849 vs (f). (g) IL-6, PGRN and Galectin-9 concentrations in supernatants from effusion samples (Saline vs PD-1R; **P= and Control vs PD-1R: **P=0.0052, one-way ANOVA with Tukey s multiple comparison test). Each data point represents a different sample and line represents the mean. 11

12 Supplementary Figure 8. Gating strategy for Epcam and T cell sorting by FACS CD45 + CD11b - CD19 - TER119 - DX5 - CD11c - LY-6G - TCRbeta + cells were sorted as T cells and CD45 - Epcam + cells were sorted as tumor cells and used for RNA extraction and sequencing. 12
13 Supplementary Table 1: Antibody list for human Antigen Clone Antigen Clone CD45 2D1 CCR CD3 UCHT1 CD45RA HI100 CD4 RPA-T4 PD-1 EH12.1 CD8 RPA-T8 TIM-3 F38-2E2 CD66b G10F5 LAG3 FAB2319* CD33 WM53 PD-L1 29E.2A3 CD14 M5E2 FOXP3 234A/E7 CD45RO UCHL1 CTLA-4 14D3 *Catalog number (R and D systems) Supplementary Table 2: Antibody list for mouse Antigen Clone Antigen Clone CD45 30-F11 CD44 IM7 CD3ε 145-2C11 PD-1 29F.1A12 CD4 RM4-5 TIM-3 RMT3-23 CD8a LAG-3 C9B7W CD19 6D5 BTLA 8F4 DX5 DX5 VISTA MH5A NKp46 29A1.4 PD-L1 10F.9G2 CD11c N418 CEACAM1 CC1 CD11b M1/70 FOXP3 FJK-16s Ly6G 1A8 CTLA-4 UC10-4B9 CD103 2E7 IFNγ XMG1.2 TCRβ H Ki-67 16A8 TER-119 TER-119 Galectin-9 RG
14 Supplementary Methods: Mouse lung tumor and immune cell characterization Mice were sacrificed, and blood was collected through cardiac puncture; lungs were then perfused with cold PBS containing 5 mm EDTA from the right ventricle after collecting BAL fluid. Whole normal or tumor bearing lung was resected and one left lobe and five right lobes were used for histological and flow cytometry analysis. Lung lobes were shredded into small pieces and incubated in collagenase containing buffer: 100 units/ml of collagenase type IV (Invitrogen), 10 μg/ml of DNase I (Roche), and 10% FBS in RPMI1640 medium for 45 min. After incubation, cells were treated with RBC lysis buffer and passed through cell strainer to remove debris. The cell pellet was dissolved by 2% FCS in HBSS, stained with antibodies at 1:50 dilution and used for flow cytometry analysis. 14
Synergy of radiotherapy and PD-1 blockade in Kras-mutant lung cancer
 Supplementary Information Synergy of radiotherapy and PD-1 blockade in Kras-mutant lung cancer Grit S. Herter-Sprie, Shohei Koyama, Houari Korideck, Josephine Hai, Jiehui Deng, Yvonne Y. Li, Kevin A. Buczkowski,
Blocking antibodies and peptides. Rat anti-mouse PD-1 (29F.1A12, rat IgG2a, k), PD-
, PD-") Supplementary Methods Blocking antibodies and peptides. Rat anti-mouse PD-1 (29F.1A12, rat IgG2a, k), PD- L1 (10F.9G2, rat IgG2b, k), and PD-L2 (3.2, mouse IgG1) have been described (24). Anti-CTLA-4 (clone
Supplementary Methods Blocking antibodies and peptides. Rat anti-mouse PD-1 (29F.1A12, rat IgG2a, k), PD- L1 (10F.9G2, rat IgG2b, k), and PD-L2 (3.2, mouse IgG1) have been described (24). Anti-CTLA-4 (clone
SUPPLEMENTARY INFORMATION
 doi:10.1038/nature10134 Supplementary Figure 1. Anti-inflammatory activity of sfc. a, Autoantibody immune complexes crosslink activating Fc receptors, promoting activation of macrophages, and WWW.NATURE.COM/NATURE
Supplementary Table e-1. Flow cytometry reagents and staining combinations
 Supplementary data Supplementary Table e-1. Flow cytometry reagents and staining combinations Reagents Antibody Fluorochrome Clone Source conjugation CD3 FITC UCHT1 BD Biosciences CD3 PerCP-Cy5.5 SK7 Biolegend
SUPPLEMENTARY INFORMATION. CXCR4 inhibitors could benefit to HER2 but not to Triple-Negative. breast cancer patients
 SUPPLEMENTARY INFORMATION CXCR4 inhibitors could benefit to HER2 but not to Triple-Negative breast cancer patients Lefort S. 1,2, Thuleau A. 3, Kieffer Y. 1,2, Sirven P. 1,2, Bieche I. 4, Marangoni E.
Fluorochrome Panel 1 Panel 2 Panel 3 Panel 4 Panel 5 CTLA-4 CTLA-4 CD15 CD3 FITC. Bio) PD-1 (MIH4, BD) ICOS (C398.4A, Biolegend) PD-L1 (MIH1, BD)
 PD-1 (MIH4, BD) ICOS (C398.4A, Biolegend) PD-L1 (MIH1, BD)") Additional file : Table S. Antibodies used for panel stain to identify peripheral immune cell subsets. Panel : PD- signaling; Panel : CD + T cells, CD + T cells, B cells; Panel : Tregs; Panel :, -T, cdc,
Additional file : Table S. Antibodies used for panel stain to identify peripheral immune cell subsets. Panel : PD- signaling; Panel : CD + T cells, CD + T cells, B cells; Panel : Tregs; Panel :, -T, cdc,
Supplementary Materials for
 www.sciencetranslationalmedicine.org/cgi/content/full/8/352/352ra110/dc1 Supplementary Materials for Spatially selective depletion of tumor-associated regulatory T cells with near-infrared photoimmunotherapy
Immunology. Antibodies for immunology research
 Immunology Antibodies for immunology research antibodies for immunology research BP0169 BP0003-1 BP0004-1 BP0061 CD4 + T cells Control LOB12.3 Relative Cell Number CD4 (55 kda) CD8α (35 kda) CD8α (35 kda)
Supplementary Figures
 Inhibition of Pulmonary Anti Bacterial Defense by IFN γ During Recovery from Influenza Infection By Keer Sun and Dennis W. Metzger Supplementary Figures d a Ly6G Percentage survival f 1 75 5 1 25 1 5 1
Low Avidity CMV + T Cells accumulate in Old Humans
 Supplementary Figure Legends Supplementary Figure 1. CD45RA expressing CMVpp65-specific T cell populations accumulate within HLA-A*0201 and HLA-B*0701 individuals Pooled data showing the size of the NLV/HLA-A*0201-specific
Supplemental Table I.
 Supplemental Table I Male / Mean ± SEM n Mean ± SEM n Body weight, g 29.2±0.4 17 29.7±0.5 17 Total cholesterol, mg/dl 534.0±30.8 17 561.6±26.1 17 HDL-cholesterol, mg/dl 9.6±0.8 17 10.1±0.7 17 Triglycerides,
Supplementary Figure 1. Efficiency of Mll4 deletion and its effect on T cell populations in the periphery. Nature Immunology: doi: /ni.
 Supplementary Figure 1 Efficiency of Mll4 deletion and its effect on T cell populations in the periphery. Expression of Mll4 floxed alleles (16-19) in naive CD4 + T cells isolated from lymph nodes and
and follicular helper T cells is Egr2-dependent. (a) Diagrammatic representation of the
 Diagrammatic representation of the") Supplementary Figure 1. LAG3 + Treg-mediated regulation of germinal center B cells and follicular helper T cells is Egr2-dependent. (a) Diagrammatic representation of the experimental protocol for the
Supplementary Figure 1. LAG3 + Treg-mediated regulation of germinal center B cells and follicular helper T cells is Egr2-dependent. (a) Diagrammatic representation of the experimental protocol for the
SUPPLEMENTARY FIGURES
 SUPPLEMENTARY FIGURES Supplementary Figure 1: Chemokine receptor expression profiles of CCR6 + and CCR6 - CD4 + IL-17A +/ex and Treg cells. Quantitative PCR analysis of chemokine receptor transcript abundance
Nature Immunology: doi: /ni Supplementary Figure 1. Cytokine pattern in skin in response to urushiol.
 Supplementary Figure 1 Cytokine pattern in skin in response to urushiol. Wild-type (WT) and CD1a-tg mice (n = 3 per group) were sensitized and challenged with urushiol (uru) or vehicle (veh). Quantitative
Supplementary Figure 1: TSLP receptor skin expression in dcssc. A: Healthy control (HC) skin with TSLP receptor expression in brown (10x
 skin with TSLP receptor expression in brown (10x") Supplementary Figure 1: TSLP receptor skin expression in dcssc. A: Healthy control (HC) skin with TSLP receptor expression in brown (10x magnification). B: Second HC skin stained for TSLP receptor in brown
Supplementary Figure 1: TSLP receptor skin expression in dcssc. A: Healthy control (HC) skin with TSLP receptor expression in brown (10x magnification). B: Second HC skin stained for TSLP receptor in brown
Supplementary Figure 1. mrna expression of chitinase and chitinase-like protein in splenic immune cells. Each splenic immune cell population was
 Supplementary Figure 1. mrna expression of chitinase and chitinase-like protein in splenic immune cells. Each splenic immune cell population was sorted by FACS. Surface markers for sorting were CD11c +
Supplemental Information. Checkpoint Blockade Immunotherapy. Induces Dynamic Changes. in PD-1 CD8 + Tumor-Infiltrating T Cells
 Immunity, Volume 50 Supplemental Information Checkpoint Blockade Immunotherapy Induces Dynamic Changes in PD-1 CD8 + Tumor-Infiltrating T Cells Sema Kurtulus, Asaf Madi, Giulia Escobar, Max Klapholz, Jackson
SUPPORTING INFORMATIONS
 SUPPORTING INFORMATIONS Mice MT/ret RetCD3ε KO α-cd25 treated MT/ret Age 1 month 3 mnths 6 months 1 month 3 months 6 months 1 month 3 months 6 months 2/87 Survival 87/87 incidence of 17/87 1 ary tumor
Detailed step-by-step operating procedures for NK cell and CTL degranulation assays
 Supplemental methods Detailed step-by-step operating procedures for NK cell and CTL degranulation assays Materials PBMC isolated from patients, relatives and healthy donors as control K562 cells (ATCC,
% of live splenocytes. STAT5 deletion. (open shapes) % ROSA + % floxed
 % ROSA + % floxed") Supp. Figure 1. a 14 1 1 8 6 spleen cells (x1 6 ) 16 % of live splenocytes 5 4 3 1 % of live splenocytes 8 6 4 b 1 1 c % of CD11c + splenocytes (closed shapes) 8 6 4 8 6 4 % ROSA + (open shapes) % floxed
Supp. Figure 1. a 14 1 1 8 6 spleen cells (x1 6 ) 16 % of live splenocytes 5 4 3 1 % of live splenocytes 8 6 4 b 1 1 c % of CD11c + splenocytes (closed shapes) 8 6 4 8 6 4 % ROSA + (open shapes) % floxed
Supplemental Information. T Cells Enhance Autoimmunity by Restraining Regulatory T Cell Responses via an Interleukin-23-Dependent Mechanism
 Immunity, Volume 33 Supplemental Information T Cells Enhance Autoimmunity by Restraining Regulatory T Cell Responses via an Interleukin-23-Dependent Mechanism Franziska Petermann, Veit Rothhammer, Malte
Nature Immunology: doi: /ni Supplementary Figure 1. Examples of staining for each antibody used for the mass cytometry analysis.
 Supplementary Figure 1 Examples of staining for each antibody used for the mass cytometry analysis. To illustrate the functionality of each antibody probe, representative plots illustrating the expected
SUPPLEMENTARY INFORMATION
 doi:1.138/nature1554 a TNF-α + in CD4 + cells [%] 1 GF SPF 6 b IL-1 + in CD4 + cells [%] 5 4 3 2 1 Supplementary Figure 1. Effect of microbiota on cytokine profiles of T cells in GALT. Frequencies of TNF-α
SUPPLEMENTARY METHODS
 SUPPLEMENTARY METHODS Histological analysis. Colonic tissues were collected from 5 parts of the middle colon on day 7 after the start of DSS treatment, and then were cut into segments, fixed with 4% paraformaldehyde,
supplemental Figure 1
 supplemental Figure 1 A T cell T1 anti-ny-eso-117-16/hla-a*:1 CDζ CH/CH scfv B T cell T1 anti-ny-eso-117-16/hla-a*:1 CDζ CH/CH scfv C T cell BW1/6 anti-cea CDζ CH/CH scfv supplemental Figure 1.79.9.87
D CD8 T cell number (x10 6 )
") IFNγ Supplemental Figure 1. CD T cell number (x1 6 ) 18 15 1 9 6 3 CD CD T cells CD6L C CD5 CD T cells CD6L D CD8 T cell number (x1 6 ) 1 8 6 E CD CD8 T cells CD6L F Log(1)CFU/g Feces 1 8 6 p
IFNγ Supplemental Figure 1. CD T cell number (x1 6 ) 18 15 1 9 6 3 CD CD T cells CD6L C CD5 CD T cells CD6L D CD8 T cell number (x1 6 ) 1 8 6 E CD CD8 T cells CD6L F Log(1)CFU/g Feces 1 8 6 p
Suppl Video: Tumor cells (green) and monocytes (white) are seeded on a confluent endothelial
 and monocytes (white) are seeded on a confluent endothelial") Supplementary Information Häuselmann et al. Monocyte induction of E-selectin-mediated endothelial activation releases VE-cadherin junctions to promote tumor cell extravasation in the metastasis cascade
Supplementary Information Häuselmann et al. Monocyte induction of E-selectin-mediated endothelial activation releases VE-cadherin junctions to promote tumor cell extravasation in the metastasis cascade
Supplemental Information. IRF-5 Promotes Cell Death in CD4 T Cells. during Chronic Infection
 Cell Reports, Volume 24 Supplemental Information IRF-5 Promotes Cell Death in T Cells during Chronic Infection Aymeric Fabié, Linh Thuy Mai, Xavier Dagenais-Lussier, Akil Hammami, Julien van Grevenynghe,
Adaptive resistance to therapeutic PD-1 blockade is associated with upregulation of alternative immune checkpoints
 Adaptive resistance to therapeutic PD- blockade is associated with upregulation of alternative immune checkpoints The Harvard community has made this article openly available. Please share how this access
for six pairs of mice. (b) Representative FACS analysis of absolute number of T cells (CD4 + and
 Representative FACS analysis of absolute number of T cells (CD4 + and") SUPPLEMENTARY DATA Supplementary Figure 1: Peripheral lymphoid organs of SMAR1 -/- mice have an effector memory phenotype. (a) Lymphocytes collected from MLNs and Peyer s patches (PPs) of WT and SMAR1
SUPPLEMENTARY DATA Supplementary Figure 1: Peripheral lymphoid organs of SMAR1 -/- mice have an effector memory phenotype. (a) Lymphocytes collected from MLNs and Peyer s patches (PPs) of WT and SMAR1
SUPPLEMENTARY FIGURE 1
 SUPPLEMENTARY FIGURE 1 A LN Cell count (1 ) 1 3 1 CD+ 1 1 CDL lo CD hi 1 CD+FoxP3+ 1 1 1 7 3 3 3 % of cells 9 7 7 % of cells CD+ 3 1 % of cells CDL lo CD hi 1 1 % of CD+ cells CD+FoxP3+ 3 1 % of CD+ T
Appendix Figure S1 A B C D E F G H
 ppendix Figure S1 C D E F G H ppendix Figure S1. RT and chemotherapy alter PD-L1 expression in PDC cells. Flow cytometric analysis of PD-L1 expression in () KPC and () Pan02 cells following treatment with
Supplementary Figure 1. Flow cytometry panels used for BD Canto (A) and BD Fortessa (B).
 and BD Fortessa (B).") Intra Immune nalysis Surface Supplementary Figure 1. Flow cytometry panels used for D Canto () and D Fortessa (). Name Fluorochrome ID F488 PE PerCp-Cy5.5 PC Paclue PE-Cy7 PC-H7 Lympho* 1 CD56 CD8 CD16
Intra Immune nalysis Surface Supplementary Figure 1. Flow cytometry panels used for D Canto () and D Fortessa (). Name Fluorochrome ID F488 PE PerCp-Cy5.5 PC Paclue PE-Cy7 PC-H7 Lympho* 1 CD56 CD8 CD16
a surface permeabilized
 a surface permeabilized RAW 64.7 P388D1 J774 b CD11b + Ly-6G - Blood Monocytes WT Supplementary Figure 1. Cell surface expression on macrophages and DCs. (a) RAW64.7, P388D1, and J774 cells were subjected
Supplementary Figure 1 IL-27 IL
 Tim-3 Supplementary Figure 1 Tc0 49.5 0.6 Tc1 63.5 0.84 Un 49.8 0.16 35.5 0.16 10 4 61.2 5.53 10 3 64.5 5.66 10 2 10 1 10 0 31 2.22 10 0 10 1 10 2 10 3 10 4 IL-10 28.2 1.69 IL-27 Supplementary Figure 1.
Emerging Concepts of Cancer Immunotherapy
 Emerging Concepts of Cancer Immunotherapy Jeffrey Schlom, Ph.D. Laboratory of Tumor Immunology and Biology (LTIB) Center for Cancer Research National Cancer Institute, NIH Immune Cell Infiltrate in Primary
Commercially available HLA Class II tetramers (Beckman Coulter) conjugated to
 conjugated to") Class II tetramer staining Commercially available HLA Class II tetramers (Beckman Coulter) conjugated to PE were combined with dominant HIV epitopes (DRB1*0101-DRFYKTLRAEQASQEV, DRB1*0301- PEKEVLVWKFDSRLAFHH,
Class II tetramer staining Commercially available HLA Class II tetramers (Beckman Coulter) conjugated to PE were combined with dominant HIV epitopes (DRB1*0101-DRFYKTLRAEQASQEV, DRB1*0301- PEKEVLVWKFDSRLAFHH,
W/T Itgam -/- F4/80 CD115. F4/80 hi CD115 + F4/80 + CD115 +
 F4/8 % in the peritoneal lavage 6 4 2 p=.15 n.s p=.76 CD115 F4/8 hi CD115 + F4/8 + CD115 + F4/8 hi CD115 + F4/8 + CD115 + MHCII MHCII Supplementary Figure S1. CD11b deficiency affects the cellular responses
Supplementary Figure 1. Ex vivo IFNγ production by Tregs. Nature Medicine doi: /nm % CD127. Empty SSC 98.79% CD25 CD45RA.
 SSC CD25 1.8% CD127 Empty 98.79% FSC CD45RA CD45RA Foxp3 %IFNγ + cells 4 3 2 1 + IL-12 P =.3 IFNγ p=.9 %IL-4+ cells 3 2 1 IL-4 P =.4 c %IL-1 + cells IFNγ 4 3 2 1 Control Foxp3 IL-1 P =.41.64 4.76 MS 2.96
Supplementary Figure Legends. group) and analyzed for Siglec-G expression utilizing a monoclonal antibody to Siglec-G (clone SH2.1).
 and analyzed for Siglec-G expression utilizing a monoclonal antibody to Siglec-G (clone SH2.1).") Supplementary Figure Legends Supplemental Figure : Naïve T cells express Siglec-G. Splenocytes were isolated from WT B or Siglec-G -/- animals that have not been transplanted (n= per group) and analyzed
Supplementary Figure Legends Supplemental Figure : Naïve T cells express Siglec-G. Splenocytes were isolated from WT B or Siglec-G -/- animals that have not been transplanted (n= per group) and analyzed
Combined Rho-kinase inhibition and immunogenic cell death triggers and propagates immunity against cancer
 Supplementary Information Combined Rho-kinase inhibition and immunogenic cell death triggers and propagates immunity against cancer Gi-Hoon Nam, Eun-Jung Lee, Yoon Kyoung Kim, Yeonsun Hong, Yoonjeong Choi,
Primary Adult Naïve CD4+ CD45RA+ Cells. Prepared by: David Randolph at University of Alabama, Birmingham
 Primary Adult Naïve CD4+ CD45RA+ Cells Prepared by: David Randolph (drdrdr@uab.edu) at University of Alabama, Birmingham Goal: To obtain large numbers of highly pure primary CD4+ CD45RO- CD25- cells from
Supplementary Figure 1
 Supplementary Figure 1 Identification of IFN-γ-producing CD8 + and CD4 + T cells with naive phenotype by alternative gating and sample-processing strategies. a. Contour 5% probability plots show definition
Supplementary Figures
 Supplementary Figures Supplementary Fig. 1. Surface thiol groups and reduction of activated T cells. (a) Activated CD8 + T-cells have high expression levels of free thiol groups on cell surface proteins.
Supplemental Figure 1. Signature gene expression in in vitro differentiated Th0, Th1, Th2, Th17 and Treg cells. (A) Naïve CD4 + T cells were cultured
 Naïve CD4 + T cells were cultured") Supplemental Figure 1. Signature gene expression in in vitro differentiated Th0, Th1, Th2, Th17 and Treg cells. (A) Naïve CD4 + T cells were cultured under Th0, Th1, Th2, Th17, and Treg conditions. mrna
Supplemental Figure 1. Signature gene expression in in vitro differentiated Th0, Th1, Th2, Th17 and Treg cells. (A) Naïve CD4 + T cells were cultured under Th0, Th1, Th2, Th17, and Treg conditions. mrna
Supplemental Table 1. Primer sequences for transcript analysis
 Supplemental Table 1. Primer sequences for transcript analysis Primer Sequence (5 3 ) Primer Sequence (5 3 ) Mmp2 Forward CCCGTGTGGCCCTC Mmp15 Forward CGGGGCTGGCT Reverse GCTCTCCCGGTTTC Reverse CCTGGTGTGCCTGCTC
Akt and mtor pathways differentially regulate the development of natural and inducible. T H 17 cells
 Akt and mtor pathways differentially regulate the development of natural and inducible T H 17 cells Jiyeon S Kim, Tammarah Sklarz, Lauren Banks, Mercy Gohil, Adam T Waickman, Nicolas Skuli, Bryan L Krock,
Supplemental Materials for. Effects of sphingosine-1-phosphate receptor 1 phosphorylation in response to. FTY720 during neuroinflammation
 Supplemental Materials for Effects of sphingosine-1-phosphate receptor 1 phosphorylation in response to FTY7 during neuroinflammation This file includes: Supplemental Table 1. EAE clinical parameters of
pplementary Figur Supplementary Figure 1. a.
 pplementary Figur Supplementary Figure 1. a. Quantification by RT-qPCR of YFV-17D and YFV-17D pol- (+) RNA in the supernatant of cultured Huh7.5 cells following viral RNA electroporation of respective
SUPPLEMENT Supplementary Figure 1: (A) (B)
 (B)") SUPPLEMENT Supplementary Figure 1: CD4 + naïve effector T cells (CD4 effector) were labeled with CFSE, stimulated with α-cd2/cd3/cd28 coated beads (at 2 beads/cell) and cultured alone or cocultured with
SUPPLEMENT Supplementary Figure 1: CD4 + naïve effector T cells (CD4 effector) were labeled with CFSE, stimulated with α-cd2/cd3/cd28 coated beads (at 2 beads/cell) and cultured alone or cocultured with
Supplementary Figure 1. Characterization of basophils after reconstitution of SCID mice
 Supplementary figure legends Supplementary Figure 1. Characterization of after reconstitution of SCID mice with CD4 + CD62L + T cells. (A-C) SCID mice (n = 6 / group) were reconstituted with 2 x 1 6 CD4
Supplemental Materials
 Supplemental Materials Programmed death one homolog maintains the pool size of regulatory T cells by promoting their differentiation and stability Qi Wang 1, Jianwei He 1, Dallas B. Flies 2, Liqun Luo
COMPONENT NAME COMPONENT # QUANTITY STORAGE SHELF LIFE FORMAT. Store at 2-8 C. Do not freeze. Store at 2-8 C. Do not freeze.
 This document is available at www.stemcell.com/pis Catalog #18765 EasySep Mouse CD4+CD62L+ T Cell Isolation Kit For processing 1x 10^9 cells Description Isolate highly purified naïve CD4+ T cells (CD4+CD62L+)
Supplementary Figure 1 Chemokine and chemokine receptor expression during muscle regeneration (a) Analysis of CR3CR1 mrna expression by real time-pcr
 Analysis of CR3CR1 mrna expression by real time-pcr") Supplementary Figure 1 Chemokine and chemokine receptor expression during muscle regeneration (a) Analysis of CR3CR1 mrna expression by real time-pcr at day 0, 1, 4, 10 and 21 post- muscle injury. (b)
Supplementary Figure 1 Chemokine and chemokine receptor expression during muscle regeneration (a) Analysis of CR3CR1 mrna expression by real time-pcr at day 0, 1, 4, 10 and 21 post- muscle injury. (b)
COMPONENT NAME COMPONENT # QUANTITY STORAGE SHELF LIFE FORMAT. Store at 2-8 C. Do not freeze. Store at 2-8 C. Do not freeze.
 This document is available at www.stemcell.com/pis Catalog #18765 EasySep Mouse CD4+CD62L+ T Cell Isolation Kit For processing 1x 10^9 cells Description Isolate highly purified naïve CD4+ T cells (CD4+CD62L+)
Bezzi et al., Supplementary Figure 1 *** Nature Medicine: doi: /nm Pten pc-/- ;Zbtb7a pc-/- Pten pc-/- ;Pml pc-/- Pten pc-/- ;Trp53 pc-/-
 Gr-1 Gr-1 Gr-1 Bezzi et al., Supplementary Figure 1 a Gr1-CD11b 3 months Spleen T cells 3 months Spleen B cells 3 months Spleen Macrophages 3 months Spleen 15 4 8 6 c CD11b+/Gr1+ cells [%] 1 5 b T cells
Reviewers' comments: Reviewer #1 (Remarks to the Author):
:") Reviewers' comments: Reviewer #1 (Remarks to the Author): In the manuscript Rational Combination of CXCL11-Expressing Oncolytic Virus and PD-L1 Blockade Works Synergistically to Enhance Therapeutic Efficacy
Reviewers' comments: Reviewer #1 (Remarks to the Author): In the manuscript Rational Combination of CXCL11-Expressing Oncolytic Virus and PD-L1 Blockade Works Synergistically to Enhance Therapeutic Efficacy
Supplementary Information. Tissue-wide immunity against Leishmania. through collective production of nitric oxide
 Supplementary Information Tissue-wide immunity against Leishmania through collective production of nitric oxide Romain Olekhnovitch, Bernhard Ryffel, Andreas J. Müller and Philippe Bousso Supplementary
Nature Immunology: doi: /ni.3836
 Supplementary Figure 1 Recombinant LIGHT-VTP induces pericyte contractility and endothelial cell activation. (a) Western blot showing purification steps for full length murine LIGHT-VTP (CGKRK) protein:
Supplementary information. The proton-sensing G protein-coupled receptor T-cell death-associated gene 8
 1 Supplementary information 2 3 The proton-sensing G protein-coupled receptor T-cell death-associated gene 8 4 (TDAG8) shows cardioprotective effects against myocardial infarction 5 Akiomi Nagasaka 1+,
VEGFR2-Mediated Vascular Dilation as a Mechanism of VEGF-Induced Anemia and Bone Marrow Cell Mobilization
 Cell Reports, Volume 9 Supplemental Information VEGFR2-Mediated Vascular Dilation as a Mechanism of VEGF-Induced Anemia and Bone Marrow Cell Mobilization Sharon Lim, Yin Zhang, Danfang Zhang, Fang Chen,
Supplementary Figure 1. Efficient DC depletion in CD11c.DOG transgenic mice
 Supplementary Figure 1. Efficient DC depletion in CD11c.DOG transgenic mice (a) CD11c.DOG transgenic mice (tg) were treated with 8 ng/g body weight (b.w.) diphtheria toxin (DT) i.p. on day -1 and every
CD14 + S100A9 + Monocytic Myeloid-Derived Suppressor Cells and Their Clinical Relevance in Non-Small Cell Lung Cancer
 CD14 + S1A9 + Monocytic Myeloid-Derived Suppressor Cells and Their Clinical Relevance in Non-Small Cell Lung Cancer Po-Hao, Feng M.D., Kang-Yun, Lee, M.D. Ph.D., Ya-Ling Chang, Yao-Fei Chan, Lu- Wei, Kuo,Ting-Yu
Supplementary Information
 Supplementary Information Supplementary Figure 1. CD4 + T cell activation and lack of apoptosis after crosslinking with anti-cd3 + anti-cd28 + anti-cd160. (a) Flow cytometry of anti-cd160 (5D.10A11) binding
ankylosing spondylitis Department of Clinical Immunology, Xijing Hospital, The Fourth Military
 Functional defects in CD4 + CD25 high FoxP3 + regulatory cells in ankylosing spondylitis Huifang Guo 1, 2, 3, Ming Zheng 1, 2, 3, Kui Zhang 1, 3, Fengfan Yang 1, 3, Xin Zhang 1, 3, Qing Han 1, 3, Zhi-Nan
CyTOF analyses in rheumatoid arthritis. Deepak Rao, MD PhD Rheumatology, Immunology, Allergy, BWH
 CyTOF analyses in rheumatoid arthritis Deepak Rao, MD PhD Rheumatology, Immunology, Allergy, BWH Agenda: CyTOF analyses Analysis of synovial tissue Panel for analysis of synovial cells Comparison of CyTOF
Supplementary Information
 Supplementary Information Methods Lymphocyte subsets analysis was performed on samples of 7 subjects by flow cytometry on blood samples collected in ethylenediaminetetraacetic acid (EDTA)-containing tubes
CD44
 MR1-5-OP-RU CD24 CD24 CD44 MAIT cells 2.78 11.2 WT RORγt- GFP reporter 1 5 1 4 1 3 2.28 1 5 1 4 1 3 4.8 1.6 8.1 1 5 1 4 1 3 1 5 1 4 1 3 3.7 3.21 8.5 61.7 1 2 1 3 1 4 1 5 TCRβ 2 1 1 3 1 4 1 5 CD44 1 2 GFP
Supplemental Figures Supplemental Figure 1:
 Supplemental Figures Supplemental Figure 1: Representative FACS data showing Concurrent Brain cell type Acquisition using either Percoll PLUS (top row) or myelin removal beads (bottom two rows). Debris
Supplementary Information:
 Supplementary Information: Follicular regulatory T cells with Bcl6 expression suppress germinal center reactions by Yeonseok Chung, Shinya Tanaka, Fuliang Chu, Roza Nurieva, Gustavo J. Martinez, Seema
ONLINE SUPPLEMENT MATERIAL. CD70 limits atherosclerosis and promotes macrophage function.
 ONLINE SUPPLEMENT MATERIAL CD7 limits atherosclerosis and promotes macrophage function. Holger Winkels* 1,2, Svenja Meiler* 1,2, Esther Smeets* 2, Dirk Lievens 1, David Engel 3, Charlotte Spitz 1, Christina
Hua Tang, Weiping Cao, Sudhir Pai Kasturi, Rajesh Ravindran, Helder I Nakaya, Kousik
 SUPPLEMENTARY FIGURES 1-19 T H 2 response to cysteine-proteases requires dendritic cell-basophil cooperation via ROS mediated signaling Hua Tang, Weiping Cao, Sudhir Pai Kasturi, Rajesh Ravindran, Helder
Supplementary Table 1
 Supplementary Table 1 Flow Cytometry Antibodies Antibody Fluorochrome Clone Vendor CD45 PE-cyanine 7 30-F11 D ioscience CD3 Pacific lue 17A2 iolegend (San Diego, CA) CD11b APC M1/70 iolegend (San Diego,
Eosinophils are required. for the maintenance of plasma cells in the bone marrow
 Eosinophils are required for the maintenance of plasma cells in the bone marrow Van Trung Chu, Anja Fröhlich, Gudrun Steinhauser, Tobias Scheel, Toralf Roch, Simon Fillatreau, James J. Lee, Max Löhning
Supplementary Figures
 Supplementary Figures Supplementary Fig. 1. Galectin-3 is present within tumors. (A) mrna expression levels of Lgals3 (galectin-3) and Lgals8 (galectin-8) in the four classes of cell lines as determined
Novel Reporter Gene Bioassays for Immunotherapy Drug Research and Development Jey Cheng, PhD Sr Research Scientist Promega Corporation
 Novel Reporter Gene Bioassays for Immunotherapy Drug Research and Development Jey Cheng, PhD Sr Research Scientist 215 Outline Immune Checkpoint and Combination Therapies Reporter Gene Bioassays: Design,
Supplementary Figure 1.
 Supplementary Figure 1. Female Pro-ins2 -/- mice at 5-6 weeks of age were either inoculated i.p. with a single dose of CVB4 (1x10 5 PFU/mouse) or PBS and treated with αgalcer or control vehicle. On day
Supplementary Table 1 Clinicopathological characteristics of 35 patients with CRCs
 Supplementary Table Clinicopathological characteristics of 35 patients with CRCs Characteristics Type-A CRC Type-B CRC P value Sex Male / Female 9 / / 8.5 Age (years) Median (range) 6. (9 86) 6.5 (9 76).95
BD Flow Cytometry Reagents Multicolor Panels Designed for Optimal Resolution with the BD LSRFortessa X-20 Cell Analyzer
 Multicolor Panels Designed for Optimal Resolution with the BD LSRFortessa X-2 Cell Analyzer Proper multicolor panel design takes into account fluorochrome brightness, antigen density, co-expression, and
NKTR-255: Accessing The Immunotherapeutic Potential Of IL-15 for NK Cell Therapies
 NKTR-255: Accessing The Immunotherapeutic Potential Of IL-15 for NK Cell Therapies Saul Kivimäe Senior Scientist, Research Biology Nektar Therapeutics NK Cell-Based Cancer Immunotherapy, September 26-27,
Tim-3 as a target for tumor immunotherapy
 Tim-3 as a target for tumor immunotherapy Ana Carrizosa Anderson Brigham and Women s Hospital Harvard Medical School Disclosures A portion of the work has been performed as part of a sponsored research
Supplementary Figure 1. Antibiotic partially rescues mice from sepsis. (ab) BALB/c mice under CLP were treated with antibiotic or PBS.
 BALB/c mice under CLP were treated with antibiotic or PBS.") 1 Supplementary Figure 1. Antibiotic partially rescues mice from sepsis. (ab) BALB/c mice under CLP were treated with antibiotic or PBS. (a) Survival curves. WT Sham (n=5), WT CLP or WT CLP antibiotic
1 Supplementary Figure 1. Antibiotic partially rescues mice from sepsis. (ab) BALB/c mice under CLP were treated with antibiotic or PBS. (a) Survival curves. WT Sham (n=5), WT CLP or WT CLP antibiotic
Supplementary Figure S1. Flow cytometric analysis of the expression of Thy1 in NH cells. Flow cytometric analysis of the expression of T1/ST2 and
 Supplementary Figure S1. Flow cytometric analysis of the expression of Thy1 in NH cells. Flow cytometric analysis of the expression of T1/ST2 and Thy1 in NH cells derived from the lungs of naïve mice.
x Lymphocyte count /µl CD8+ count/µl 800 Calculated
 % Lymphocyte in CBC A. 50 40 30 20 10 Lymphocyte count /µl B. x10 3 2.5 1.5 C. 50 D. 1000 % CD3+CD8+ Cells 40 30 20 Calculated CD8+ count/µl 800 600 400 200 10 0 #61 #63 #64 #65 #68 #71 #72 #75 Figure
NMED-A65251A. Supplementary Figures.
 NMED-A65251A Supplementary Figures. Sup. Fig. 1. ILC3 cells are the main source of in obese mice a. We gated on T cells (upper panels) or T cells (lower panels), and examined production. b. CD45 + - IL-13
10.00 PBS OVA OVA+isotype antibody 8.00 OVA+anti-HMGB1. PBS Methatroline (mg/ml)
") RESEARCH ARTICLE Penh (100% of PBS) 1 PBS 8.00 +anti-hmgb1 6.00 4.00 p=0.054 Cellular & Molecular Immunology advance online publication, PBS 3.12 6.25 Methatroline (mg/ml) Neutrophil isolation and culture
RESEARCH ARTICLE Penh (100% of PBS) 1 PBS 8.00 +anti-hmgb1 6.00 4.00 p=0.054 Cellular & Molecular Immunology advance online publication, PBS 3.12 6.25 Methatroline (mg/ml) Neutrophil isolation and culture
The autoimmune disease-associated PTPN22 variant promotes calpain-mediated Lyp/Pep
 SUPPLEMENTARY INFORMATION The autoimmune disease-associated PTPN22 variant promotes calpain-mediated Lyp/Pep degradation associated with lymphocyte and dendritic cell hyperresponsiveness Jinyi Zhang, Naima
BCR-ABL - LSK BCR-ABL + LKS - (%)
") Marker Clone BCR-ABL + LSK (%) BCR-ABL + LKS - (%) BCR-ABL - LSK (%) P value vs. BCR-ABL + LKS - P value vs. BCR-ABL - LSK CD2 RM2-5 12.9 ± 3.6 36.7 ± 6.5 19.3 ± 2.4 0.01 0.10 CD5 53-7.3 13.9 ± 3.2 20.8
Marker Clone BCR-ABL + LSK (%) BCR-ABL + LKS - (%) BCR-ABL - LSK (%) P value vs. BCR-ABL + LKS - P value vs. BCR-ABL - LSK CD2 RM2-5 12.9 ± 3.6 36.7 ± 6.5 19.3 ± 2.4 0.01 0.10 CD5 53-7.3 13.9 ± 3.2 20.8
PBMC from each patient were suspended in AIM V medium (Invitrogen) with 5% human
 with 5% human") Anti-CD19-CAR transduced T-cell preparation PBMC from each patient were suspended in AIM V medium (Invitrogen) with 5% human AB serum (Gemini) and 300 international units/ml IL-2 (Novartis). T cell proliferation
Anti-CD19-CAR transduced T-cell preparation PBMC from each patient were suspended in AIM V medium (Invitrogen) with 5% human AB serum (Gemini) and 300 international units/ml IL-2 (Novartis). T cell proliferation
Supplemental Information. Genomic Characterization of Murine. Monocytes Reveals C/EBPb Transcription. Factor Dependence of Ly6C Cells
 Immunity, Volume 46 Supplemental Information Genomic Characterization of Murine Monocytes Reveals C/EBPb Transcription Factor Dependence of Ly6C Cells Alexander Mildner, Jörg Schönheit, Amir Giladi, Eyal
Recommended Protocols for Phospho Protein Detection in Human Cells
 Recommended Protocols for Phospho Protein Detection in Human Cells Depending on subcellular localization of the phospho protein of interest, as well as epitope susceptibility to cell fixing and permeabilizing
Supplementary Figure 1. Enhanced detection of CTLA-4 on the surface of HIV-specific
 SUPPLEMENTARY FIGURE LEGEND Supplementary Figure 1. Enhanced detection of CTLA-4 on the surface of HIV-specific CD4 + T cells correlates with intracellular CTLA-4 levels. (a) Comparative CTLA-4 levels
well for 2 h at rt. Each dot represents an individual mouse and bar is the mean ±
 Supplementary data: Control DC Blimp-1 ko DC 8 6 4 2-2 IL-1β p=.5 medium 8 6 4 2 IL-2 Medium p=.16 8 6 4 2 IL-6 medium p=.3 5 4 3 2 1-1 medium IL-1 n.s. 25 2 15 1 5 IL-12(p7) p=.15 5 IFNγ p=.65 4 3 2 1
Nature Protocols: doi: /nprot Supplementary Figure 1
 Supplementary Figure 1 Traditional electronic gating strategy for analysing cell death based on A5-FITC and 7-AAD. a, Flow cytometry analysis showing the traditional two-stage electronic gating strategy
Supplementary Figure 1
 Supplementary Figure 1 Expression of apoptosis-related genes in tumor T reg cells. (a) Identification of FOXP3 T reg cells by FACS. CD45 + cells were gated as enriched lymphoid cell populations with low-granularity.
Supplementary Figure 1. IL-12 serum levels and frequency of subsets in FL patients. (A) IL-12
 IL-12") 1 Supplementary Data Figure legends Supplementary Figure 1. IL-12 serum levels and frequency of subsets in FL patients. (A) IL-12 serum levels measured by multiplex ELISA (Luminex) in FL patients before
1 Supplementary Data Figure legends Supplementary Figure 1. IL-12 serum levels and frequency of subsets in FL patients. (A) IL-12 serum levels measured by multiplex ELISA (Luminex) in FL patients before
Application Information Bulletin: Human NK Cells Phenotypic characterizing of human Natural Killer (NK) cell populations in peripheral blood
 cell populations in peripheral blood") Application Information Bulletin: Human NK Cells Phenotypic characterizing of human Natural Killer (NK) cell populations in peripheral blood Christopher A Fraker, Ph.D., University of Miami - Miami, Florida
Application Information Bulletin: Human NK Cells Phenotypic characterizing of human Natural Killer (NK) cell populations in peripheral blood Christopher A Fraker, Ph.D., University of Miami - Miami, Florida
MAIT cell function is modulated by PD-1 signaling in patients with active
 MAIT cell function is modulated by PD-1 signaling in patients with active tuberculosis Jing Jiang, M.D., Xinjing Wang, M.D., Hongjuan An, M.Sc., Bingfen Yang, Ph.D., Zhihong Cao, M.Sc., Yanhua Liu, Ph.D.,
Supplemental Materials. Stromal Modulation Reverses Primary Resistance to Immune Checkpoint Blockade in. Pancreatic Cancer.
 Supplemental Materials Stromal Modulation Reverses Primary Resistance to Immune Checkpoint Blockade in Pancreatic Cancer Jun Zhao 1, Zhilan Xiao 2, 3, Tingting Li 1, 4, Huiqin Chen 5, Ying Yuan 5, Alan