BCR-ABL - LSK BCR-ABL + LKS - (%)
|
|
|
- Blaise Gray
- 5 years ago
- Views:
Transcription
1 Marker Clone BCR-ABL + LSK (%) BCR-ABL + LKS - (%) BCR-ABL - LSK (%) P value vs. BCR-ABL + LKS - P value vs. BCR-ABL - LSK CD2 RM ± ± ± CD ± ± ± CD9 KMC ± ± ± CD11b M1/ ± ± ± CD13 R ± ± ± CD19 ID ± ± ± CD24 M1/ ± ± ± CD25 3C ± ± ± CD31 MEC ± ± ± CD34 RAM ± ± ± CD40 3/ ± ± ± CD41 MWReg ± ± ± CD43 S ± ± ± CD44 IM ± ± ± CD47 Miap ± ± ± CD48 HM ± ± ± CD49e 5H ± ± ± CD51 RMV ± ± ± CD52 BTG-2G 11.1 ± ± ± CD62L MEL ± ± ± CD69 H1.2F ± ± ± CD71 C ± ± ± CD90 30-H ± ± ± Fas Jo ± ± ± CD105 MJ7/ ± ± ± Mpl AMM ± ± ± M-CSFR AFS ± ± ± CD127 SB/ ± ± ± CD133 13A ± ± ± Flt3 A2F ± ± ± CD144 BV ± ± ±
2 CD150 TC15-12F ± ± ± Alcam ALC ± ± ± CXCR4 2B11/CXCR ± ± ± EPCR RCR ± ± ± Tie2 TEK ± ± ± PD-L1 10F.9G ± ± ± Flk1 Avas 12alpha ± ± ± Jam1 H ± ± ± 1.2 < N-cad D ± ± ± EpCAM G ± ± ± PCLP-1 10B ± ± ± PLVAP MECA ± ± ± Supplemental Table 1. Screen for markers specifically expressed on CML LSK cells. Bone-marrow cells from CML mice were collected, stained for various surface proteins using fluorphore- or biotin-conjugated antibodies, and then analyzed by FACS (n = 3 6). Shown are percentages of cells positive for the indicated markers in the BCR-ABL + LSK, BCR-ABL + LKS -, and BCR-ABL - LSK fractions. P values were calculated based on the twotailed Student s t-test comparing BCR-ABL + LSK vs BCR-ABL - LSK cells or BCR-ABL + LSK vs BCR-ABL + LKS - cells. Among the markers tested, only CD25 was specifically expressed on BCR-ABL + LSK cells. Supplemental Table 2. Gene sets used for GSEA. GSE3982_EOSINOPHIL_VS_BASOPHIL_UP GSE3982_EOSINOPHIL_VS_BASOPHIL_DN GSE3982_MAST_CELL_VS_BASOPHIL_UP GSE3982_MAST_CELL_VS_BASOPHIL_DN GSE3982_DC_VS_BASOPHIL_UP GSE3982_DC_VS_BASOPHIL_DN GSE3982_MAC_VS_BASOPHIL_UP GSE3982_MAC_VS_BASOPHIL_DN GSE3982_NEUTROPHIL_VS_BASOPHIL_UP
3 GSE3982_NEUTROPHIL_VS_BASOPHIL_DN GSE3982_BCELL_VS_BASOPHIL_UP GSE3982_BCELL_VS_BASOPHIL_DN GSE3982_BASOPHIL_VS_EFF_MEMORY_CD4_TCELL_UP GSE3982_BASOPHIL_VS_EFF_MEMORY_CD4_TCELL_DN GSE3982_BASOPHIL_VS_CENT_MEMORY_CD4_TCELL_UP GSE3982_BASOPHIL_VS_CENT_MEMORY_CD4_TCELL_DN GSE3982_BASOPHIL_VS_NKCELL_UP GSE3982_BASOPHIL_VS_NKCELL_DN GSE3982_BASOPHIL_VS_TH1_UP GSE3982_BASOPHIL_VS_TH1_DN GSE3982_BASOPHIL_VS_TH2_UP GSE3982_BASOPHIL_VS_TH2_DN GSE3982_CTRL_VS_IGE_STIM_MAST_CELL_UP GSE3982_CTRL_VS_IGE_STIM_MAST_CELL_DN GSE3982_EOSINOPHIL_VS_MAST_CELL_UP GSE3982_EOSINOPHIL_VS_MAST_CELL_DN GSE3982_MAST_CELL_VS_DC_UP GSE3982_MAST_CELL_VS_DC_DN GSE3982_MAST_CELL_VS_MAC_UP GSE3982_MAST_CELL_VS_MAC_DN GSE3982_MAST_CELL_VS_NEUTROPHIL_UP GSE3982_MAST_CELL_VS_NEUTROPHIL_DN GSE3982_MAST_CELL_VS_BCELL_UP GSE3982_MAST_CELL_VS_BCELL_DN GSE3982_MAST_CELL_VS_EFF_MEMORY_CD4_TCELL_UP GSE3982_MAST_CELL_VS_EFF_MEMORY_CD4_TCELL_DN GSE3982_MAST_CELL_VS_CENT_MEMORY_CD4_TCELL_UP GSE3982_MAST_CELL_VS_CENT_MEMORY_CD4_TCELL_DN GSE3982_MAST_CELL_VS_NKCELL_UP GSE3982_MAST_CELL_VS_NKCELL_DN GSE3982_MAST_CELL_VS_TH1_UP GSE3982_MAST_CELL_VS_TH1_DN GSE3982_MAST_CELL_VS_TH2_UP GSE3982_MAST_CELL_VS_TH2_DN
4 Supplemental References 1 Toyama, H., Arai, F., Hosokawa, K., Ikushima, Y. M. & Suda, T. N-cadherin + HSCs in fetal liver exhibit higher long-term bone marrow reconstitution activity than N-cadherin - HSCs. Biochem. Biophys. Res. Commun. 428, (2012).
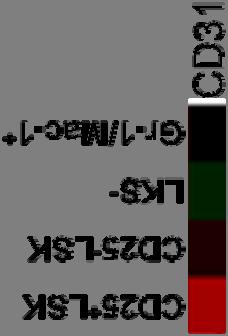
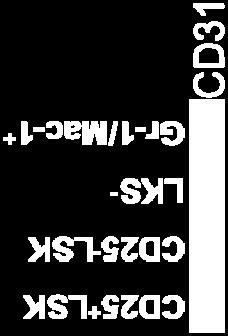
5 Supplemental Figure 1. CD25 is highly expressed in the CD34 - Flt3 - LSK fraction of CML model mice. (A B) Flow-cytometric analysis of the frequency (A; means ± s.d.) and number (B; means ± s.d.) of CD25 + cells in the CD34 - Flt3 - LSK fraction of CML model mice (red histogram) and control mice (gray histogram) (CML, n = 4; GFP, n = 4). (C) Flow-cytometric analysis of the frequency of CD25 + cells in LSK, LSK -, LKS -, LS - K -, and Gr-1/Mac-1 + cells of CML model mice (means ± s.d., n = 7). *P < 0.05 and **P < Supplemental Figure 2. Mast-cell-related genes are highly expressed in CD25 + LSK cells. A set of genes with an expression pattern similar to that of CD25. Genes expressed in CD25 + LSK, CD25 - LSK, LKS -, and Gra-1 + Mac-1 + cells from BCR-ABL + spleens were analyzed by microarray. Supplemental Figure 3. Variations in Sca-1 staining among antibody clones. Frequencies of CML LSK, CD25 - F - LSK, CD25 + F - LSK, or CD25 + F + LSK fractions detected by the Sca-1 antibody (clone E ) used throughout this study and another Sca-1 antibody,
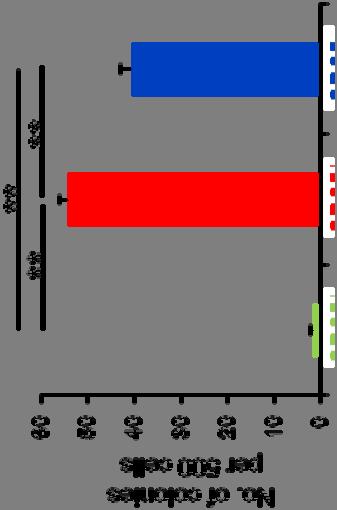
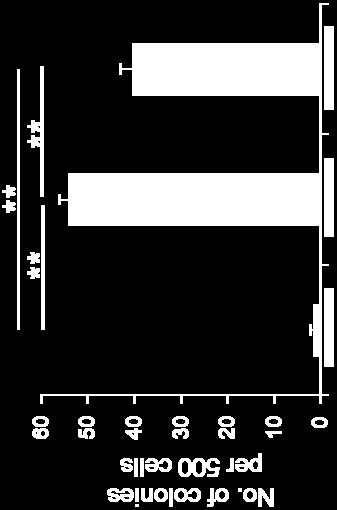
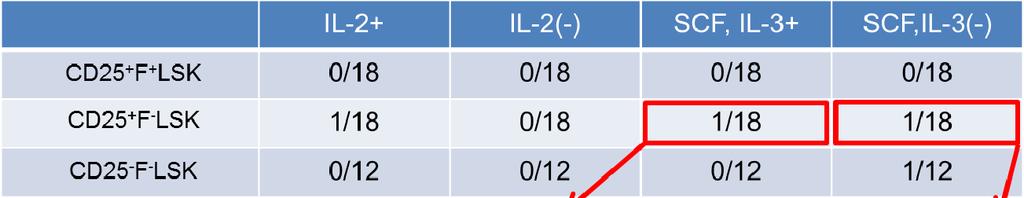
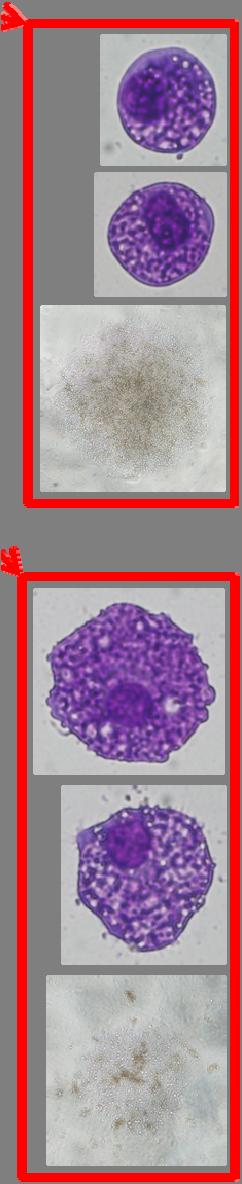
6 clone D7 (means ± s.d., n = 3). Supplemental Figure 4. CD25 + F - LSK cells exhibit higher colony-forming capacity and a predisposition to mast-cell differentiation. (A) Colony-forming capacity of CD25 + F + LSK, CD25 + F - LSK, or CD25 - F - LSK cells from CML model mice was examined in methyl cellulose supplemented with cytokines (means ± s.d., n = 3). (B) Single cell-derived colony counts and cellular morphology of CD25 + F + LSK, CD25 + F - LSK, or CD25 - F - LSK cells in liquid culture. Upper, Number of colonies derived from single CD25 + F + LSK, CD25 + F - LSK, or CD25 - F - LSK cells in the presence or absence of 100 ng/ml IL-2 or 50 ng/ml SCF plus 10 ng/ml of IL-3. Lower, cell morphology in liquid culture. Images were obtained and analyzed using a microscope (IX70; Olympus), UplanApo 20x/0.70 objective lens (Olympus), UPIanApo 40 /0.85 objective lens (Olympus) and DP Controller (Olympus). **P < Supplemental Figure 5. Apoptosis, homing capacity, and cell-cycle status of distinct subsets of cells in the CML LIC population. (A) Annexin V + cells in normal LSK, CML CD25 - F - LSK, CD25 + F - LSK, and CD25 + F + LSK
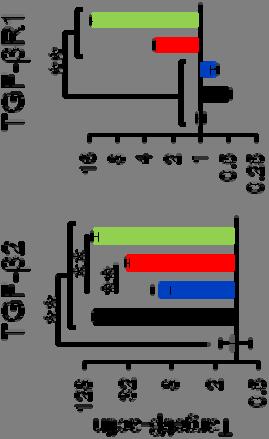
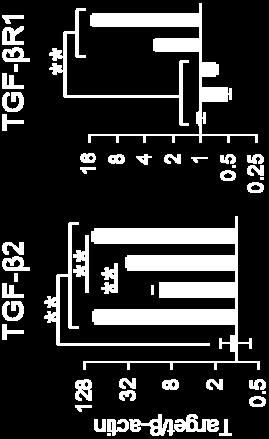
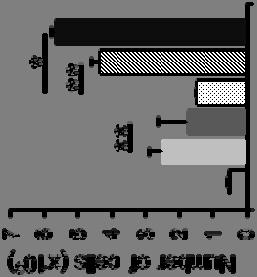
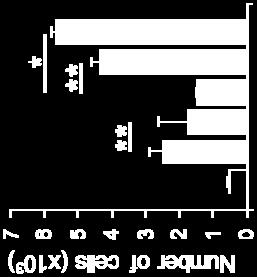
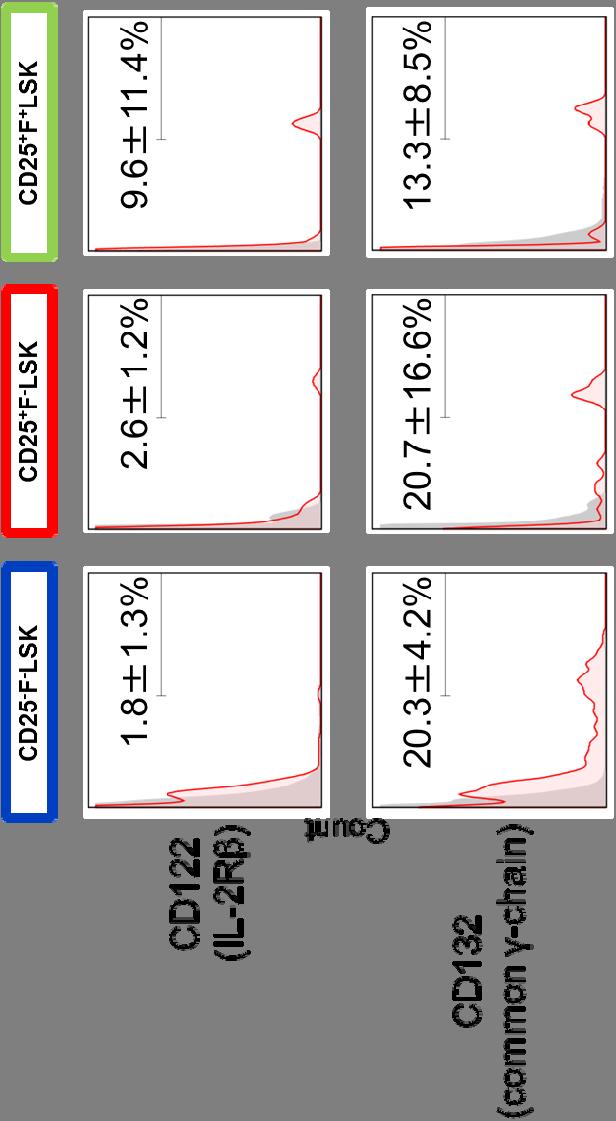
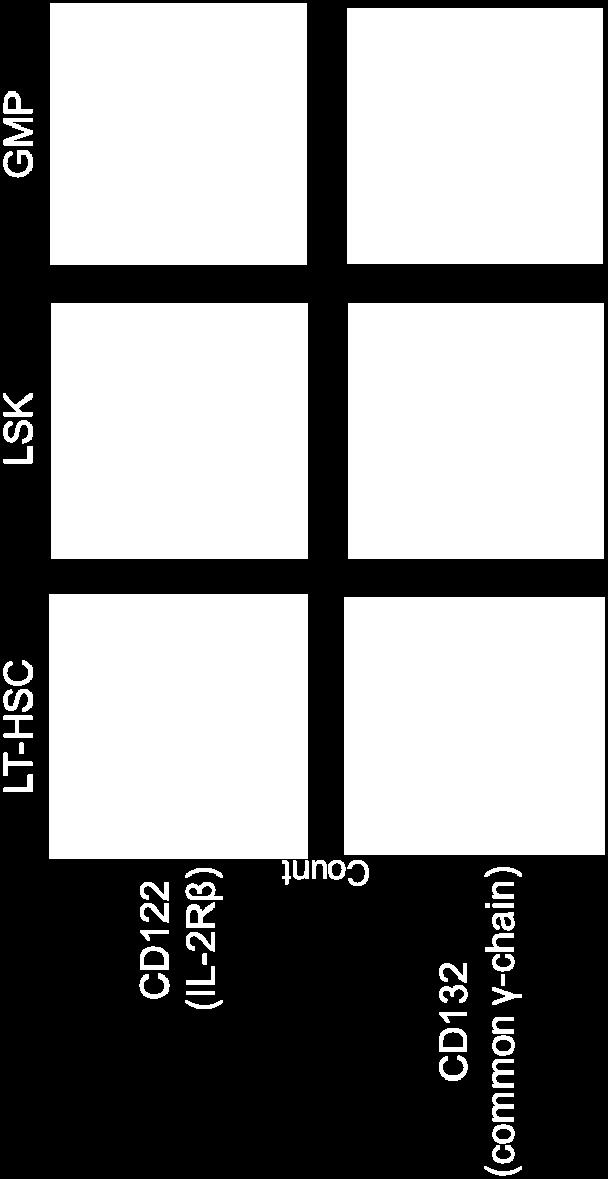
7 fractions (means ± s.d., n = 3). **P < (B C) Homing capacity of BCR-ABL transduced CD25 + LSK or CD25 - LSK cells ( per sample) to bone marrow (B) or spleen (C) 16 hr after BMT (n = 3; means ± SD). (D) Flow-cytometric analysis of the cell cycle in CML CD25 - F - LSK, CD25 + F - LSK, or CD25 + F + LSK fractions (means ± s.d., n = 4). *P < Supplemental Figure 6. TGF-β2 is highly expressed in CD25 + LSK cells and increases the number of CML LSK cells. (A) Quantitative PCR (qpcr) of TGF-β2 and TGF-βR1 expression in the indicated fractions from CML model mice. Each value was normalized to β-actin expression and is expressed as fold induction compared to the corresponding level in the control group (means ± s.d, n = 4). (B) Number of LSK cells after ex vivo culture of CD25 + F - LSK or CD25 - F - LSK cells with 10 ng/ml TGF-β1 or TGF-β2 for 8 days (means ± s.d., n = 4 5). *P < 0.05 and **P < Supplemental Figure 7. Expression of IL-2 receptor components in CML and normal primitive subpopulations. (A) Flow-cytometric analysis of CD122 (IL-2Rβ) and CD132 (common γ-chain) in the
8 indicated fractions (red histograms; means ± s.d., n = 4). Gray histograms are isotype controls. (B) Flow-cytometric analysis of CD122 (IL-2R ) and CD132 (common -chain) expression in normal bone-marrow fractions, including LT-HSC (CD34 - Flt3 - LSK), LSK, and GMP (Lin - c- Kit + Sca-1 - CD34 + FcγRII/III + ) (orange histograms). Gray histograms indicate isotype control staining. Numbers indicate the CD122- or CD132-positive fraction (means ± s.d., n = 3). Supplemental Figure 8. Surface marker profiles of IL-2 + cells in CML mice. Intracellular flow-cytometric analysis of IL-2 + cells in CML spleen (red histogram: IL-2 PE staining, gray histogram: isotype control) in combination with anti-cd8a, anti-b220, and anti- Gr-1 antibodies (mean ± s.d., n = 3). Supplemental Figure 9. Acceleration of leukemia by IL-2. (A) Survival of CML mice injected with vehicle or IL-2 (n = 7). (B) CD25 + F - LSK or CD25 - F - LSK cells from CML model mice ( cells per sample) were cultured for 16 days. Calculated cell number in LSK fractions (means ± s.d.) are shown (n = 5). *P < 0.05 and **P < (C) Colony numbers from CFU-C assay of three independent human CML samples with or
9 without human IL-2 (100U/ml) or anti-human CD25 neutralizing antibody (10 g/ml) (means ± s.d., n = 3). *P < Supplemental Figure 10. Peripheral blood parameters of Il2ra -/- LSK derived CML mice after transplantation. Blood parameters were examined 11 days after transplantation (n = 6). Supplemental Figure 11. Characterization of Il2Ra -/- CML mice and Il2Ra -/- mice. (A C) BCR-ABL + myeloid cell number in bone marrow (BM) or spleen (Sp) (A), BCR-ABL + cell frequency (B) and number (C) in Il2Ra +/+ or Il2Ra -/- CML mice (11 days after transplantation) (means ± s.d., n = 7). **P < (D) LSK frequency in Il2Ra +/+ or Il2Ra -/- BM (means ± s.d., n = 4 5). Supplemental Figure 12. Characterization of CML model mice treated with anti IL-2 monoclonal antibody. Peripheral blood status (A), BCR-ABL + myeloid cell number in bone marrow (BM) or spleen (Sp) (B), BCR-ABL + myeloid cell frequency in peripheral blood (PB) (C), spleen weight (D), BCR-ABL + cell frequency (E) and number (F) in bone marrow or spleen, and number of bone-
10 marrow LSK cells (G) in CML model mice treated with isotype antibody (n = 4) or anti-il-2 monoclonal antibody (n = 7) (11 days after transplantation) (means ± s.d.). *P < 0.05, **P < Supplemental Figure 13. Effect of anti-cd25 monoclonal antibody on CML model mice treated with nilotinib. Spleen weight (A), BCR-ABL + cell frequency in bone marrow (B) and spleen (C), and number of bone-marrow LSK cells in bone marrow (D) and spleen (E) in CML model mice treated with either vehicle or nilotinib in conjunction with either isotype antibody or anti-cd25 monoclonal antibody (11 days after transplantation) (n = 5; means ± s.d.). *P < 0.05, **P < Supplemental Figure 14. CD25 expression in untreated CML or normal human hematopoietic stem/progenitor cells. (A) Another pair of representative profiles for CD25 expression in freshly isolated bonemarrow CD34 + CD38 - (red histogram) and CD34 + CD38 + (blue histogram) fractions from an untreated CML CP patient or a lymphoma patient without bone-marrow involvement (related to Figure 6D).
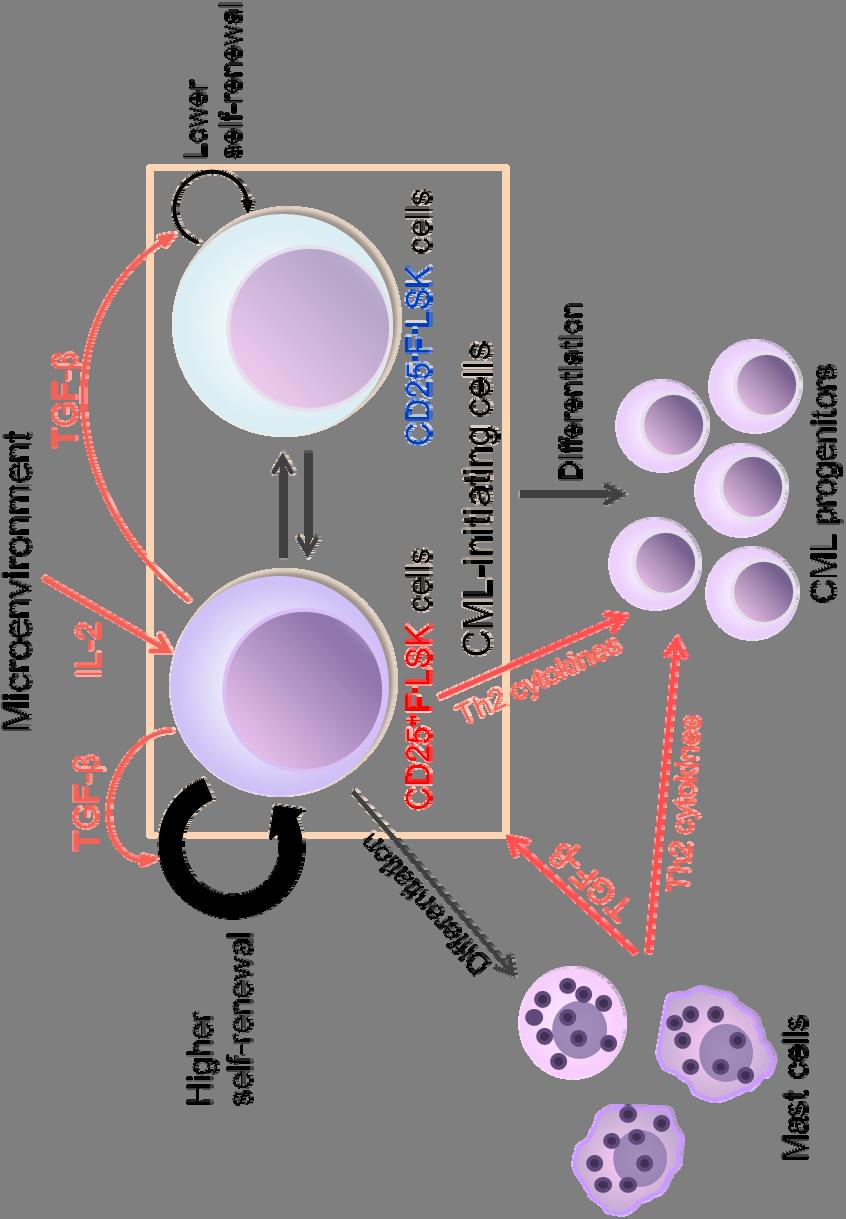
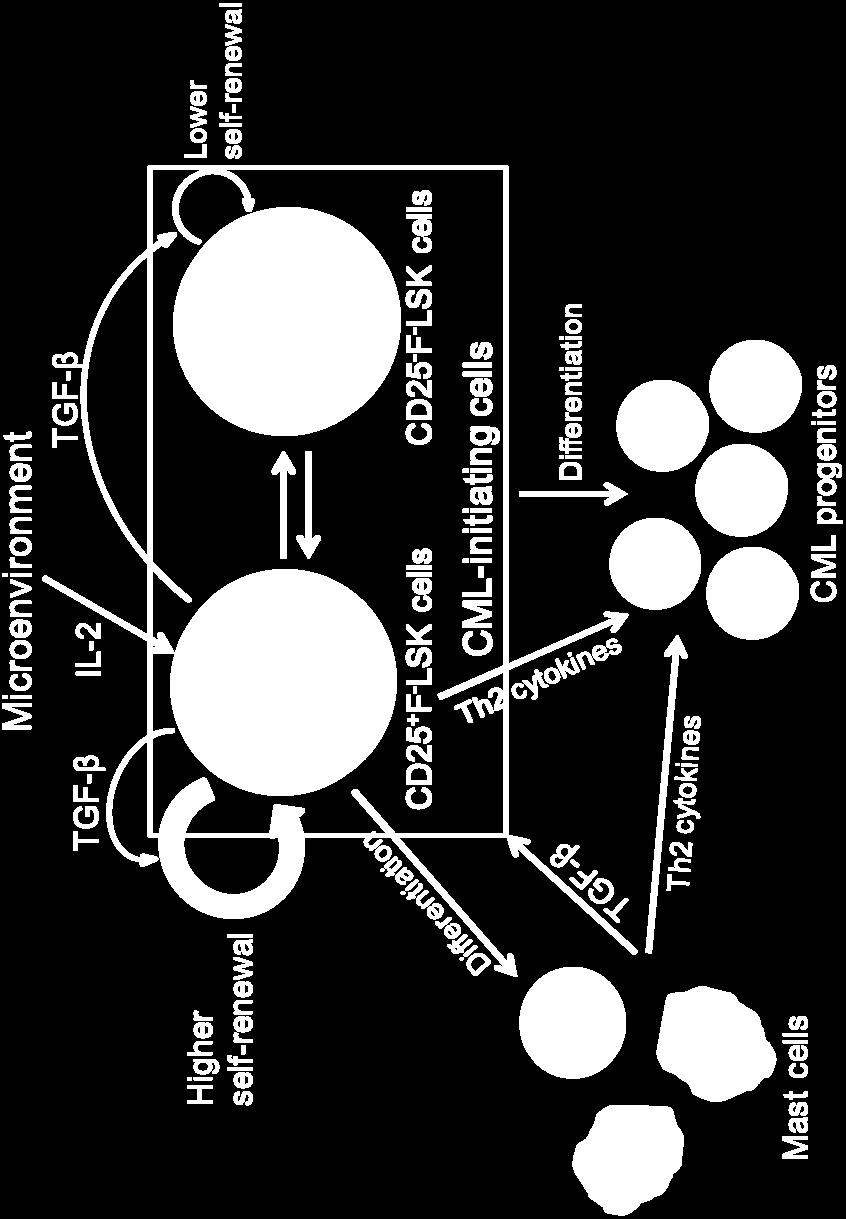
11 (B) Flow-cytometric profiles for CD25 expression in the frozen bone-marrow CD34 + CD38 - (red histogram) and CD34 + CD38 + (blue histogram) fractions from untreated CML CP patients (n = 3). Numbers indicate CD25 + cells in CD34 + CD38 - fractions. Supplemental Figure 15. Gene set enrichment analysis on human CML and B-ALL samples. (A B) Gene set enrichment analysis was applied to human leukemia samples. CML BC (n = 33) was compared to CML CP (n = 57) (A), and CD25 + B-ALL (n = 43) was compared to CD25-low or -negative B-ALL (n = 151) (B). Supplemental Figure 16. Revised model of CML LIC formation. Proposed model indicating distinct roles for IL-2 and CD25 + LSK cell-derived TGF-β in maintaining the leukemia-initiating capacity of CML LSK cells.
12 Supplemental Figure 1 A BCR-ABL + CD34 - Flt3 - LSK gated B Count CD ±16.2%* Number of cells (x10 3 ) GFP * CML C ** CD25 positive cells (%) LSK LSK - LKS - LS - K - Gr-1 /Mac-1 +
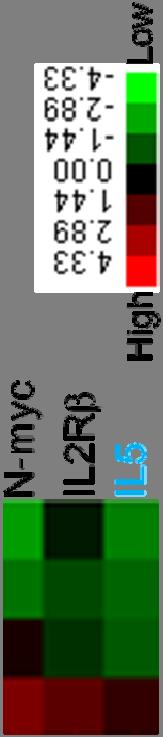

13 Supplemental Figure 2
14 Supplemental Figure 3 LSK CD25 - F - LSK CD25 + F - LSK CD25 + F + LSK P=0.51 P=0.49 P=0.30 P=0.85 Frequency (%) Frequency (%) Frequency (%) Frequency (%)

15 Supplemental Figure 4 A B
 Number of cells Number of cells Normal LSK CD25 - F - LSK CD25 + F - LSK CD25 + F + LSK CD25 - LSK CD25 + LSK CD25 - LSK CD25 + LSK D Normal LSK CD25 - F - LSK CD25 + F - LSK CD25")
16 Supplemental Figure 5 A ** B P=0.45 C P=0.22 Annexin V + (%) Number of cells Number of cells Normal LSK CD25 - F - LSK CD25 + F - LSK CD25 + F + LSK CD25 - LSK CD25 + LSK CD25 - LSK CD25 + LSK D Normal LSK CD25 - F - LSK CD25 + F - LSK CD25 + F + LSK Ki ±9.1% ±11.3% G1 S/G2/M 26.9 ±5.0% 55.5 ±4.1% 36.4 ±8.6% 53.8 ±8.2% 67.1 ±9.3% 15.1 ±5.8% G ± 3.1% 17.6 ± 4.6% 9.7 ± 2.7%* 17.8 ± 6.7% Hoechst 33342
17 Supplemental Figure 6 A B
18 Supplemental Figure 7 A B
19 Supplemental Figure 8 Splenic MNCs Cell number 1.4±1.1% CD8a 58.5±10.2% Cell number 87.6±5.1% IL-2-PE B220 Gr-1


20 Supplemental Figure 9 A Survival rate (%) Vehicle IL-2 P=0.029 B Cell number ** ** * ** CD25 + F + LSK CD25 + F - LSK CD25 - F - LSK Time post BMT (days) Vehicle IL-2 CD25 - F - LSK Vehicle IL-2 CD25 + F - LSK C * Colony number * *
21 Supplemental Figure 10 WBC (x10 3 / l) RBC (x10 4 / l) Hb (g/dl) HCT (%) WBC (x10 3 / l) P = RBC (x10 4 / l) P = Hb (g/dl) P = HCT (%) P = Il2ra +/+ Il2ra -/- Il2ra +/+ Il2ra -/- Il2ra +/+ Il2ra -/- Il2ra +/+ Il2ra -/ MCV (fl) P = MCH (pg) P = MCHC (g/dl) P = Plt (x10 4 / l) P = MCV (fl) MCH (pg) MCHC (g/dl) Plt (x10 4 / l) Il2ra +/+ Il2ra -/- Il2ra +/+ Il2ra -/- Il2ra +/+ Il2ra -/- Il2ra +/+ Il2ra -/- 0
22 Supplemental Figure 11 A Number of cells (x10 7 ) P= P= P= P= Il2Ra +/+ Il2Ra -/- BCR-ABL + BM granulocyte Il2Ra +/+ Il2Ra -/- BCR-ABL + BM monocyte Il2Ra +/+ Il2Ra -/- Il2Ra +/+ Il2Ra -/- BCR-ABL + Sp granulocyte BCR-ABL + Sp monocyte B Frequency (%) ** ** C Number of cells (x10 7 ) ** ** D Frequency (%) LSK P=0.069 Il2Ra +/+ Il2Ra -/- Bone marrow Il2Ra +/+ Il2Ra -/- Spleen Il2Ra +/+ Il2Ra -/- Bone marrow Il2Ra +/+ Il2Ra -/- Spleen Il2Ra +/+ Il2Ra -/-
 47.6±2.7 50.7±1.0 0.017 MCH (pg) 14.9±0.4 15.7±0.5 0.043 Plt (x10 4 /ul) 33.0±9.6 46.0±7.7 0.056 B P=0.96 P=0.038 P=0.")
23 A Number of cells (x10 7 ) Supplemental Figure 12 anti-il-2 P value WBC (/ul) 28750± ± RBC (x10 4 /ul) 838± ± Hb (g/dl) 12.5± ± HCT (%) 40.0± ± MCV (fl) 47.6± ± MCH (pg) 14.9± ± Plt (x10 4 /ul) 33.0± ± B P=0.96 P=0.038 P=0.38 P=0.012 C Frequency in PB (%) * anti IL-2 BCR-ABL + granulocyte * anti IL-2 BCR-ABL + monocyte D Spleen weight (mg) P=0.19 anti IL-2 anti IL-2 anti IL-2 BCR-ABL + BM granulocyte BCR-ABL + BM monocyte E Frequency (%) ** ** BCR-ABL + Sp granulocyte anti IL-2 F anti IL-2 BCR-ABL + Sp monocyte Number of cells (x10 7 ) * * G Number of cells (x10 3 ) * * CD25 + F + LSK CD25 + F - LSK CD25 - F - LSK anti IL-2 anti IL-2 Bone marrow Spleen anti IL-2 Bone marrow anti IL-2 Spleen anti IL-2
 +vehicle +Nilo Anti CD25 +Nilo +vehicle Anti CD25 +Nilo +Nilo Anti CD25 +vehicle")
 Number of cells (Sp) +vehicle +Nilo Anti CD25 +Nilo +vehicle +Nilo Anti")
24 Supplemental Figure 13 A ** B * C ** * * Spleen weight (mg) GFP + frequency in BM (%) GFP + frequency in Sp (%) +vehicle +Nilo Anti CD25 +Nilo +vehicle Anti CD25 +Nilo +Nilo Anti CD25 +vehicle +Nilo +Nilo D CD25 + F + LSK CD25 + F - LSK CD25 - F - LSK E CD25 + F + LSK CD25 + F - LSK CD25 - F - LSK Number of cells (BM) Number of cells (Sp) +vehicle +Nilo Anti CD25 +Nilo +vehicle +Nilo Anti CD25 +Nilo


25 Supplemental Figure 14 A CD38 Count Count B CD34 CD25 CML Case 3 CML Case 4 CML Case % 0.88% 0 % Count CD25


26 Supplemental Figure 15 A CML BC vs CML CP B B-ALL CD25 positive vs B-ALL CD25 low or negative
27 Supplemental Figure 16
sequences of a styx mutant reveals a T to A transversion in the donor splice site of intron 5
 sfigure 1 Styx mutant mice recapitulate the phenotype of SHIP -/- mice. (A) Analysis of the genomic sequences of a styx mutant reveals a T to A transversion in the donor splice site of intron 5 (GTAAC
Nature Immunology: doi: /ni Supplementary Figure 1. Huwe1 has high expression in HSCs and is necessary for quiescence.
 Supplementary Figure 1 Huwe1 has high expression in HSCs and is necessary for quiescence. (a) Heat map visualizing expression of genes with a known function in ubiquitin-mediated proteolysis (KEGG: Ubiquitin
X P. Supplementary Figure 1. Nature Medicine: doi: /nm Nilotinib LSK LT-HSC. Cytoplasm. Cytoplasm. Nucleus. Nucleus
 a b c Supplementary Figure 1 c-kit-apc-eflu780 Lin-FITC Flt3-Linc-Kit-APC-eflu780 LSK Sca-1-PE-Cy7 d e f CD48-APC LT-HSC CD150-PerCP-cy5.5 g h i j Cytoplasm RCC1 X Exp 5 mir 126 SPRED1 SPRED1 RAN P SPRED1
Supplementary Figure 1. Successful excision of genes from WBM lysates and
 Supplementary Information: Supplementary Figure 1. Successful excision of genes from WBM lysates and survival of mice with different genotypes. (a) The proper excision of Pten, p110α, p110α and p110δ was
Effective Targeting of Quiescent Chronic Myelogenous
 Cancer Cell, Volume 7 Supplemental Information Effective Targeting of Quiescent Chronic Myelogenous Leukemia Stem Cells by Histone Deacetylase Inhibitors in Combination with Imatinib Mesylate Bin Zhang,
Supplementary Figure 1. Characterization of basophils after reconstitution of SCID mice
 Supplementary figure legends Supplementary Figure 1. Characterization of after reconstitution of SCID mice with CD4 + CD62L + T cells. (A-C) SCID mice (n = 6 / group) were reconstituted with 2 x 1 6 CD4
Nature Immunology: doi: /ni.3412
 Supplementary Figure 1 Gata1 expression in heamatopoietic stem and progenitor populations. (a) Unsupervised clustering according to 100 top variable genes across single pre-gm cells. The two main cell
SUPPLEMENTARY FIGURES
 SUPPLEMENTARY FIGURES Supplementary Figure 1: Chemokine receptor expression profiles of CCR6 + and CCR6 - CD4 + IL-17A +/ex and Treg cells. Quantitative PCR analysis of chemokine receptor transcript abundance
Nature Immunology: doi: /ni Supplementary Figure 1. Cellularity of leukocytes and their progenitors in naive wild-type and Spp1 / mice.
 Supplementary Figure 1 Cellularity of leukocytes and their progenitors in naive wild-type and Spp1 / mice. (a, b) Gating strategies for differentiated cells including PMN (CD11b + Ly6G hi and CD11b + Ly6G
Pearson r = P (one-tailed) = n = 9
 = n = 9") 8F4-Specific Lysis, % 1 UPN1 UPN3 8 UPN7 6 Pearson r =.69 UPN2 UPN5 P (one-tailed) =.192 4 UPN8 n = 9 2 UPN9 UPN4 UPN6 5 1 15 2 25 8 8F4, % Max MFI Supplementary Figure S1. AML samples UPN1-UPN9 show variable
8F4-Specific Lysis, % 1 UPN1 UPN3 8 UPN7 6 Pearson r =.69 UPN2 UPN5 P (one-tailed) =.192 4 UPN8 n = 9 2 UPN9 UPN4 UPN6 5 1 15 2 25 8 8F4, % Max MFI Supplementary Figure S1. AML samples UPN1-UPN9 show variable
SUPPLEMENTARY INFORMATION
 doi:10.1038/nature11095 Supplementary Table 1. Summary of the binding between Angptls and various Igdomain containing receptors as determined by flow cytometry analysis. The results were summarized from
Supplementary Figure S1. Flow cytometric analysis of the expression of Thy1 in NH cells. Flow cytometric analysis of the expression of T1/ST2 and
 Supplementary Figure S1. Flow cytometric analysis of the expression of Thy1 in NH cells. Flow cytometric analysis of the expression of T1/ST2 and Thy1 in NH cells derived from the lungs of naïve mice.
Supplement Material. Spleen weight (mg) LN cells (X106) Acat1-/- Acat1-/- Mouse weight (g)
 LN cells (X106) Acat1-/- Acat1-/- Mouse weight (g)") Supplement Material A Spleen weight (mg) C Mouse weight (g) 1 5 1 2 9 6 3 2 5 2 1 5 Male LN cells (X16) 4 ** ** Female B 3 2 1 Supplemental Figure I. Spleen weight (A), Inguinal lymph node (LN) cell number
Supplement Material A Spleen weight (mg) C Mouse weight (g) 1 5 1 2 9 6 3 2 5 2 1 5 Male LN cells (X16) 4 ** ** Female B 3 2 1 Supplemental Figure I. Spleen weight (A), Inguinal lymph node (LN) cell number
Supplementary Figure 1. IL-12 serum levels and frequency of subsets in FL patients. (A) IL-12
 IL-12") 1 Supplementary Data Figure legends Supplementary Figure 1. IL-12 serum levels and frequency of subsets in FL patients. (A) IL-12 serum levels measured by multiplex ELISA (Luminex) in FL patients before
1 Supplementary Data Figure legends Supplementary Figure 1. IL-12 serum levels and frequency of subsets in FL patients. (A) IL-12 serum levels measured by multiplex ELISA (Luminex) in FL patients before
% of live splenocytes. STAT5 deletion. (open shapes) % ROSA + % floxed
 % ROSA + % floxed") Supp. Figure 1. a 14 1 1 8 6 spleen cells (x1 6 ) 16 % of live splenocytes 5 4 3 1 % of live splenocytes 8 6 4 b 1 1 c % of CD11c + splenocytes (closed shapes) 8 6 4 8 6 4 % ROSA + (open shapes) % floxed
Supp. Figure 1. a 14 1 1 8 6 spleen cells (x1 6 ) 16 % of live splenocytes 5 4 3 1 % of live splenocytes 8 6 4 b 1 1 c % of CD11c + splenocytes (closed shapes) 8 6 4 8 6 4 % ROSA + (open shapes) % floxed
SUPPLEMENTARY INFORMATION
 a. Smo+/+ b. Smo+/+ 5.63 5.48 c. Lin- d. e. 6 5 4 3 Ter119 Mac B T Sca1 Smo+/+ 25 15 2 o BMT 2 1 5 * Supplementary Figure 1: Deletion of Smoothened does not alter the frequency of hematopoietic lineages
Blocking antibodies and peptides. Rat anti-mouse PD-1 (29F.1A12, rat IgG2a, k), PD-
, PD-") Supplementary Methods Blocking antibodies and peptides. Rat anti-mouse PD-1 (29F.1A12, rat IgG2a, k), PD- L1 (10F.9G2, rat IgG2b, k), and PD-L2 (3.2, mouse IgG1) have been described (24). Anti-CTLA-4 (clone
Supplementary Methods Blocking antibodies and peptides. Rat anti-mouse PD-1 (29F.1A12, rat IgG2a, k), PD- L1 (10F.9G2, rat IgG2b, k), and PD-L2 (3.2, mouse IgG1) have been described (24). Anti-CTLA-4 (clone
Eosinophils are required. for the maintenance of plasma cells in the bone marrow
 Eosinophils are required for the maintenance of plasma cells in the bone marrow Van Trung Chu, Anja Fröhlich, Gudrun Steinhauser, Tobias Scheel, Toralf Roch, Simon Fillatreau, James J. Lee, Max Löhning
CD34+ Cells: A Comparison of Stem and Progenitor Cells in Cord Blood, Peripheral Blood, and the Bone Marrow
 White Paper September 2016 CD34+ Cells: A Comparison of Stem and Progenitor Cells in Cord Blood, Peripheral Blood, and the Bone Marrow Lily C. Trajman, PhD Introduction: Hematopoietic Stem Cells (HSCs)
Hematopathology Case Study
 www.medfusionservices.com Hematopathology Case Study CV3515-14 JUNE Clinical Presentation: Clinical Information: A 42 year old male with history of chronic myelogenous leukemia (CML) presents with an elevated
W/T Itgam -/- F4/80 CD115. F4/80 hi CD115 + F4/80 + CD115 +
 F4/8 % in the peritoneal lavage 6 4 2 p=.15 n.s p=.76 CD115 F4/8 hi CD115 + F4/8 + CD115 + F4/8 hi CD115 + F4/8 + CD115 + MHCII MHCII Supplementary Figure S1. CD11b deficiency affects the cellular responses
Molecular Characterization of Leukemia Stem Cell Development. Scott A. Armstrong MD, Ph.D.
 Molecular Characterization of Leukemia Stem Cell Development Scott A. Armstrong MD, Ph.D. Normal and Leukemic Hierarchies NORMAL HSC (SRC) Myeloid progenitor LTC-IC CFU AML LSC (SL-IC) Leukemic LTC-IC
activation with anti-cd3/cd28 beads and 3d following transduction. Supplemental Figure 2 shows
 Supplemental Data Supplemental Figure 1 compares CXCR4 expression in untreated CD8 + T cells, following activation with anti-cd3/cd28 beads and 3d following transduction. Supplemental Figure 2 shows the
Nature Immunology: doi: /ni Supplementary Figure 1. Examples of staining for each antibody used for the mass cytometry analysis.
 Supplementary Figure 1 Examples of staining for each antibody used for the mass cytometry analysis. To illustrate the functionality of each antibody probe, representative plots illustrating the expected
Supplemental Figure 1
 Supplemental Figure 1 1a 1c PD-1 MFI fold change 6 5 4 3 2 1 IL-1α IL-2 IL-4 IL-6 IL-1 IL-12 IL-13 IL-15 IL-17 IL-18 IL-21 IL-23 IFN-α Mut Human PD-1 promoter SBE-D 5 -GTCTG- -1.2kb SBE-P -CAGAC- -1.kb
Supplemental Figure 1. Signature gene expression in in vitro differentiated Th0, Th1, Th2, Th17 and Treg cells. (A) Naïve CD4 + T cells were cultured
 Naïve CD4 + T cells were cultured") Supplemental Figure 1. Signature gene expression in in vitro differentiated Th0, Th1, Th2, Th17 and Treg cells. (A) Naïve CD4 + T cells were cultured under Th0, Th1, Th2, Th17, and Treg conditions. mrna
Supplemental Figure 1. Signature gene expression in in vitro differentiated Th0, Th1, Th2, Th17 and Treg cells. (A) Naïve CD4 + T cells were cultured under Th0, Th1, Th2, Th17, and Treg conditions. mrna
SUPPLEMENTARY INFORMATION doi: /nature12026
 doi:1.138/nature1226 a 4 35 3 MCSF level (pg/ml) 25 2 15 1 5 1h3 3h 5h 7h 15h 24h b MPP (CD135 KSL) HSC (CD34 CD15 KSLF) c % 4 ** LPS 3 GFP pos cells 2 PU.1 GFP LPS 1 FSCA Ctl NI 24h LPS Sup.Fig.1 Effect
MATERIALS AND METHODS. Neutralizing antibodies specific to mouse Dll1, Dll4, J1 and J2 were prepared as described. 1,2 All
 MATERIALS AND METHODS Antibodies (Abs), flow cytometry analysis and cell lines Neutralizing antibodies specific to mouse Dll1, Dll4, J1 and J2 were prepared as described. 1,2 All other antibodies used
Natural Killer Cells: Development, Diversity, and Applications to Human Disease Dr. Michael A. Caligiuri
 Natural Killer Cells: Development, Diversity, November 26, 2008 The Ohio State University Comprehensive Cancer Center The James Cancer Hospital and Solove Research Institute Columbus, Ohio, USA 1 Human
Human chronic myeloid leukemia stem cells are insensitive to imatinib despite inhibition of BCR-ABL activity
 Research article Related Commentary, page 22 Human chronic myeloid leukemia stem cells are insensitive to imatinib despite inhibition of BCR-ABL activity Amie S. Corbin, 1,2 Anupriya Agarwal, 1 Marc Loriaux,
Tbk1-TKO! DN cells (%)! 15! 10!
! 15! 10!") a! T Cells! TKO! B Cells! TKO! b! CD4! 8.9 85.2 3.4 2.88 CD8! Tbk1-TKO! 1.1 84.8 2.51 2.54 c! DN cells (%)! 4 3 2 1 DP cells (%)! 9 8 7 6 CD4 + SP cells (%)! 5 4 3 2 1 5 TKO! TKO! TKO! TKO! 15 1 5 CD8
a! T Cells! TKO! B Cells! TKO! b! CD4! 8.9 85.2 3.4 2.88 CD8! Tbk1-TKO! 1.1 84.8 2.51 2.54 c! DN cells (%)! 4 3 2 1 DP cells (%)! 9 8 7 6 CD4 + SP cells (%)! 5 4 3 2 1 5 TKO! TKO! TKO! TKO! 15 1 5 CD8
Therapeutic effect of baicalin on experimental autoimmune encephalomyelitis. is mediated by SOCS3 regulatory pathway
 Therapeutic effect of baicalin on experimental autoimmune encephalomyelitis is mediated by SOCS3 regulatory pathway Yuan Zhang 1,2, Xing Li 1,2, Bogoljub Ciric 1, Cun-gen Ma 3, Bruno Gran 4, Abdolmohamad
Supplemental Information. Gut Microbiota Promotes Hematopoiesis to Control Bacterial Infection. Cell Host & Microbe, Volume 15
 Cell Host & Microbe, Volume 15 Supplemental Information Gut Microbiota Promotes Hematopoiesis to Control Bacterial Infection Arya Khosravi, Alberto Yáñez, Jeremy G. Price, Andrew Chow, Miriam Merad, Helen
SUPPLEMENTARY INFORMATION
 doi:10.1038/nature10134 Supplementary Figure 1. Anti-inflammatory activity of sfc. a, Autoantibody immune complexes crosslink activating Fc receptors, promoting activation of macrophages, and WWW.NATURE.COM/NATURE
Beyond the CBC Report: Extended Laboratory Testing in the Evaluation for Hematologic Neoplasia Disclosure
 Beyond the CBC Report: Extended Laboratory Testing in the Evaluation for Hematologic Neoplasia Disclosure I am receiving an honorarium from Sysmex for today s presentation. 1 Determining the Etiology for
SUPPLEMENTARY INFORMATION
 SUPPLEMENTARY INFORMATION Pleiotrophin Regulates the Expansion and Regeneration of Hematopoietic Stem Cells Heather A Himburg 1, Garrett G Muramoto 1 *, Pamela Daher 1*, Sarah K Meadows 1, J. Lauren Russell
The encephalitogenicity of TH17 cells is dependent on IL-1- and IL-23- induced production of the cytokine GM-CSF
 CORRECTION NOTICE Nat.Immunol. 12, 568 575 (2011) The encephalitogenicity of TH17 cells is dependent on IL-1- and IL-23- induced production of the cytokine GM-CSF Mohamed El-Behi, Bogoljub Ciric, Hong
NK cell flow cytometric assay In vivo DC viability and migration assay
 NK cell flow cytometric assay 6 NK cells were purified, by negative selection with the NK Cell Isolation Kit (Miltenyi iotec), from spleen and lymph nodes of 6 RAG1KO mice, injected the day before with
Chronic Myeloid Leukemia Outlook: The Future of CML Therapy
 Chronic Myeloid Leukemia Outlook: The Future of CML Therapy Neil Shah, MD PhD Edward S. AgenoDistinguished Professor in Hematology/Oncology UCSF School of Medicine San Francisco, California Progression
SUPPLEMENTARY INFORMATION
 SUPPLEMENTARY INFORMATION doi:10.1038/nature19814 Figure 3e - - - Beads: Hep SA Sup Hep SA Sup Hep - SA - Sup 150 102 76 102 76 Blot: NP-1 Blot: MECA-32 Blot: VEGF Figure 3f Rbt IgG ctrl IP VEGF IP Extended
D CD8 T cell number (x10 6 )
") IFNγ Supplemental Figure 1. CD T cell number (x1 6 ) 18 15 1 9 6 3 CD CD T cells CD6L C CD5 CD T cells CD6L D CD8 T cell number (x1 6 ) 1 8 6 E CD CD8 T cells CD6L F Log(1)CFU/g Feces 1 8 6 p
IFNγ Supplemental Figure 1. CD T cell number (x1 6 ) 18 15 1 9 6 3 CD CD T cells CD6L C CD5 CD T cells CD6L D CD8 T cell number (x1 6 ) 1 8 6 E CD CD8 T cells CD6L F Log(1)CFU/g Feces 1 8 6 p
Nature Genetics: doi: /ng Supplementary Figure 1
 Supplementary Figure 1 MSI2 interactors are associated with the riboproteome and are functionally relevant. (a) Coomassie blue staining of FLAG-MSI2 immunoprecipitated complexes. (b) GO analysis of MSI2-interacting
Supplemental Table 1. Primer sequences for transcript analysis
 Supplemental Table 1. Primer sequences for transcript analysis Primer Sequence (5 3 ) Primer Sequence (5 3 ) Mmp2 Forward CCCGTGTGGCCCTC Mmp15 Forward CGGGGCTGGCT Reverse GCTCTCCCGGTTTC Reverse CCTGGTGTGCCTGCTC
0.0 All T-lymph B-lymph Sarcomas Carcinomas Germ cell. Tumor type
 Fig S1 A B Tumors per mouse 1.2 1.0 0.8 0.6 0.4 0.2 0.0 All T-lymph B-lymph Sarcomas Carcinomas Germ cell Tumor type -/- (n = 46) Q/- (n = 76) Q/Q (n = 31) Tumors per mouse 1.2 1.0 0.8 0.6 0.4 0.2 0.0
Bezzi et al., Supplementary Figure 1 *** Nature Medicine: doi: /nm Pten pc-/- ;Zbtb7a pc-/- Pten pc-/- ;Pml pc-/- Pten pc-/- ;Trp53 pc-/-
 Gr-1 Gr-1 Gr-1 Bezzi et al., Supplementary Figure 1 a Gr1-CD11b 3 months Spleen T cells 3 months Spleen B cells 3 months Spleen Macrophages 3 months Spleen 15 4 8 6 c CD11b+/Gr1+ cells [%] 1 5 b T cells
SUPPLEMENTARY METHODS
 SUPPLEMENTARY METHODS Histological analysis. Colonic tissues were collected from 5 parts of the middle colon on day 7 after the start of DSS treatment, and then were cut into segments, fixed with 4% paraformaldehyde,
Cell isolation. Spleen and lymph nodes (axillary, inguinal) were removed from mice
 were removed from mice") Supplementary Methods: Cell isolation. Spleen and lymph nodes (axillary, inguinal) were removed from mice and gently meshed in DMEM containing 10% FBS to prepare for single cell suspensions. CD4 + CD25
Supplementary Methods: Cell isolation. Spleen and lymph nodes (axillary, inguinal) were removed from mice and gently meshed in DMEM containing 10% FBS to prepare for single cell suspensions. CD4 + CD25
Supplemental Information. T Cells Enhance Autoimmunity by Restraining Regulatory T Cell Responses via an Interleukin-23-Dependent Mechanism
 Immunity, Volume 33 Supplemental Information T Cells Enhance Autoimmunity by Restraining Regulatory T Cell Responses via an Interleukin-23-Dependent Mechanism Franziska Petermann, Veit Rothhammer, Malte
Supplemental Information. Granulocyte-Monocyte Progenitors and. Monocyte-Dendritic Cell Progenitors Independently
 Immunity, Volume 47 Supplemental Information Granulocyte-Monocyte Progenitors and Monocyte-endritic ell Progenitors Independently Produce Functionally istinct Monocytes lberto Yáñez, Simon G. oetzee, ndre
University of Miami Miller School of Medicine, Miami, FL 33136, USA, 3 State Key Laboratory
 Supplementary File ASXL1 plays an important role in erythropoiesis Hui Shi 1,2,3, Shohei Yamamoto 1,2,4, Mengyao Sheng 3, Jie Bai 3, Peng Zhang 1,2, Runze Chen 1,2, Shi Chen 1,2, Lihong Shi 3, Omar Abdel-Wahab
HEAMATOLOGICAL INDICES AND BONE MARROW BIOPSY
 HEAMATOLOGICAL INDICES AND BONE MARROW BIOPSY HEMATOCRIT Hematocrit is a measure of the percentage of the total blood volume that is made up by the red blood cells The hematocrit can be determined directly
Figure S1. Generation of inducible PTEN deficient mice and the BMMCs (A) B6.129 Pten loxp/loxp mice were mated with B6.
 B6.129 Pten loxp/loxp mice were mated with B6.") Figure S1. Generation of inducible PTEN deficient mice and the BMMCs (A) B6.129 Pten loxp/loxp mice were mated with B6.129-Gt(ROSA)26Sor tm1(cre/ert2)tyj /J mice. To induce deletion of the Pten locus,
Figure S1. Generation of inducible PTEN deficient mice and the BMMCs (A) B6.129 Pten loxp/loxp mice were mated with B6.129-Gt(ROSA)26Sor tm1(cre/ert2)tyj /J mice. To induce deletion of the Pten locus,
SUPPLEMENTARY INFORMATION
 1. Supplementary Figures and Legends Supplementary Fig. 1. S1P-mediated transcriptional regulation of integrins expressed in OP/monocytoid cells. Real-time quantitative PCR analyses of mrna for two integrins,
Supplemental Information. IRF-5 Promotes Cell Death in CD4 T Cells. during Chronic Infection
 Cell Reports, Volume 24 Supplemental Information IRF-5 Promotes Cell Death in T Cells during Chronic Infection Aymeric Fabié, Linh Thuy Mai, Xavier Dagenais-Lussier, Akil Hammami, Julien van Grevenynghe,
Supplemental Information. Cancer-Associated Fibroblasts Neutralize. the Anti-tumor Effect of CSF1 Receptor Blockade
 Cancer Cell, Volume 32 Supplemental Information Cancer-Associated Fibroblasts Neutralize the Anti-tumor Effect of CSF1 Receptor Blockade by Inducing PMN-MDSC Infiltration of Tumors Vinit Kumar, Laxminarasimha
SUPPLEMENTARY INFORMATION
 DOI: 1.138/ncb3355 a S1A8 + cells/ total.1.8.6.4.2 b S1A8/?-Actin c % T-cell proliferation 3 25 2 15 1 5 T cells Supplementary Figure 1 Inter-tumoral heterogeneity of MDSC accumulation in mammary tumor
Hua Tang, Weiping Cao, Sudhir Pai Kasturi, Rajesh Ravindran, Helder I Nakaya, Kousik
 SUPPLEMENTARY FIGURES 1-19 T H 2 response to cysteine-proteases requires dendritic cell-basophil cooperation via ROS mediated signaling Hua Tang, Weiping Cao, Sudhir Pai Kasturi, Rajesh Ravindran, Helder
Supplementary Figure 1. Immune profiles of untreated and PD-1 blockade resistant EGFR and Kras mouse lung tumors (a) Total lung weight of untreated
 Total lung weight of untreated") 1 Supplementary Figure 1. Immune profiles of untreated and PD-1 blockade resistant EGFR and Kras mouse lung tumors (a) Total lung weight of untreated (U) EGFR TL mice (n=7), Kras mice (n=7), PD-1 blockade
1 Supplementary Figure 1. Immune profiles of untreated and PD-1 blockade resistant EGFR and Kras mouse lung tumors (a) Total lung weight of untreated (U) EGFR TL mice (n=7), Kras mice (n=7), PD-1 blockade
EML Erythroid and Neutrophil Differentiation Protocols Cristina Pina 1*, Cristina Fugazza 2 and Tariq Enver 3
 EML Erythroid and Neutrophil Differentiation Protocols Cristina Pina 1*, Cristina Fugazza 2 and Tariq Enver 3 1 Department of Haematology, University of Cambridge, Cambridge, UK; 2 Dipartimento de Biotecnologie
Supplemental Information. CD4 + CD25 + Foxp3 + Regulatory T Cells Promote. Th17 Cells In Vitro and Enhance Host Resistance
 Immunity, Volume 34 Supplemental Information D4 + D25 + + Regulatory T ells Promote Th17 ells In Vitro and Enhance Host Resistance in Mouse andida albicans Th17 ell Infection Model Pushpa Pandiyan, Heather
Supplementary Materials for
 www.sciencemag.org/content/348/6241/aaa825/suppl/dc1 Supplementary Materials for A mucosal vaccine against Chlamydia trachomatis generates two waves of protective memory T cells Georg Stary,* Andrew Olive,
Supplemental Materials for. Effects of sphingosine-1-phosphate receptor 1 phosphorylation in response to. FTY720 during neuroinflammation
 Supplemental Materials for Effects of sphingosine-1-phosphate receptor 1 phosphorylation in response to FTY7 during neuroinflammation This file includes: Supplemental Table 1. EAE clinical parameters of
VEGFR2-Mediated Vascular Dilation as a Mechanism of VEGF-Induced Anemia and Bone Marrow Cell Mobilization
 Cell Reports, Volume 9 Supplemental Information VEGFR2-Mediated Vascular Dilation as a Mechanism of VEGF-Induced Anemia and Bone Marrow Cell Mobilization Sharon Lim, Yin Zhang, Danfang Zhang, Fang Chen,
Supplementary Information. Tissue-wide immunity against Leishmania. through collective production of nitric oxide
 Supplementary Information Tissue-wide immunity against Leishmania through collective production of nitric oxide Romain Olekhnovitch, Bernhard Ryffel, Andreas J. Müller and Philippe Bousso Supplementary
PBMC from each patient were suspended in AIM V medium (Invitrogen) with 5% human
 with 5% human") Anti-CD19-CAR transduced T-cell preparation PBMC from each patient were suspended in AIM V medium (Invitrogen) with 5% human AB serum (Gemini) and 300 international units/ml IL-2 (Novartis). T cell proliferation
Anti-CD19-CAR transduced T-cell preparation PBMC from each patient were suspended in AIM V medium (Invitrogen) with 5% human AB serum (Gemini) and 300 international units/ml IL-2 (Novartis). T cell proliferation
Supplementary Figure 1. ETBF activate Stat3 in B6 and Min mice colons
 Supplementary Figure 1 ETBF activate Stat3 in B6 and Min mice colons a pstat3 controls Pos Neg ETBF 1 2 3 4 b pstat1 pstat2 pstat3 pstat4 pstat5 pstat6 Actin Figure Legend: (a) ETBF induce predominantly
Mariusz Z. Ratajczak M.D., Ph.D., d.hc. Stem Cell Institute at the James Graham Brown Cancer Center, University of Louisville.
 Umbilical cord blood-derived CD45 - /SSEA-4 + /OCT-4 + /CD133 + /CXCR4 + /Lin - very small embryonic/epiblast like stem cells (VSELs) Potential Clinical Applications Mariusz Z. Ratajczak M.D., Ph.D., d.hc.
The nucleotide sugar UDP-glucose mobilizes long-term repopulating primitive hematopoietic cells
 Research article The nucleotide sugar UDP-glucose mobilizes long-term repopulating primitive hematopoietic cells Sungho Kook, 1 Joonseok Cho, 1 Sean Bong Lee, 2 and Byeong-Chel Lee 1 1 University of Pittsburgh
CD44
 MR1-5-OP-RU CD24 CD24 CD44 MAIT cells 2.78 11.2 WT RORγt- GFP reporter 1 5 1 4 1 3 2.28 1 5 1 4 1 3 4.8 1.6 8.1 1 5 1 4 1 3 1 5 1 4 1 3 3.7 3.21 8.5 61.7 1 2 1 3 1 4 1 5 TCRβ 2 1 1 3 1 4 1 5 CD44 1 2 GFP
Insights into the Cell-of-Origin of the Histiocytoses Using Patient-Derived Xenograft Models
 Insights into the Cell-of-Origin of the Histiocytoses Using Patient-Derived Xenograft Models 4 th Annual International Erdheim-Chester Disease Medical Symposium Paris, France September 15, 2016 Benjamin
Hematopoiesis. BHS Liège 27/1/2012. Dr Sonet Anne UCL Mont-Godinne
 Hematopoiesis BHS Liège 27/1/2012 Dr Sonet Anne UCL Mont-Godinne Hematopoiesis: definition = all the phenomenons to produce blood cells Leukocytes = White Blood Cells Polynuclear = Granulocytes Platelet
Toluidin-Staining of mast cells Ear tissue was fixed with Carnoy (60% ethanol, 30% chloroform, 10% acetic acid) overnight at 4 C, afterwards
 overnight at 4 C, afterwards") Toluidin-Staining of mast cells Ear tissue was fixed with Carnoy (60% ethanol, 30% chloroform, 10% acetic acid) overnight at 4 C, afterwards incubated in 100 % ethanol overnight at 4 C and embedded in
Toluidin-Staining of mast cells Ear tissue was fixed with Carnoy (60% ethanol, 30% chloroform, 10% acetic acid) overnight at 4 C, afterwards incubated in 100 % ethanol overnight at 4 C and embedded in
Supplemental Information. Tissue Myeloid Progenitors Differentiate. into Pericytes through TGF-b Signaling. in Developing Skin Vasculature
 Cell Reports, Volume 18 Supplemental Information Tissue Myeloid Progenitors Differentiate into Pericytes through TGF-b Signaling in Developing Skin Vasculature Tomoko Yamazaki, Ani Nalbandian, Yutaka Uchida,
Supplementary Figures
 Supplementary Figures Supplementary Fig. 1. Galectin-3 is present within tumors. (A) mrna expression levels of Lgals3 (galectin-3) and Lgals8 (galectin-8) in the four classes of cell lines as determined
Supplementary Figures
 Supplementary Figures Supplementary Figure 1 DOT1L regulates the expression of epithelial and mesenchymal markers. (a) The expression levels and cellular localizations of EMT markers were confirmed by
Morphology Case Study. Presented by Niamh O Donnell, BSc, MSc. Medical Scientist Haematology Laboratory Cork University Hospital
 Morphology Case Study Presented by Niamh O Donnell, BSc, MSc. Medical Scientist Haematology Laboratory Cork University Hospital 41 year old male presented to GP for routine check-up in May 2011. FBC Results:
CLINICAL USE OF CELLULAR SUBPOPULATION ANALYSIS IN BM
 CLINICAL USE OF CELLULAR SUBPOPULATION ANALYSIS IN BM CANCER RESEARCH CENTRE, UNIVERSITY AND UNIVERSITY HOSPITAL OF SALAMANCA (SPAIN)( Sao Paulo, 18th of April, 2009 IDENTIFICATION OF HPC (I) 1.- In vivo
SUPPLEMENTARY INFORMATION
 doi: 10.1038/nature05883 SUPPLEMENTARY INFORMATION Supplemental Figure 1 Prostaglandin agonists and antagonists alter runx1/cmyb expression. a-e, Embryos were exposed to (b) PGE2 and (c) PGI2 (20μM) and
Supplementary Figure 1 a
 Supplementary Figure 1 a b d c Supplementary Figure 1. Poor sensitivity for mutation detection using established single-cell RNA-sequencing methods. (a) Representative bioanalyzer trace showing expected
high percentage of treated patients, and may also stimulate other lineages (2-9). In rodents,
. In rodents,") Supplemental Results Lithium increases hematopoietic stem/progenitor cells Lithium increases circulating CD34 + stem cells (1) in humans, increases neutrophil count in a high percentage of treated patients,
Supplemental Results Lithium increases hematopoietic stem/progenitor cells Lithium increases circulating CD34 + stem cells (1) in humans, increases neutrophil count in a high percentage of treated patients,
Supplemental Materials
 Supplemental Materials Programmed death one homolog maintains the pool size of regulatory T cells by promoting their differentiation and stability Qi Wang 1, Jianwei He 1, Dallas B. Flies 2, Liqun Luo
Supplemental Figure 1. Protein L
 Supplemental Figure 1 Protein L m19delta T m1928z T Suppl. Fig 1. Expression of CAR: B6-derived T cells were transduced with m19delta (left) and m1928z (right) to generate CAR T cells and transduction
Hematology 101. Blanche P Alter, MD, MPH, FAAP Clinical Genetics Branch Division of Cancer Epidemiology and Genetics Bethesda, MD
 Hematology 101 Blanche P Alter, MD, MPH, FAAP Clinical Genetics Branch Division of Cancer Epidemiology and Genetics Bethesda, MD Hematocrits Plasma White cells Red cells Normal, Hemorrhage, IDA, Leukemia,
Pathologic Stage. Lymph node Stage
 ASC ASC a c Patient ID BMI Age Gleason score Non-obese PBMC 1 22.1 81 6 (3+3) PBMC 2 21.9 6 6 (3+3) PBMC 3 22 84 8 (4+4) PBMC 4 24.6 68 7 (3+4) PBMC 24. 6 (3+3) PBMC 6 24.7 73 7 (3+4) PBMC 7 23. 67 7 (3+4)
Supplemental Information. Genomic Characterization of Murine. Monocytes Reveals C/EBPb Transcription. Factor Dependence of Ly6C Cells
 Immunity, Volume 46 Supplemental Information Genomic Characterization of Murine Monocytes Reveals C/EBPb Transcription Factor Dependence of Ly6C Cells Alexander Mildner, Jörg Schönheit, Amir Giladi, Eyal
and follicular helper T cells is Egr2-dependent. (a) Diagrammatic representation of the
 Diagrammatic representation of the") Supplementary Figure 1. LAG3 + Treg-mediated regulation of germinal center B cells and follicular helper T cells is Egr2-dependent. (a) Diagrammatic representation of the experimental protocol for the
Supplementary Figure 1. LAG3 + Treg-mediated regulation of germinal center B cells and follicular helper T cells is Egr2-dependent. (a) Diagrammatic representation of the experimental protocol for the
SUPPLEMENTARY INFORMATION
 doi:10.1038/nature12215 Supplementary Figure 1. The effects of full and dissociated GR agonists in supporting BFU-E self-renewal divisions. BFU-Es were cultured in self-renewal medium with indicated GR
The BCR-ABL1 fusion. Epidemiology. At the center of advances in hematology and molecular medicine
 At the center of advances in hematology and molecular medicine Philadelphia chromosome-positive chronic myeloid leukemia Robert E. Richard MD PhD rrichard@uw.edu robert.richard@va.gov Philadelphia chromosome
PREPARED FOR: U.S. Army Medical Research and Materiel Command Fort Detrick, Maryland
 AD Award Number: W81XWH-13-1-0057 TITLE: Role of TIRAP in Myelodysplastic Syndromes PRINCIPAL INVESTIGATOR: Linda Ya-ting Chang CONTRACTING ORGANIZATION: British Columbia Cancer Agency Branch Vancouver,
NOTE: This table will be discontinued after this lot.
 AS037-011 Rev. 11/14 ASSAY VALUES AND EXPECTED RANGES QCP DATA MONTHS: DEC, JAN, FEB Beckman Coulter STKS / MAXM / HMX LEVEL 1 + Lot No.: Exp. Date: LOT 871086 Parameter Mean Range WBC 10 3 /µl 4.0 ± 0.6
ACCME/Disclosures 4/13/2016. Clinical History
 ACCME/Disclosures The USCAP requires that anyone in a position to influence or control the content of CME disclose any relevant financial relationship WITH COMMERCIAL INTERESTS which they or their spouse/partner
ONLINE SUPPLEMENT MATERIAL. CD70 limits atherosclerosis and promotes macrophage function.
 ONLINE SUPPLEMENT MATERIAL CD7 limits atherosclerosis and promotes macrophage function. Holger Winkels* 1,2, Svenja Meiler* 1,2, Esther Smeets* 2, Dirk Lievens 1, David Engel 3, Charlotte Spitz 1, Christina
Full Blood Count analysis Is a 3 part-diff good enough? Dr Marion Münster, Sysmex South Africa
 Full Blood Count analysis Is a 3 part-diff good enough? Dr Marion Münster, Sysmex South Africa The Role of the FBC in clinical decision making History Examination Investigations Decision 70% FBC Laboratory
B220 CD4 CD8. Figure 1. Confocal Image of Sensitized HLN. Representative image of a sensitized HLN
 B220 CD4 CD8 Natarajan et al., unpublished data Figure 1. Confocal Image of Sensitized HLN. Representative image of a sensitized HLN showing B cell follicles and T cell areas. 20 µm thick. Image of magnification
Nature Medicine: doi: /nm.2109
 HIV 1 Infects Multipotent Progenitor Cells Causing Cell Death and Establishing Latent Cellular Reservoirs Christoph C. Carter, Adewunmi Onafuwa Nuga, Lucy A. M c Namara, James Riddell IV, Dale Bixby, Michael
Supplementary Figure 1. Efficient DC depletion in CD11c.DOG transgenic mice
 Supplementary Figure 1. Efficient DC depletion in CD11c.DOG transgenic mice (a) CD11c.DOG transgenic mice (tg) were treated with 8 ng/g body weight (b.w.) diphtheria toxin (DT) i.p. on day -1 and every
The Role of Rac Signaling in The Perivascular Niche
 The Role of Rac Signaling in The Perivascular Niche Felicia Ciuculescu Diaspora and Higher Education and Research Perspectives in Personalized Medicine- from Concept to Clinical Application Center for
Targeting methyltransferase PRMT5 eliminates leukemia stem cells in chronic myelogenous leukemia
 Targeting methyltransferase PRMT5 eliminates leukemia stem cells in chronic myelogenous leukemia Yanli Jin,, Ruibao Ren, Jingxuan Pan J Clin Invest. 2016;126(10):3961-3980. https://doi.org/10.1172/jci85239.
Supplementary Material
 Supplementary Material Taghon, Yui, and Rothenberg: Mast cell diversion of T-lineage precursor cells by the essential T-lineage transcription factor GATA Supplemental Table Supplemental Figures 1-6 Supplemental
L-selectin Is Essential for Delivery of Activated CD8 + T Cells to Virus-Infected Organs for Protective Immunity
 Cell Reports Supplemental Information L-selectin Is Essential for Delivery of Activated CD8 + T Cells to Virus-Infected Organs for Protective Immunity Rebar N. Mohammed, H. Angharad Watson, Miriam Vigar,