pplementary Figur Supplementary Figure 1. a.
|
|
|
- Johnathan Powers
- 5 years ago
- Views:
Transcription
1 pplementary Figur Supplementary Figure 1. a. Quantification by RT-qPCR of YFV-17D and YFV-17D pol- (+) RNA in the supernatant of cultured Huh7.5 cells following viral RNA electroporation of respective viruses over a four days course of infection (mean ± SD; n=3). b. Cytopathic effect observed in Huh7.5 four days following electroporation of YFV-17D and YFV-17D pol- RNA. c. Representative FACS plots of Huh7.5 electroporated with YFV-17D or YFV-17D pol- RNA and processed using the YFV RNA flow procedure at 36h post electroporation. Cells were stained with both the (+) and (-) YFV RNA probe set. Presence of cells electroporated with YFV-17D pol- and still harboring YFV RNA at 36h post infection is highlighted by a black circle.
2
3 Supplementary Figure 2. a. Clinical scoring of C57BL/6 mice (WT), stat1 loxp/loxp /Alb-cre and stat1 loxp/loxp /Vav-cre mice over the course of YFV-17D infection (n=5). b. Serum viremia over the course of infection (blood) and spleen viral load at day 11 post infection (spleen) of an additional cohort of C57BL/6 mice (WT) and stat1 loxp/loxp /Vav-cre mice infected with YFV-17D. (+) RNA copies per ml were quantified by RT-qPCR. Medians are shown for the spleen viral loads (n=3-6 per group; **p<0.01; Two-way ANOVA test). c. Protein concentration of a panel of 12 cytokines in the serum of WT (top) and stat1 loxp/loxp /Vav-cre (bottom) mice at days 0, 3, 7 and 11 following YFV-17D injection (mean ± SD; n=3). d-e. Frequency of peripheral NK cells (d) and B cells (e) over time following infection of WT (blue) and stat1 loxp/loxp /Vav-cre mice (red) with YFV-17D. Frequencies are expressed as percentage of total murine CD45+ cells (n=5 per group). Lines are linking the mean of each time point (n=5 per group; ****p<0.0001;two-way ANOVA test).
4
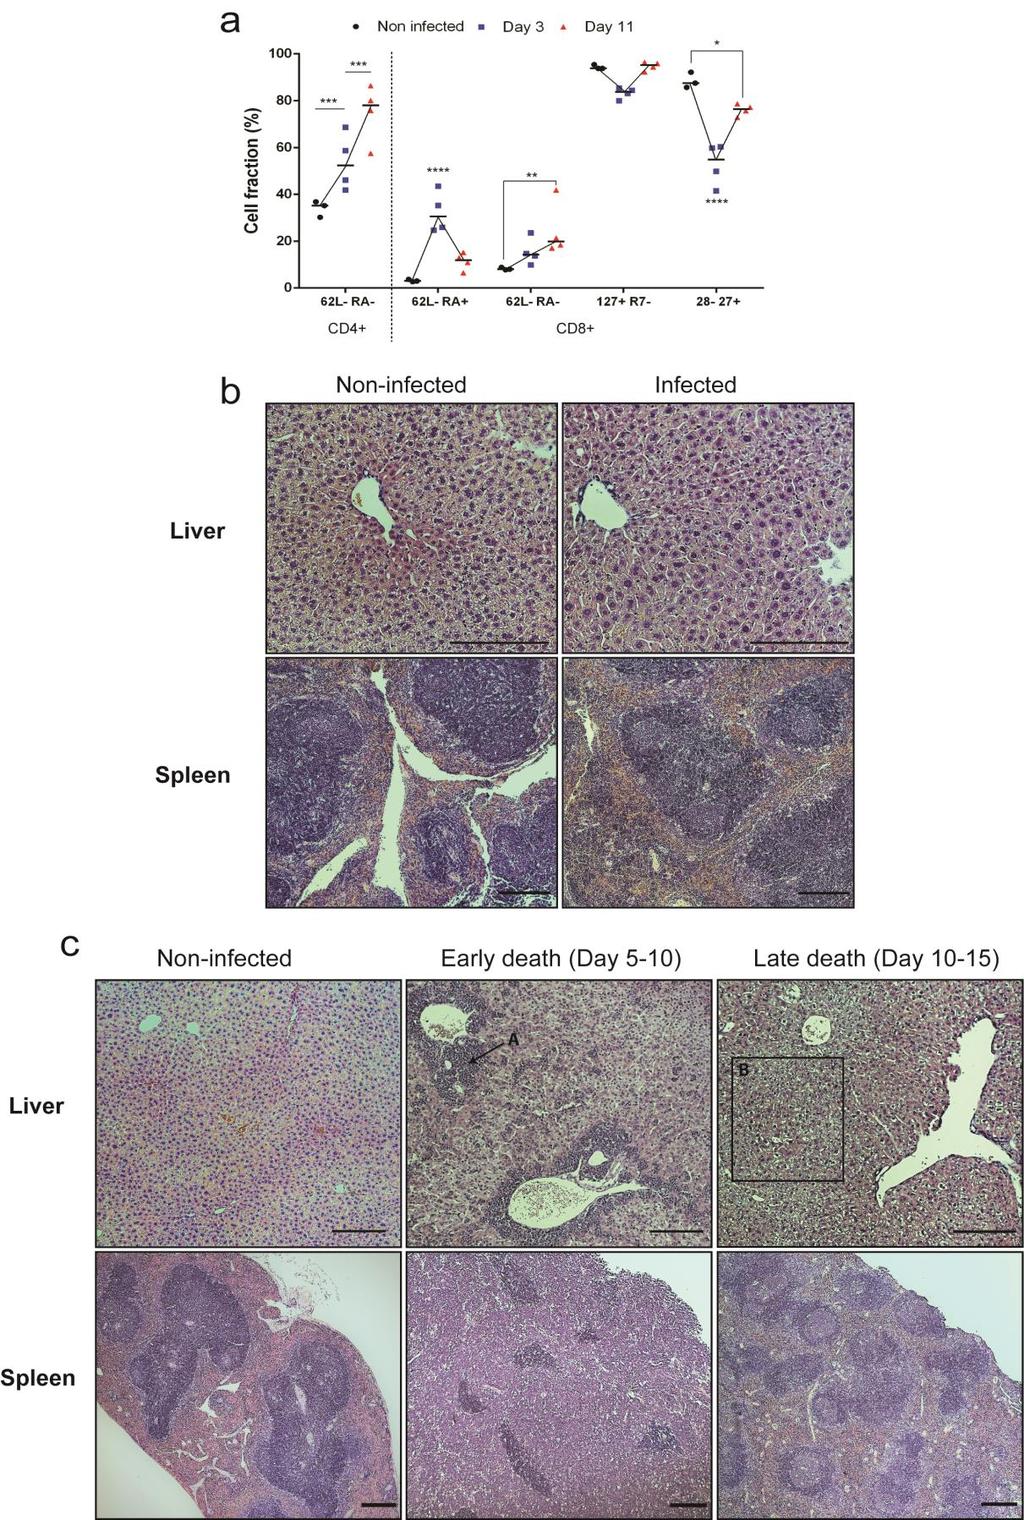
5 Supplementary Figure 3. a. Evolution of expression of CD62L, CD45RA, CD127, CCR7, CD27 and CD28 surface markers on spleen-resident CD3+CD4+ and CD3+CD8+ T cells isolated from non-infected or YFV-17D infected stat1 loxp/loxp /Vav-cre mice over the course of infection (days 3 and 11 post infection). Medians are shown and linked by a black line for each marker combination (n=3-4 per group; *p<0.5, **p<0.01, ***p<0.001, ****p<0.0001; Two-way ANOVA test). b. Hematoxylin and eosin staining of liver (20x magnification) and spleen (10x magnification) tissue sections from non-infected and YFV-17D infected WT mice (day 11 post infection). c. Hematoxylin and eosin staining of liver (10x magnification) and spleen (4X magnification) tissue sections from non-infected and YFV-17D infected stat1 loxp/loxp /Vav-cre mice experiencing early (day 3-5 post infection) or late death (day post infection). For each experimental condition (non-infected or infected) and tissue (Liver and Spleen), 6 tissue sections from three biological replicates (3 animals) were examined. Histopathological manifestations observed in infected animal tissues were abscent from all examined non-infected animals, and were representative of three biological replicate, for a given type of tissue. Scale bar (200µm) are indicated for each picture. A, severe portal inflammation; B, representative area displaying hydropic changes.
6
7 Supplementary Figure 4. a. Representative FACS plots displaying the frequencies of multiple peripheral (blood, top panel) or spleen-resident (spleen, bottom panel) immune cell subsets containing both (+) and (-) YFV-17D RNA following YFV-17D infection of WT and stat1 loxp/loxp /Vavcre mice. Frequencies from non-infected mice are also displayed. b. Enrichment efficiency of CD3+ CD8+ T cells from total blood of stat1 loxp/loxp /Vav-cre mice in a non-infected or infected setting. Frequencies before (pre-enrichment), after (post-enrichment) and of the flow-through are displayed. (mean ± SD; n=5). c. Enrichment in CD3+ CD8+ T cells of mrna coding for multiple cytokines and cytokine receptors. CD3+ CD8+ were isolated from non-infected and YFV-17D infected stat1 loxp/loxp /Vav-cre and the expression ratio for multiple cytokines and cytokine receptors between the CD8+ enriched fraction and flow-through was determined. Expression of each gene was normalized to HRPT1 expression prior to ratio calculation. (mean ± SD; n=5). d. Frequency of cells containing both (+) and (-) YFV RNA in multiple subsets of spleen-resident murine CD45+cells of stat1 loxp/loxp /Vav-cre mice (red) at days 3 and 11 post infection. (n=5-6 per group; **p<0.01, ***p<0.001, ****p<0.0001; Two-way ANOVA test). Tc, CD3+ T cells; Th, CD4+ T cells; CTL, CD8+ T cells; B-lym, CD19+ B cells; CD11b+, CD3- CD19- CD11b+ cells; cdc, CD3- CD19- CD11c+ conventional dendritic cells; MPH, CD3- CD19- CD11b+ F4/80+ macrophages; NK, CD3- CD19- CD161+ NK cells. Details in population gating are described in materials and methods.
8 Supplementary Figure 5. Immune system reconstitution in NRG-HIS (a, n=82.) and NRG-MIS (b, n=9) mice. Frequency of each cell fraction is shown as percentage of CD45+ cells, with the exception of Th and CTL, which are displayed as a percentage of CD3+ T cells. Medians are shown for each cell subset frequency. In panel b, the immune cell subset frequencies of NRG-MIS (blue), C57BL/6- egfp (red) and C57BL/6 (green) are shown. For each mouse strain, the CD45+ cell population analyzed is circled (CD45+ GFP+ cells or CD45+ GFP- cells). T-lym, CD3+ T cells; Th, CD3+ CD4+ T cells; CTL, CD3+ CD8+ T cells; cdc, CD11c+ conventional dendritic cells; B-lym, CD19+ B cells; Human MN, human CD14+ monocytes; Murine MPH, murine CD11b+ F4/80+ macrophages; Human NK/NKT, human CD56+ NK/NKT cells; Murine NK, murine CD161+ NK cells. Details in population gating are described in materials and methods.
9
10 Supplementary Figure 6. a. Body temperature variation in NRG, NRG-HIS and NRG-MIS mice over the course of YFV-17D infection (Min to Max box and whiskers NRG and NRG-HIS, n=6 per group; NRG-MIS, n=4). b. Protein concentration of a panel of 13 human cytokines in the serum of NRG-HIS mice at days 0, 3 and 11 following YFV-17D infection. Cytokine concentrations of IFNγ and IL-18 in the serum of each NRG-HIS mice (NRG-HIS #1-3) over the course of infection are also shown. Dotted lines represent the cytokine concentration prior to infection for each animal. (mean ± SD; n=3). c. Total human and murine PBMCs of NRG-HIS mice were stained with anti-mouse CD45+ only (left), with anti-mouse CD45+ in combination with anti-human CD45+ (middle) or in combination with a human probe targeting RPL13 mrna (right). Data are representative of three experiments. d. Serum viremia of NRG-HIS mice (red) used for YFV RNA flow at days 3 and 11 post infection. Serum viremia is compared to one of the non-engrafted NRG mice (blue) at similar time points. (+) RNA copies per ml of tissues were quantified by RT-qPCR. Medians are shown (n=5-6 per group; **p<0.01, ***p<0.001; Two-way ANOVA test).
11
12 Supplementary Figure 7. a. Representative FACS plots displaying the frequencies of selected peripheral immune cell subsets containing both (+) and (-) YFV-17D RNA following YFV-17D infection of NRG-HIS mice. Frequencies from non-infected mice are also displayed. b. Frequency of cells containing both (+) and (-) YFV-17D RNA in five selected peripheral immune cell subsets isolated from the blood of stat1 loxp/loxp /Vav-cre mice and NRG-HIS mice at day 11 post infection. All frequencies were normalized to frequencies determined prior to infection for each animal (n=3-6 per group; *p<0.05, ****p<0.0001; Two-way ANOVA test). c. Frequency of cells containing both (+) and (-) YFV-17D RNA from five selected spleen-resident immune cell subsets isolated from the spleen of stat1 loxp/loxp /Vav-cre mice and NRG-HIS mice at day 3 post infection. Frequencies of YFV RNA-bearing cells were normalized to background staining in the equivalent cell populations in spleens of non-infected animals. Representative FACS plots displaying the frequencies of spleen-resident pdcs containing both (+) and (-) YFV-17D RNA following YFV-17D infection of NRG-HIS mice are shown at the right of the panel. Frequencies from non-infected mice are also displayed. (n=3-6 per group; ***p<0.001, ****p<0.0001; Twoway ANOVA test). d. Representative FACS plots displaying the frequencies of selected spleenresident immune cell subsets containing both (+) and (-) YFV-17D RNA at day 11 post infection following YFV-17D infection of NRG-HIS mice. Frequencies from non-infected mice are also displayed. Tc, CD3+ T cells; B-lym, CD19+ B cells; cdc, CD3- CD19- CD11c+ conventional dendritic cells; pdcs, CD3- CD19- CD123+ plasmacytoid dendritic cells; MPH, CD68+ macrophages; NK, CD3- CD19- CD56+ NK cells.
13 Serologic parameters Cell tropism Evolution and persistence of cell associated virus in periphery Immunological parameters WT stat1 loxp/loxp /Vav-cre NRG-HIS Viremia Low/N.D. Severe viremia at day 3, followed by a drop toward viral clearance Persistence over time Cytokine Low/N.D. Peak at day 3 of pro-inflammatory cytokine IL-18, IFNγ General profile Large tropism Large tropism Restricted tropism T cells Spleen only Increased permissiveness in periphery N.D. NK cells Spleen mainly Increased permissiveness in spleen Spleen, minor B cells Spleen only Increased permissiveness in spleen Spleen and periphery MPH Spleen and periphery Increased permissiveness in periphery Spleen and periphery cdc Spleen, minor Increased permissiveness in periphery Spleen, minor pdc - - Spleen and periphery In periphery Very low/n.d. Peak and clearance In spleen Evolution of T cell frequency in periphery Presence of activated T cells in spleen Maintenance Maintenance with increased replication in NK cells and B cells Peak at day 3 and persistence Slow increase over time Stable Drop and strong increase Stable Yes Yes; More Tem T cells Yes Supplementary table 1. Cellular, immunological and serological features characterizing YFV-17D infection in WT mice, stat1 loxp/loxp /Vav-cre mice and NRG-HIS mice. In the cell tropism section, compartments (Periphery and/or Spleen) where each cell subsets is found to be permissive for YFV-17D replication is indicated. When the cell subset is a minor target in a specific compartment, the compartment is followed by minor. MPH, macrophages; cdc, conventional dendritic cells; pdc, plasmacytoid dendritic cells; Tem, effector memory T cells. N.D., non-detected; -, undetermined.
14 YFV-17D sense 1 YFV-17D sense 2 YFV-17D antisense 1 YFV-17D antisense 2 YFV-17D probe Mouse HPRT1 sense Mouse HPRT1 antisense Mouse IL-12R sense Mouse IL-12R antisense Mouse TNF-α sense Mouse TNF-α antisense Mouse KC sense Mouse KC antisense Mouse MCP-1 sense Mouse MCP-1 antisense Mouse IP-10 sense Mouse IP-10 antisense Mouse IL-6 sense Mouse IL-6 antisense Mouse IFNβ sense Mouse IFNβ antisense Mouse IL-33 sense Mouse IL-33 antisense Mouse GM-CSF sense Mouse GM-CSF antisense Vav-cre genotyping sense Vav-cre genotyping antisense Vav-cre genotyping probe Alb-cre genotyping sense Alb-cre genotyping antisense Albv-cre genotyping probe GCTAATTGAGGTGCATTGGTCTGC GCTAATTGAGGTGTATTGGTCTGC CTGCTAATCGCTCAACGAACG CTGCTAATCGCTCAAAGAACG ATCGAGTTGCTAGGCAATAAACAC CCTGGCGTCGTGATTAGTGAT AGACGTTCAGTCCTGTCCATAA ATGGCTGCTGCGTTGAGAA AGCACTCATAGTCTGTCTTGGA CCCTCACACTCAGATCATCTTCT GCTACGACGTGGGCTACAG CTGGGATTCACCTCAAGAACATC CAGGGTCAAGGCAAGCCTC TTAAAAACCTGGATCGGAACCAA GCATTAGCTTCAGATTTACGGGT CCAAGTGCTGCCGTCATTTTC GGCTCGCAGGGATGATTTCAA TAGTCCTTCCTACCCCAATTTCC TTGGTCCTTAGCCACTCCTTC CAGCTCCAAGAAAGGACGAAC GGCAGTGTAACTCTTCTGCAT TCCAACTCCAAGATTTCCCCG CATGCAGTAGACATGGCAGAA GGCCTTGGAAGCATGTAGAGG GGAGAACTCGTTAGAGACGACTT TCCTGGGCATTGCCTACAAC CTTCACTCTGATTCTGGCAATTTCG ACCCTGCTGCGCATTG GCGGTCTGGCAGTAAAAACTATC GTGAAACAGCATTGCTGTCACTT AAACATGCTTCATCGTCGGTCCGG Supplementary table 2. List of primers used in this study. Virus RNA strand targeted nucleotide sequence targeted Affymetrix Probe I.D. YFV-17D Positive strand (1753bp) VF YFV-17D Negative strand (929bp) / (840bp) VF Supplementary table 3. Information related to the vrna flow probes used in this study.
well for 2 h at rt. Each dot represents an individual mouse and bar is the mean ±
 Supplementary data: Control DC Blimp-1 ko DC 8 6 4 2-2 IL-1β p=.5 medium 8 6 4 2 IL-2 Medium p=.16 8 6 4 2 IL-6 medium p=.3 5 4 3 2 1-1 medium IL-1 n.s. 25 2 15 1 5 IL-12(p7) p=.15 5 IFNγ p=.65 4 3 2 1
% of live splenocytes. STAT5 deletion. (open shapes) % ROSA + % floxed
 % ROSA + % floxed") Supp. Figure 1. a 14 1 1 8 6 spleen cells (x1 6 ) 16 % of live splenocytes 5 4 3 1 % of live splenocytes 8 6 4 b 1 1 c % of CD11c + splenocytes (closed shapes) 8 6 4 8 6 4 % ROSA + (open shapes) % floxed
Supp. Figure 1. a 14 1 1 8 6 spleen cells (x1 6 ) 16 % of live splenocytes 5 4 3 1 % of live splenocytes 8 6 4 b 1 1 c % of CD11c + splenocytes (closed shapes) 8 6 4 8 6 4 % ROSA + (open shapes) % floxed
Supplementary Figure 1: TSLP receptor skin expression in dcssc. A: Healthy control (HC) skin with TSLP receptor expression in brown (10x
 skin with TSLP receptor expression in brown (10x") Supplementary Figure 1: TSLP receptor skin expression in dcssc. A: Healthy control (HC) skin with TSLP receptor expression in brown (10x magnification). B: Second HC skin stained for TSLP receptor in brown
Supplementary Figure 1: TSLP receptor skin expression in dcssc. A: Healthy control (HC) skin with TSLP receptor expression in brown (10x magnification). B: Second HC skin stained for TSLP receptor in brown
Supplementary Figure 1. Characterization of basophils after reconstitution of SCID mice
 Supplementary figure legends Supplementary Figure 1. Characterization of after reconstitution of SCID mice with CD4 + CD62L + T cells. (A-C) SCID mice (n = 6 / group) were reconstituted with 2 x 1 6 CD4
Suppl Video: Tumor cells (green) and monocytes (white) are seeded on a confluent endothelial
 and monocytes (white) are seeded on a confluent endothelial") Supplementary Information Häuselmann et al. Monocyte induction of E-selectin-mediated endothelial activation releases VE-cadherin junctions to promote tumor cell extravasation in the metastasis cascade
Supplementary Information Häuselmann et al. Monocyte induction of E-selectin-mediated endothelial activation releases VE-cadherin junctions to promote tumor cell extravasation in the metastasis cascade
Supplementary Table 1 Clinicopathological characteristics of 35 patients with CRCs
 Supplementary Table Clinicopathological characteristics of 35 patients with CRCs Characteristics Type-A CRC Type-B CRC P value Sex Male / Female 9 / / 8.5 Age (years) Median (range) 6. (9 86) 6.5 (9 76).95
Supplementary Figure 1. Efficiency of Mll4 deletion and its effect on T cell populations in the periphery. Nature Immunology: doi: /ni.
 Supplementary Figure 1 Efficiency of Mll4 deletion and its effect on T cell populations in the periphery. Expression of Mll4 floxed alleles (16-19) in naive CD4 + T cells isolated from lymph nodes and
Supplemental Information. Checkpoint Blockade Immunotherapy. Induces Dynamic Changes. in PD-1 CD8 + Tumor-Infiltrating T Cells
 Immunity, Volume 50 Supplemental Information Checkpoint Blockade Immunotherapy Induces Dynamic Changes in PD-1 CD8 + Tumor-Infiltrating T Cells Sema Kurtulus, Asaf Madi, Giulia Escobar, Max Klapholz, Jackson
Supporting Information
 Supporting Information Desnues et al. 10.1073/pnas.1314121111 SI Materials and Methods Mice. Toll-like receptor (TLR)8 / and TLR9 / mice were generated as described previously (1, 2). TLR9 / mice were
Supplemental Information. Aryl Hydrocarbon Receptor Controls. Monocyte Differentiation. into Dendritic Cells versus Macrophages
 Immunity, Volume 47 Supplemental Information Aryl Hydrocarbon Receptor Controls Monocyte Differentiation into Dendritic Cells versus Macrophages Christel Goudot, Alice Coillard, Alexandra-Chloé Villani,
Supplementary Figure 1. NAFL enhanced immunity of other vaccines (a) An over-the-counter, hand-held non-ablative fractional laser (NAFL).
 An over-the-counter, hand-held non-ablative fractional laser (NAFL).") Supplementary Figure 1. NAFL enhanced immunity of other vaccines (a) An over-the-counter, hand-held non-ablative fractional laser (NAFL). (b) Depiction of a MTZ array generated by NAFL. (c-e) IgG production
Supplementary Figure 1. NAFL enhanced immunity of other vaccines (a) An over-the-counter, hand-held non-ablative fractional laser (NAFL). (b) Depiction of a MTZ array generated by NAFL. (c-e) IgG production
Supplementary Figure 1. mrna expression of chitinase and chitinase-like protein in splenic immune cells. Each splenic immune cell population was
 Supplementary Figure 1. mrna expression of chitinase and chitinase-like protein in splenic immune cells. Each splenic immune cell population was sorted by FACS. Surface markers for sorting were CD11c +
IL-34 is a tissue-restricted ligand of CSF1R required for the development of Langerhans cells and microglia
 Supplementary Figures IL-34 is a tissue-restricted ligand of CSF1R required for the development of Langerhans cells and microglia Yaming Wang, Kristy J. Szretter, William Vermi, Susan Gilfillan, Cristina
The encephalitogenicity of TH17 cells is dependent on IL-1- and IL-23- induced production of the cytokine GM-CSF
 CORRECTION NOTICE Nat.Immunol. 12, 568 575 (2011) The encephalitogenicity of TH17 cells is dependent on IL-1- and IL-23- induced production of the cytokine GM-CSF Mohamed El-Behi, Bogoljub Ciric, Hong
Supplementary information. The proton-sensing G protein-coupled receptor T-cell death-associated gene 8
 1 Supplementary information 2 3 The proton-sensing G protein-coupled receptor T-cell death-associated gene 8 4 (TDAG8) shows cardioprotective effects against myocardial infarction 5 Akiomi Nagasaka 1+,
Eosinophils are required. for the maintenance of plasma cells in the bone marrow
 Eosinophils are required for the maintenance of plasma cells in the bone marrow Van Trung Chu, Anja Fröhlich, Gudrun Steinhauser, Tobias Scheel, Toralf Roch, Simon Fillatreau, James J. Lee, Max Löhning
SUPPLEMENTARY FIGURE 1
 SUPPLEMENTARY FIGURE 1 A LN Cell count (1 ) 1 3 1 CD+ 1 1 CDL lo CD hi 1 CD+FoxP3+ 1 1 1 7 3 3 3 % of cells 9 7 7 % of cells CD+ 3 1 % of cells CDL lo CD hi 1 1 % of CD+ cells CD+FoxP3+ 3 1 % of CD+ T
Supplementary Figure 1: Hsp60 / IEC mice are embryonically lethal (A) Light microscopic pictures show mouse embryos at developmental stage E12.
 Light microscopic pictures show mouse embryos at developmental stage E12.") Supplementary Figure 1: Hsp60 / IEC mice are embryonically lethal (A) Light microscopic pictures show mouse embryos at developmental stage E12.5 and E13.5 prepared from uteri of dams and subsequently genotyped.
Supplementary Figure 1: Hsp60 / IEC mice are embryonically lethal (A) Light microscopic pictures show mouse embryos at developmental stage E12.5 and E13.5 prepared from uteri of dams and subsequently genotyped.
SUPPLEMENTARY INFORMATION
 doi:1.138/nature1554 a TNF-α + in CD4 + cells [%] 1 GF SPF 6 b IL-1 + in CD4 + cells [%] 5 4 3 2 1 Supplementary Figure 1. Effect of microbiota on cytokine profiles of T cells in GALT. Frequencies of TNF-α
Supplemental Figure 1. Signature gene expression in in vitro differentiated Th0, Th1, Th2, Th17 and Treg cells. (A) Naïve CD4 + T cells were cultured
 Naïve CD4 + T cells were cultured") Supplemental Figure 1. Signature gene expression in in vitro differentiated Th0, Th1, Th2, Th17 and Treg cells. (A) Naïve CD4 + T cells were cultured under Th0, Th1, Th2, Th17, and Treg conditions. mrna
Supplemental Figure 1. Signature gene expression in in vitro differentiated Th0, Th1, Th2, Th17 and Treg cells. (A) Naïve CD4 + T cells were cultured under Th0, Th1, Th2, Th17, and Treg conditions. mrna
The autoimmune disease-associated PTPN22 variant promotes calpain-mediated Lyp/Pep
 SUPPLEMENTARY INFORMATION The autoimmune disease-associated PTPN22 variant promotes calpain-mediated Lyp/Pep degradation associated with lymphocyte and dendritic cell hyperresponsiveness Jinyi Zhang, Naima
Nature Medicine: doi: /nm.4322
 1 2 3 4 5 6 7 8 9 10 11 Supplementary Figure 1. Predicted RNA structure of 3 UTR and sequence alignment of deleted nucleotides. (a) Predicted RNA secondary structure of ZIKV 3 UTR. The stem-loop structure
Supporting Information
 Supporting Information Aldridge et al. 10.1073/pnas.0900655106 Fig. S1. Flow diagram of sublethal (a) and lethal (b) influenza virus infections. (a) Infection of lung epithelial cells by influenza virus
SUPPLEMENTARY INFORMATION
 doi:10.1038/nature10134 Supplementary Figure 1. Anti-inflammatory activity of sfc. a, Autoantibody immune complexes crosslink activating Fc receptors, promoting activation of macrophages, and WWW.NATURE.COM/NATURE
SUPPLEMENTAL INFORMATIONS
 1 SUPPLEMENTAL INFORMATIONS Figure S1 Cumulative ZIKV production by testis explants over a 9 day-culture period. Viral titer values presented in Figure 1B (viral release over a 3 day-culture period measured
Supplementary Fig. 1. Delivery of mirnas via Red Fluorescent Protein.
 prfp-vector RFP Exon1 Intron RFP Exon2 prfp-mir-124 mir-93/124 RFP Exon1 Intron RFP Exon2 Untransfected prfp-vector prfp-mir-93 prfp-mir-124 Supplementary Fig. 1. Delivery of mirnas via Red Fluorescent
Generation of ST2-GFP reporter mice and characterization of ILC1 cells following infection
 Supplementary Figure 1 Generation of ST2-GFP reporter mice and characterization of ILC1 cells following infection with influenza virus. (a) ST2-GFP reporter mice were generated as described in Methods.
Supplementary Information Epigenetic modulation of inflammation and synaptic plasticity promotes resilience against stress in mice
 Supplementary Information Epigenetic modulation of inflammation and synaptic plasticity promotes resilience against stress in mice Wang et. al. IL-6 in plasma (pg/ml) Rac1/HPRT (% of control) PSD9/HPRT
Comprehensive evaluation of human immune system reconstitution in NSG. and NSG -SGM3 mouse models toward the development of a novel ONCO-HU
 Comprehensive evaluation of human immune system reconstitution in NSG and NSG -SGM3 mouse models toward the development of a novel ONCO-HU xenograft model Aaron Middlebrook, 1 Eileen Snowden, 2 Warren
Nature Immunology: doi: /ni Supplementary Figure 1. Gene expression profile of CD4 + T cells and CTL responses in Bcl6-deficient mice.
 Supplementary Figure 1 Gene expression profile of CD4 + T cells and CTL responses in Bcl6-deficient mice. (a) Gene expression profile in the resting CD4 + T cells were analyzed by an Affymetrix microarray
SUPPLEMENTARY FIGURE LEGENDS
 SUPPLEMENTARY FIGURE LEGENDS Supplementary Figure 1. Hippocampal sections from new-born Pten+/+ and PtenFV/FV pups were stained with haematoxylin and eosin (H&E) and were imaged at (a) low and (b) high
Pathologic Stage. Lymph node Stage
 ASC ASC a c Patient ID BMI Age Gleason score Non-obese PBMC 1 22.1 81 6 (3+3) PBMC 2 21.9 6 6 (3+3) PBMC 3 22 84 8 (4+4) PBMC 4 24.6 68 7 (3+4) PBMC 24. 6 (3+3) PBMC 6 24.7 73 7 (3+4) PBMC 7 23. 67 7 (3+4)
Appendix Figure S1 A B C D E F G H
 ppendix Figure S1 C D E F G H ppendix Figure S1. RT and chemotherapy alter PD-L1 expression in PDC cells. Flow cytometric analysis of PD-L1 expression in () KPC and () Pan02 cells following treatment with
IMO-8400, a novel TLR7, TLR8 and TLR9 antagonist, psoriasis
 IMO-8400, a novel TLR7, TLR8 and TLR9 antagonist, inhibits disease development in mouse models of psoriasis Weiwen e Ja Jiang, Fu-Gang Zhu, Dong Yu, Ekambar R. Kandimalla, a a, Nicola La Monica, and Sudhir
Supplementary Figure 1 Chemokine and chemokine receptor expression during muscle regeneration (a) Analysis of CR3CR1 mrna expression by real time-pcr
 Analysis of CR3CR1 mrna expression by real time-pcr") Supplementary Figure 1 Chemokine and chemokine receptor expression during muscle regeneration (a) Analysis of CR3CR1 mrna expression by real time-pcr at day 0, 1, 4, 10 and 21 post- muscle injury. (b)
Supplementary Figure 1 Chemokine and chemokine receptor expression during muscle regeneration (a) Analysis of CR3CR1 mrna expression by real time-pcr at day 0, 1, 4, 10 and 21 post- muscle injury. (b)
Supplemental Table 1: Demographics and characteristics of study participants. Male, n (%) 3 (20%) 6 (50%) Age, years [mean ± SD] 33.3 ± ± 9.
![Supplemental Table 1: Demographics and characteristics of study participants. Male, n (%) 3 (20%) 6 (50%) Age, years [mean ± SD] 33.3 ± ± 9.](/thumbs/90/103696086.jpg "Supplemental Table 1: Demographics and characteristics of study participants. Male, n (%) 3 (20%) 6 (50%) Age, years [mean ± SD] 33.3 ± ± 9.") SUPPLEMENTAL DATA Supplemental Table 1: Demographics and characteristics of study participants Lean (n=15) Obese (n=12) Male, n (%) 3 (20%) 6 (50%) Age, years [mean ± SD] 33.3 ± 9.5 44.8 ± 9.1 White, n
SUPPLEMENTAL DATA Supplemental Table 1: Demographics and characteristics of study participants Lean (n=15) Obese (n=12) Male, n (%) 3 (20%) 6 (50%) Age, years [mean ± SD] 33.3 ± 9.5 44.8 ± 9.1 White, n
Bezzi et al., Supplementary Figure 1 *** Nature Medicine: doi: /nm Pten pc-/- ;Zbtb7a pc-/- Pten pc-/- ;Pml pc-/- Pten pc-/- ;Trp53 pc-/-
 Gr-1 Gr-1 Gr-1 Bezzi et al., Supplementary Figure 1 a Gr1-CD11b 3 months Spleen T cells 3 months Spleen B cells 3 months Spleen Macrophages 3 months Spleen 15 4 8 6 c CD11b+/Gr1+ cells [%] 1 5 b T cells
SUPPLEMENTARY FIGURES
 SUPPLEMENTARY FIGURES Supplementary Figure 1: Chemokine receptor expression profiles of CCR6 + and CCR6 - CD4 + IL-17A +/ex and Treg cells. Quantitative PCR analysis of chemokine receptor transcript abundance
Supplemental Figure 1. IL-3 blockade with Fab CSL362 depletes plasmacytoid dendritic cells (pdcs), but not basophils, at higher doses.
, but not basophils, at higher doses.") Supplemental Figure 1. IL-3 blockade with Fab CSL362 depletes plasmacytoid dendritic cells (pdcs), but not basophils, at higher doses. Percentage of viable (A) pdcs (Sytox Blue-, Lin1-, HLADR+, BDCA2++)
Supplemental Figure 1. IL-3 blockade with Fab CSL362 depletes plasmacytoid dendritic cells (pdcs), but not basophils, at higher doses. Percentage of viable (A) pdcs (Sytox Blue-, Lin1-, HLADR+, BDCA2++)
SUPPLEMENTARY METHODS
 SUPPLEMENTARY METHODS Histological analysis. Colonic tissues were collected from 5 parts of the middle colon on day 7 after the start of DSS treatment, and then were cut into segments, fixed with 4% paraformaldehyde,
and follicular helper T cells is Egr2-dependent. (a) Diagrammatic representation of the
 Diagrammatic representation of the") Supplementary Figure 1. LAG3 + Treg-mediated regulation of germinal center B cells and follicular helper T cells is Egr2-dependent. (a) Diagrammatic representation of the experimental protocol for the
Supplementary Figure 1. LAG3 + Treg-mediated regulation of germinal center B cells and follicular helper T cells is Egr2-dependent. (a) Diagrammatic representation of the experimental protocol for the
SUPPLEMENTARY INFORMATION
 1. Supplementary Figures and Legends Supplementary Fig. 1. S1P-mediated transcriptional regulation of integrins expressed in OP/monocytoid cells. Real-time quantitative PCR analyses of mrna for two integrins,
Type of file: PDF Title of file for HTML: Supplementary Information Description: Supplementary Figures
 Type of file: PDF Title of file for HTML: Supplementary Information Description: Supplementary Figures Type of file: MOV Title of file for HTML: Supplementary Movie 1 Description: NLRP3 is moving along
Nature Immunology: doi: /ni Supplementary Figure 1. Huwe1 has high expression in HSCs and is necessary for quiescence.
 Supplementary Figure 1 Huwe1 has high expression in HSCs and is necessary for quiescence. (a) Heat map visualizing expression of genes with a known function in ubiquitin-mediated proteolysis (KEGG: Ubiquitin
Supplementary Materials for
 www.sciencemag.org/content/348/6241/aaa825/suppl/dc1 Supplementary Materials for A mucosal vaccine against Chlamydia trachomatis generates two waves of protective memory T cells Georg Stary,* Andrew Olive,
SUPPLEMENTARY INFORMATION
 doi: 1.138/nature89 IFN- (ng ml ) 5 4 3 1 Splenocytes NS IFN- (ng ml ) 6 4 Lymph node cells NS Nfkbiz / Nfkbiz / Nfkbiz / Nfkbiz / IL- (ng ml ) 3 1 Splenocytes IL- (ng ml ) 1 8 6 4 *** ** Lymph node cells
Supplementary Figures. T Cell Factor-1 initiates T helper 2 fate by inducing GATA-3 and repressing Interferon-γ
 Supplementary Figures T Cell Factor-1 initiates T helper 2 fate by inducing GATA-3 and repressing Interferon-γ Qing Yu, Archna Sharma, Sun Young Oh, Hyung-Geun Moon, M. Zulfiquer Hossain, Theresa M. Salay,
Supplementary Figure 1.
 Supplementary Figure 1. Female Pro-ins2 -/- mice at 5-6 weeks of age were either inoculated i.p. with a single dose of CVB4 (1x10 5 PFU/mouse) or PBS and treated with αgalcer or control vehicle. On day
Supplementary Figure 1. Prevalence of U539C and G540A nucleotide and E172K amino acid substitutions among H9N2 viruses. Full-length H9N2 NS
 Supplementary Figure 1. Prevalence of U539C and G540A nucleotide and E172K amino acid substitutions among H9N2 viruses. Full-length H9N2 NS nucleotide sequences (a, b) or amino acid sequences (c) from
Supplementary Figure 1. ETBF activate Stat3 in B6 and Min mice colons
 Supplementary Figure 1 ETBF activate Stat3 in B6 and Min mice colons a pstat3 controls Pos Neg ETBF 1 2 3 4 b pstat1 pstat2 pstat3 pstat4 pstat5 pstat6 Actin Figure Legend: (a) ETBF induce predominantly
Tbk1-TKO! DN cells (%)! 15! 10!
! 15! 10!") a! T Cells! TKO! B Cells! TKO! b! CD4! 8.9 85.2 3.4 2.88 CD8! Tbk1-TKO! 1.1 84.8 2.51 2.54 c! DN cells (%)! 4 3 2 1 DP cells (%)! 9 8 7 6 CD4 + SP cells (%)! 5 4 3 2 1 5 TKO! TKO! TKO! TKO! 15 1 5 CD8
a! T Cells! TKO! B Cells! TKO! b! CD4! 8.9 85.2 3.4 2.88 CD8! Tbk1-TKO! 1.1 84.8 2.51 2.54 c! DN cells (%)! 4 3 2 1 DP cells (%)! 9 8 7 6 CD4 + SP cells (%)! 5 4 3 2 1 5 TKO! TKO! TKO! TKO! 15 1 5 CD8
activation with anti-cd3/cd28 beads and 3d following transduction. Supplemental Figure 2 shows
 Supplemental Data Supplemental Figure 1 compares CXCR4 expression in untreated CD8 + T cells, following activation with anti-cd3/cd28 beads and 3d following transduction. Supplemental Figure 2 shows the
Supplementary Figures
 Supplementary Figures Supplementary Figure 1 Characterization of stable expression of GlucB and sshbira in the CT26 cell line (a) Live cell imaging of stable CT26 cells expressing green fluorescent protein
Supplementary Figure 1 IMQ-Induced Mouse Model of Psoriasis. IMQ cream was
 Supplementary Figure 1 IMQ-Induced Mouse Model of Psoriasis. IMQ cream was painted on the shaved back skin of CBL/J and BALB/c mice for consecutive days. (a, b) Phenotypic presentation of mouse back skin
L1 on PyMT tumor cells but Py117 cells are more responsive to IFN-γ. (A) Flow
 Flow") A MHCI B PD-L1 Fold expression 8 6 4 2 Fold expression 3 2 1 No tx 1Gy 2Gy IFN Py117 Py117 Supplementary Figure 1. Radiation and IFN-γ enhance MHCI expression and PD- L1 on PyMT tumor cells but Py117 cells
A MHCI B PD-L1 Fold expression 8 6 4 2 Fold expression 3 2 1 No tx 1Gy 2Gy IFN Py117 Py117 Supplementary Figure 1. Radiation and IFN-γ enhance MHCI expression and PD- L1 on PyMT tumor cells but Py117 cells
Supplementary Figure S1. PTPN2 levels are not altered in proliferating CD8+ T cells. Lymph node (LN) CD8+ T cells from C57BL/6 mice were stained with
 CD8+ T cells from C57BL/6 mice were stained with") Supplementary Figure S1. PTPN2 levels are not altered in proliferating CD8+ T cells. Lymph node (LN) CD8+ T cells from C57BL/6 mice were stained with CFSE and stimulated with plate-bound α-cd3ε (10µg/ml)
Supplementary Figure S1. PTPN2 levels are not altered in proliferating CD8+ T cells. Lymph node (LN) CD8+ T cells from C57BL/6 mice were stained with CFSE and stimulated with plate-bound α-cd3ε (10µg/ml)
Supplementary Figure 1. SC35M polymerase activity in the presence of Bat or SC35M NP encoded from the phw2000 rescue plasmid.
 1 2 3 4 5 6 7 8 9 10 11 12 13 14 15 16 17 18 19 20 21 22 23 24 25 26 27 Supplementary Figure 1. SC35M polymerase activity in the presence of Bat or SC35M NP encoded from the phw2000 rescue plasmid. HEK293T
Supplementary Figures for TSC1 controls macrophage polarization to prevent inflammatory disorder by Linnan Zhu et al
 Supplementary Figures for TSC1 controls macrophage polarization to prevent inflammatory disorder by Linnan Zhu et al Suppl. Fig. 1 Tissue DN C Proteins kd TSC1-17 TSC 1 loxp bp -48-285 ctin PEMs Neutrophils
Supplementary Figure 1
 d f a IL7 b IL GATA RORγt h HDM IL IL7 PBS Ilra R7 PBS HDM Ilra R7 HDM Foxp Foxp Ilra R7 HDM HDM Ilra R7 HDM. 9..79. CD + FOXP + T reg cell CD + FOXP T conv cell PBS Ilra R7 PBS HDM Ilra R7 HDM CD + FOXP
Nature Immunology: doi: /ni.3412
 Supplementary Figure 1 Gata1 expression in heamatopoietic stem and progenitor populations. (a) Unsupervised clustering according to 100 top variable genes across single pre-gm cells. The two main cell
Supplemental Figure 1
 Supplemental Figure 1 1a 1c PD-1 MFI fold change 6 5 4 3 2 1 IL-1α IL-2 IL-4 IL-6 IL-1 IL-12 IL-13 IL-15 IL-17 IL-18 IL-21 IL-23 IFN-α Mut Human PD-1 promoter SBE-D 5 -GTCTG- -1.2kb SBE-P -CAGAC- -1.kb
Supplementary Figure 1 IL-27 IL
 Tim-3 Supplementary Figure 1 Tc0 49.5 0.6 Tc1 63.5 0.84 Un 49.8 0.16 35.5 0.16 10 4 61.2 5.53 10 3 64.5 5.66 10 2 10 1 10 0 31 2.22 10 0 10 1 10 2 10 3 10 4 IL-10 28.2 1.69 IL-27 Supplementary Figure 1.
Supplementary Information. Tissue-wide immunity against Leishmania. through collective production of nitric oxide
 Supplementary Information Tissue-wide immunity against Leishmania through collective production of nitric oxide Romain Olekhnovitch, Bernhard Ryffel, Andreas J. Müller and Philippe Bousso Supplementary
Supplementary Figure 1. Nature Neuroscience: doi: /nn.4547
 Supplementary Figure 1 Characterization of the Microfetti mouse model. (a) Gating strategy for 8-color flow analysis of peripheral Ly-6C + monocytes from Microfetti mice 5-7 days after TAM treatment. Living
Chronic variable stress activates hematopoietic stem cells
 SUPPLEMENTARY INFORMATION Chronic variable stress activates hematopoietic stem cells Timo Heidt *, Hendrik B. Sager *, Gabriel Courties, Partha Dutta, Yoshiko Iwamoto, Alex Zaltsman, Constantin von zur
Nature Medicine: doi: /nm.2109
 HIV 1 Infects Multipotent Progenitor Cells Causing Cell Death and Establishing Latent Cellular Reservoirs Christoph C. Carter, Adewunmi Onafuwa Nuga, Lucy A. M c Namara, James Riddell IV, Dale Bixby, Michael
Supplementary Figure S1. Flow cytometric analysis of the expression of Thy1 in NH cells. Flow cytometric analysis of the expression of T1/ST2 and
 Supplementary Figure S1. Flow cytometric analysis of the expression of Thy1 in NH cells. Flow cytometric analysis of the expression of T1/ST2 and Thy1 in NH cells derived from the lungs of naïve mice.
Supplementary Figure 1. Immune profiles of untreated and PD-1 blockade resistant EGFR and Kras mouse lung tumors (a) Total lung weight of untreated
 Total lung weight of untreated") 1 Supplementary Figure 1. Immune profiles of untreated and PD-1 blockade resistant EGFR and Kras mouse lung tumors (a) Total lung weight of untreated (U) EGFR TL mice (n=7), Kras mice (n=7), PD-1 blockade
1 Supplementary Figure 1. Immune profiles of untreated and PD-1 blockade resistant EGFR and Kras mouse lung tumors (a) Total lung weight of untreated (U) EGFR TL mice (n=7), Kras mice (n=7), PD-1 blockade
Nature Immunology: doi: /ni Supplementary Figure 1. Cellularity of leukocytes and their progenitors in naive wild-type and Spp1 / mice.
 Supplementary Figure 1 Cellularity of leukocytes and their progenitors in naive wild-type and Spp1 / mice. (a, b) Gating strategies for differentiated cells including PMN (CD11b + Ly6G hi and CD11b + Ly6G
Hua Tang, Weiping Cao, Sudhir Pai Kasturi, Rajesh Ravindran, Helder I Nakaya, Kousik
 SUPPLEMENTARY FIGURES 1-19 T H 2 response to cysteine-proteases requires dendritic cell-basophil cooperation via ROS mediated signaling Hua Tang, Weiping Cao, Sudhir Pai Kasturi, Rajesh Ravindran, Helder
Supplemental Information. CD4 + CD25 + Foxp3 + Regulatory T Cells Promote. Th17 Cells In Vitro and Enhance Host Resistance
 Immunity, Volume 34 Supplemental Information D4 + D25 + + Regulatory T ells Promote Th17 ells In Vitro and Enhance Host Resistance in Mouse andida albicans Th17 ell Infection Model Pushpa Pandiyan, Heather
Supplementary Material
 Supplementary Material Supplementary Figure 1. NOS2 -/- mice develop an analogous Ghon complex after infection in the ear dermis and show dissemination of Mtb to the lung. (A) WT and NOS2 -/- mice were
Supplementary Figures
 Supplementary Figures Supplementary Figure 1. NKT ligand-loaded tumour antigen-presenting B cell- and monocyte-based vaccine induces NKT, NK and CD8 T cell responses. (A) The cytokine profiles of liver
sequences of a styx mutant reveals a T to A transversion in the donor splice site of intron 5
 sfigure 1 Styx mutant mice recapitulate the phenotype of SHIP -/- mice. (A) Analysis of the genomic sequences of a styx mutant reveals a T to A transversion in the donor splice site of intron 5 (GTAAC
GFP/Iba1/GFAP. Brain. Liver. Kidney. Lung. Hoechst/Iba1/TLR9!
 Supplementary information a +KA Relative expression d! Tlr9 5!! 5! NSC Neuron Astrocyte Microglia! 5! Tlr7!!!! NSC Neuron Astrocyte! GFP/Sβ/! Iba/Hoechst Microglia e Hoechst/Iba/TLR9! GFP/Iba/GFAP f Brain
Supplemental Materials for. Effects of sphingosine-1-phosphate receptor 1 phosphorylation in response to. FTY720 during neuroinflammation
 Supplemental Materials for Effects of sphingosine-1-phosphate receptor 1 phosphorylation in response to FTY7 during neuroinflammation This file includes: Supplemental Table 1. EAE clinical parameters of
Supplementary Fig. S1. Schematic diagram of minigenome segments.
 open reading frame 1565 (segment 5) 47 (-) 3 5 (+) 76 101 125 149 173 197 221 246 287 open reading frame 890 (segment 8) 60 (-) 3 5 (+) 172 Supplementary Fig. S1. Schematic diagram of minigenome segments.
Supplementary Figure 1
 Supplementary Figure 1 Identification of IFN-γ-producing CD8 + and CD4 + T cells with naive phenotype by alternative gating and sample-processing strategies. a. Contour 5% probability plots show definition
Targeting tumour associated macrophages in anti-cancer therapies. Annamaria Gal Seminar Series on Drug Discovery Budapest 5 January 2018
 Targeting tumour associated macrophages in anti-cancer therapies Annamaria Gal Seminar Series on Drug Discovery Budapest 5 January 2018 Macrophages: Professional phagocytes of the myeloid lineage APC,
Electron micrograph of phosphotungstanic acid-stained exosomes derived from murine
 1 SUPPLEMENTARY INFORMATION SUPPLEMENTARY FIGURES Supplementary Figure 1. Physical properties of murine DC-derived exosomes. a, Electron micrograph of phosphotungstanic acid-stained exosomes derived from
B220 CD4 CD8. Figure 1. Confocal Image of Sensitized HLN. Representative image of a sensitized HLN
 B220 CD4 CD8 Natarajan et al., unpublished data Figure 1. Confocal Image of Sensitized HLN. Representative image of a sensitized HLN showing B cell follicles and T cell areas. 20 µm thick. Image of magnification
IMMUNOLOGICAL MEMORY. CD4 T Follicular Helper Cells. Memory CD8 T Cell Differentiation
 IMMUNOLOGICAL MEMORY CD4 T Follicular Helper Cells Memory CD8 T Cell Differentiation CD4 T Cell Differentiation Bcl-6 T-bet GATA-3 ROR t Foxp3 CD4 T follicular helper (Tfh) cells FUNCTION Provide essential
ILC1 and ILC3 isolation and culture Following cell sorting, we confirmed that the recovered cells belonged to the ILC1, ILC2 and
 Supplementary Methods and isolation and culture Following cell sorting, we confirmed that the recovered cells belonged to the, ILC2 and subsets. For this purpose we performed intracellular flow cytometry
Supplemental Table S1
 Supplemental Table S. Tumorigenicity and metastatic potential of 44SQ cell subpopulations a Tumorigenicity b Average tumor volume (mm ) c Lung metastasis d CD high /4 8. 8/ CD low /4 6./ a Mice were injected
fl/+ KRas;Atg5 fl/+ KRas;Atg5 fl/fl KRas;Atg5 fl/fl KRas;Atg5 Supplementary Figure 1. Gene set enrichment analyses. (a) (b)
 (b)") KRas;At KRas;At KRas;At KRas;At a b Supplementary Figure 1. Gene set enrichment analyses. (a) GO gene sets (MSigDB v3. c5) enriched in KRas;Atg5 fl/+ as compared to KRas;Atg5 fl/fl tumors using gene set
KRas;At KRas;At KRas;At KRas;At a b Supplementary Figure 1. Gene set enrichment analyses. (a) GO gene sets (MSigDB v3. c5) enriched in KRas;Atg5 fl/+ as compared to KRas;Atg5 fl/fl tumors using gene set
ndln NK Cells (x10 3 ) Days post-infection (A/PR/8) *** *** *** Liver NK Cells (x10 4 ) Days post-infection (MCMV)
 Days post-infection (A/PR/8) *** *** *** Liver NK Cells (x10 4 ) Days post-infection (MCMV)") A mln NK Cells(x ) 6 1 * ndln NK Cells (x ) ns C Lung NK Cells(x ) 1 1 7 * D LN NK Cells (x ) 1 7 1 7 Days post-infection (A/PR/8) * * E Liver NK Cells (x ) 1 7 Days post-infection (A/PR/8) * * * 1 7 Days
A mln NK Cells(x ) 6 1 * ndln NK Cells (x ) ns C Lung NK Cells(x ) 1 1 7 * D LN NK Cells (x ) 1 7 1 7 Days post-infection (A/PR/8) * * E Liver NK Cells (x ) 1 7 Days post-infection (A/PR/8) * * * 1 7 Days
Dendritic cells in cancer immunotherapy Aimin Jiang
 Dendritic cells in cancer immunotherapy Aimin Jiang Feb. 11, 2014 Dendritic cells at the interface of innate and adaptive immune responses Dendritic cells: initiators of adaptive immune responses Dendritic
Supplementary Information
 Supplementary Information Distinct bone marrow-derived and tissue resident macrophage lineages proliferate at key stages during inflammation. 1 Luke C. Davies, 1 Marcela Rosas, 2 Stephen J. Jenkins, 1
Supporting Information
 Supporting Information Horwitz et al. 73/pnas.35295 A Copies ml - C 3NC7 7 697 698 7 7 73 76-2 2 Days Gp2 residue G458D G459D T278A 7/36 N28 K D 28 459 A28T ID# 697 ID# 698 ID# 7 ID# 7 ID# 73 ID# 76 ID#
Supplemental Information. Phase 1 Results of ZUMA-1: A Multicenter Study. of KTE-C19 Anti-CD19 CAR T Cell Therapy. in Refractory Aggressive Lymphoma
 YMTHE, Volume 25 Supplemental Information Phase 1 Results of ZUMA-1: A Multicenter Study of KTE-C19 Anti-CD19 CAR T Cell Therapy in Refractory Aggressive Lymphoma Frederick L. Locke, Sattva S. Neelapu,
Supplementary Figure 1: STAT3 suppresses Kras-induced lung tumorigenesis
 Supplementary Figure 1: STAT3 suppresses Kras-induced lung tumorigenesis (a) Immunohistochemical (IHC) analysis of tyrosine 705 phosphorylation status of STAT3 (P- STAT3) in tumors and stroma (all-time
SUPPLEMENTARY FIGURES
 SUPPLEMENTARY FIGURES 1 Supplementary Figure 1, Adult hippocampal QNPs and TAPs uniformly express REST a-b) Confocal images of adult hippocampal mouse sections showing GFAP (green), Sox2 (red), and REST
Figure SⅠ: Expression of mir-155, mir-122 and mir-196a in allografts compared with
 Figure SⅠ: Expression of mir-155, mir-122 and mir-196a in allografts compared with isografts (control) at the 2nd week, 4th and 8th week by RT-PCR. At the advanced stage, the expression of these three
a surface permeabilized
 a surface permeabilized RAW 64.7 P388D1 J774 b CD11b + Ly-6G - Blood Monocytes WT Supplementary Figure 1. Cell surface expression on macrophages and DCs. (a) RAW64.7, P388D1, and J774 cells were subjected
Peli1 negatively regulates T-cell activation and prevents autoimmunity
 Peli1 negatively regulates T-cell activation and prevents autoimmunity Mikyoung Chang 1,*, Wei Jin 1,5,*, Jae-Hoon Chang 1, Yi-chuan Xiao 1, George Brittain 1, Jiayi Yu 1, Xiaofei Zhou 1, Yi-Hong Wang
Supplemental Information. Regulatory T Cells Promote Macrophage. Efferocytosis during Inflammation Resolution
 Immunity, Volume 9 Supplemental Information Regulatory T Cells Promote Macrophage Efferocytosis during Inflammation Resolution Jonathan D. Proto, Amanda C. Doran, Galina Gusarova, Arif Yurdagul Jr., Erdi
Supplemental Figure 1. Western blot analysis indicated that MIF was detected in the fractions of
 Supplemental Figure Legends Supplemental Figure 1. Western blot analysis indicated that was detected in the fractions of plasma membrane and cytosol but not in nuclear fraction isolated from Pkd1 null
Supplementary Figure 1
 Combination index (CI) Supplementary Figure 1 2. 1.5 1. Ishikawa AN3CA Nou-1 Hec-18.5...2.4.6.8 1. Fraction affected (Fa) Supplementary Figure 1. The synergistic effect of PARP inhibitor and PI3K inhibitor
Table S1. Viral load and CD4 count of HIV-infected patient population
 Table S1. Viral load and CD4 count of HIV-infected patient population Subject ID Viral load (No. of copies per ml of plasma) CD4 count (No. of cells/µl of blood) 28 7, 14 29 7, 23 21 361,99 94 217 7, 11
Canberra, Australia). CD11c-DTR-OVA-GFP (B6.CD11c-OVA), B6.luc + and. Cancer Research Center, Germany). B6 or BALB/c.FoxP3-DTR-GFP mice were
. CD11c-DTR-OVA-GFP (B6.CD11c-OVA), B6.luc + and. Cancer Research Center, Germany). B6 or BALB/c.FoxP3-DTR-GFP mice were") Supplemental Materials and Methods Mice Female C57BL/6 (B6, I-E null, H-2 b ), BALB/c (H-2 d ) + ), FVB/N (H-2 q, I-E null, CD45.1 + ), and B6D2F1 (H-2 b/d ) mice were purchased from the Animal Resources
Supplemental Materials and Methods Mice Female C57BL/6 (B6, I-E null, H-2 b ), BALB/c (H-2 d ) + ), FVB/N (H-2 q, I-E null, CD45.1 + ), and B6D2F1 (H-2 b/d ) mice were purchased from the Animal Resources