Supplementary Information
|
|
|
- Hilda Ray
- 5 years ago
- Views:
Transcription
1 Supplementary Information Lin28 Enhances Tumorigenesis and is Associated With Advanced Human Malignancies Srinivas R. Viswanathan 1, John T. Powers 1, William Einhorn 1, Yujin Hoshida 2,5, Tony Ng 15, Sara Toffanin 8,9, Maureen O'Sullivan 16, Jun Lu 2,3,5, Letha A. Philips 13, Victoria L. Lockhart 12, Samar P. Shah 1, Pradeep S. Tanwar 7, Craig H. Mermel 5, Rameen Beroukhim 5, Mohammad Azam 1, Jose Teixeira 7, Matthew Meyerson, Timothy P. Hughes 14, Josep M Llovet 8,10,11, Jerald Radich 12, Charles G. Mullighan 13, Todd R. Golub 2,5, Poul H. Sorensen 15 and George Q. Daley 1,2,3,4 * * To Whom Correspondence should be Addressed: George Daley Phone: (617) Fax: (617) george.daley@childrens.harvard.edu
 are decreased.")
2 Figure S1. Lin28 Enhances Transformation of NIH-3T3 Cells. (A) Soft agar colonies for 25,000 NIH/3T3 cells infected with pmscv.neo/pbabe.puro, pmscv.neo.lin28/pbabe.puro, or pmscv.neo.lin28/pbabe.puro.7s21l, selected with Puromycin and G418. Colonies were counted after 4 weeks with five random fields counted per well. In the 7S21L rescue condition, both colony number and size (arrows) are decreased. (B) NIH-3T3 cells were infected with pbabe.puro, pbabe.puro.lin28 or pbabe.purolin28b, selected on Puromycin, and 2 x 10 6 cells were injected subcutaneously into the flank of Balb/c nude mice. (C) H&E staining of tumors formed by NIH-3T3 cells expressing either Lin28 or LIN28B. T, tumor cells; M, host muscle tissue; A, host adipose tissue. (D) Soft agar colonies for 25,000 NIH/3T3 cells infected with pbabe.puro.bcr-abl. Cells were initially infected with either pmscv.neo/pbabe.puro, pmscv.neo.lin28/pbabe.puro or pmscv.neo.lin28/pbabe.puro.7s21l, and selected with Puromycin and G418. Colonies were counted after 3 weeks with five random fields counted per well. In the BCR-ABL + Lin28 condition, both colony number and size (arrows) are increased over BCR-ABL alone.
 Levels of mature mir species in representative infection determined by quantitative PCR of LKR cells infected with pbabe.puro or pbabe.puro.lin28, and selected with Puromycin.")
3 Figure S2. Lin28 enhances transformation of LKR cells. (A) Western blot analysis performed on LKR cells infected with pbabe.puro or pbabe.puro.lin28, and selected on Puromycin. (B) Levels of mature mir species in representative infection determined by quantitative PCR of LKR cells infected with pbabe.puro or pbabe.puro.lin28, and selected with Puromycin. (C) Proliferation of LKR cells infected with pbabe.puro, pbabe.puro.lin28, or pmscv.neo.let-7g, and selected with Puromycin or G418, plated at 5000 cells per well and assayed over indicated time period. Cell counts are plotted as mean +/- S.E.M., n=3. (D) Representative plate from colony formation assay (n=3) of LKR cells infected with pbabe.puro or pbabe.puro.lin28, selected on Puromycin, and plated at 2000 cells per 10 cm dish. Colonies were stained with crystal violet and counted after 5d of growth.
4 Figure S3. LIN28 expression in human cancer cell lines. (A) Human cancer cell lines expressing LIN28, as determined by microarray analysis on over 527 cell lines. Signal intensity was normalized to signal in HeLa cells, which do not express LIN28 by qpcr. (B) Microarray data on human cancer cell lines in the NCI-60 panel interrogated for either LIN28 (blue) or LIN28B (red) expression.

5 Figure S4. Analysis of LIN28 expression in a panel of human tumors. LIN28 expression in human tumors as detected by immunohistochemistry on a tumor tissue microarray. LIN28 expression in selected tumor samples is shown. LIN28 expression for all samples on the tissue microarray is catalogued in Table S1.
6 Figure S5. HMGA2 Expression in CML. (A) Gene expression data (GSE4170, published microarray dataset) from patients in either chronic phase (green), accelerated phase (yellow), or blast crisis (red) of CML was investigated for levels of LIN28B(white) or HMGA2 (black) expression. LIN28 was not on the array. (B) scatterplot of relative HMGA2 and LIN28B levels in patients in CML-CP (top) or CML-BC (bottom) CML. (C) Samples were classified based on low (< 0.5 log 10 N units relative to CP) or high (> 0.5 log 10 N units relative to BC) HMGA2 or LIN28B expression. p=0.0173, Fisher s exact test.
7 Figure S6. LIN28B Knockdown Impairs Growth of Lama-84 Cells. (A) Cell proliferation of Lama-84 cells infected with plko.controlshrna or plko.lin28bshrna, selected on Puromycin, and seeded at cells per well. Results are plotted as average cell number per well +/- S.E.M. N=3.
8 Figure S7. LIN28B is required for the growth of H1299 lung adenocarcinoma cells. (A) Human cancer cells expressing LIN28B as determined by quantitative PCR. Expression levels were normalized to HeLa cells. (B) LIN28B expression measured by quantitative PCR in H1299 cells infected with plko.controlshrna or plko.lin28bshrna, and selected on Puromycin. (C) Levels of mature mir species in representative infection determined by quantitative PCR of H1299 cells infected with plko.controlshrna or plko.lin28bshrna, and selected with Puromycin (D) Western blot analysis on whole cell extracts from H1299 cells infected with plko.controlshrna or plko.lin28bshrna and selected in Puromycin (E) Proliferation of H1299 cells infected with plko.controlshrna or plko.lin28bshrna and seeded at 2500 cells per well. Cells were counted over time and results are plotted as mean +/- S.E.M., n=3. (F) Colony formation of H1299 cells infected with plko.controlshrna or plko.lin28bshrna, selected on Puromycin, and plated at 2000 cells per 10 cm dish. After 7d of growth, colonies were stained with crystal violet. (G) Quantitation of colony number from colony forming assay. Results are plotted as average number of colonies per plate +/- S.E.M., N=3. (H) H1299 cells were infected with plko.controlshrna or plko.lin28bshrna, stained with Annexin-PE and 7-AAD, and percentage of total Annexin positive cells for each condition was quantitated. Results are plotted as average number of Annexin positive cells +/- S.E.M., N=3.

9 Figure S8. LIN28/LIN28B are overexpressed in late stage Wilms Tumors. LIN28 and LIN28B expression in human renal tumor samples as determined by microarray analysis. LIN28 and LIN28B signal is log2 transformed and normalized to normal kidney. T, tumor sample; N, normal kidney.
 Immunohistochemical analysis of LIN28 expression in ovarian tumor tissue.")
10 Figure S9. LIN28/LIN28B expression in Ovarian Cancer. (A) LIN28/LIN28B expression in a panel of ovarian tumors as determined by microarray analysis and grouped by histological grade. Log-2 transformed LIN28 and LIN28B signal was row-normalized. (B) Immunohistochemical analysis of LIN28 expression in ovarian tumor tissue. Tissue sections from various ovarian carcinoma subtypes or normal ovary were stained with anti-lin28 antibody. Arrow, ovarian surface epithelium.
 as determined by analysis of SNP array data from 3300 human tumors/cell lines.")
11 Figure S10. Copy number alterations at the LIN28B locus. (A) Samples showing copy number increase at the LIN28B locus (LIN28B genomic position = MB) as determined by analysis of SNP array data from 3300 human tumors/cell lines. (B) GISTIC G-score (= frequency of alteration x mean alteration amplitude) plotted as a function of position along chromosome 6 for breast cancer samples. LIN28B is located in proximity to the most significant amplification peak on the chromosome but falls outside the peak region.
12 Figures S11. A region in the vicinity of a c-myc binding site is demethylated in cell lines that express LIN28B. (A) Position of the CpG island within the LIN28B locus (blue arrows, ~1kb downstream of TSS) analyzed by bisulfite sequencing. *, c-myc binding sites recently identified by Chang et al 64. (B) The three cell lines analyzed by bisulfite sequencing display comparable levels of c-myc as assessed by Western blotting (C) Relative LIN28B levels in HeLa, HepG2, and K562 cells as assessed by qpcr. (D) Methylation status at the LIN28B locus in the region defined in (A). Filled circles represent methylated CpGs, while unfilled circles represent unmethylated CpGs.
13
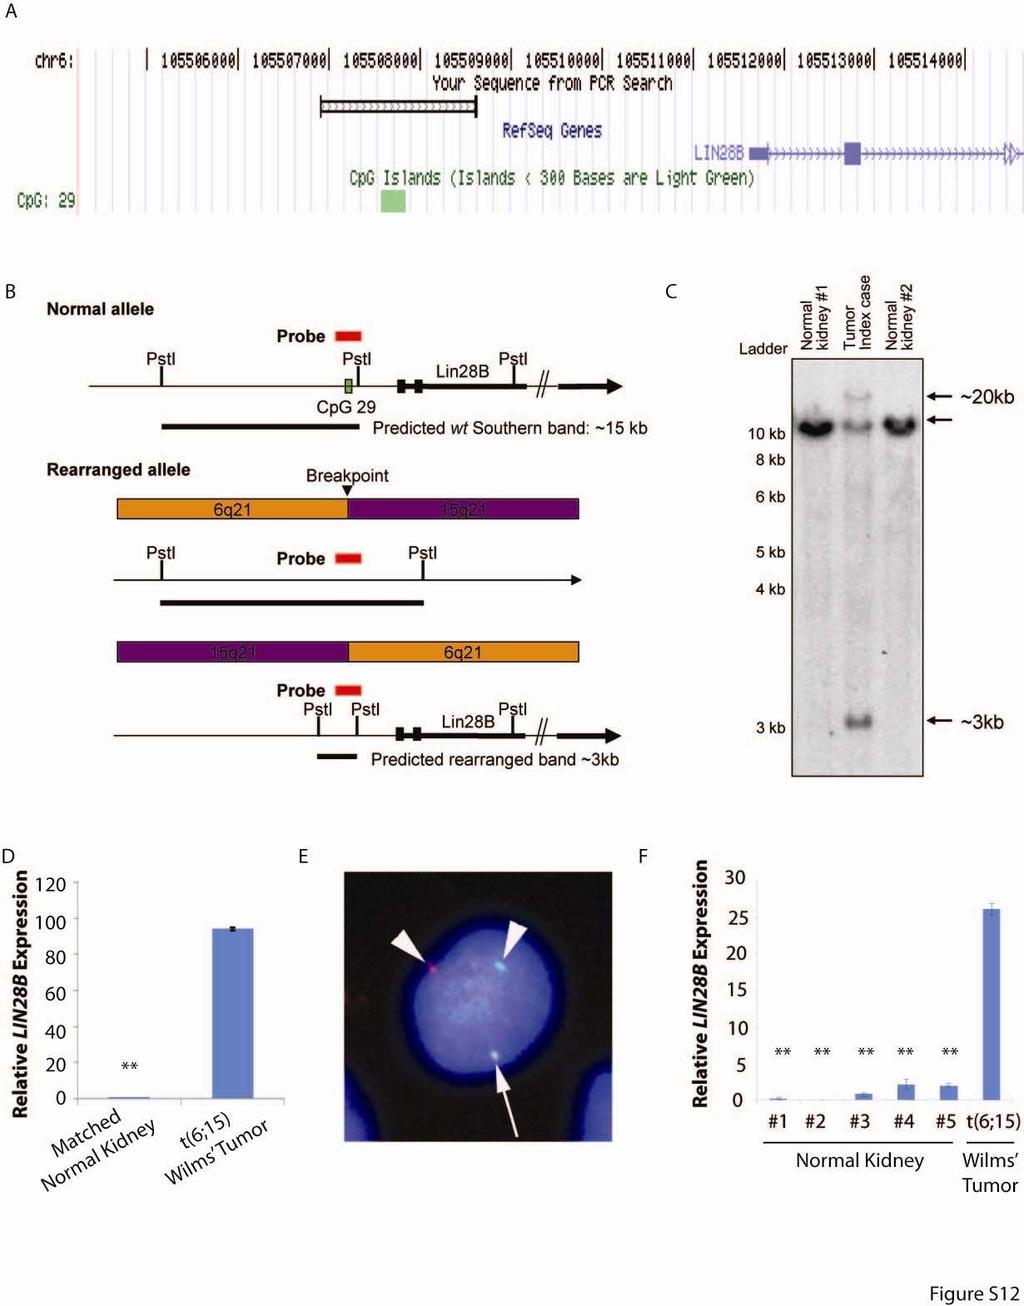
14 Figure S12. The 6q21 breakpoint of a t(6;15) translocation in Wilms tumor maps directly adjacent to the LIN28B transcriptional start site and is associated with increased LIN28B expression. (A) Probe used for Southern blot analysis (red bar) as depicted using the UCSC Genome Browser. This probe spans a possible regulatory CpG island (CpG-29) directly upstream of the LIN28B locus. (B) Schematic depicting predicted bands after Southern blot analysis of PstI-digested genomic normal DNA and DNA from the index Wilms tumor case using the above probe. The probe is expected to hybridize to a single ~15kb wt fragment from the normal 6q21 allele, and 2 rearranged fragments (~20kb and ~3kb) from the derivative t(6;15) chromosomes. (C) Southern blot of the index Wilms tumor case and matching normal kidney (#1) and a second normal kidney control (#2) using PstI-digested genomic DNA and the above probe. (D) Levels of LIN28B expression determined by quantitative PCR in the index Wilms tumor case versus matched normal kidney. (E) Fluorescence in-situ hybridization (FISH) analysis of a second Wilms tumor case with a t(6;15)(q21;q26) translocation showing a breakpoint in 6q21 in the region of the LIN28B locus. Using the BACs RP11-809N15 (labeled red) and RP11-770C15 (labeled green), a fused yellow signal representing the normal allele (arrow) and split red and green signals representing the translocation derivates (arrowheads) are seen. (F) Levels of LIN28B expression determined by quantitative PCR in this second t(6;15) Wilms tumor case versus a series of five normal kidney tissue samples. Signal normalized to average of five normal samples. Matched normal tissue was not available for this tumor sample.
15 # Tumors / # Injection Sites Puro 0/5 Lin28 3/5 LIN28B 4/5 Supplementary Table 1: NIH/3T3 cells were infected with pbabe.puro, PBabe.Puro.Lin28 or pbabe.puro.lin28b, and 2 x 10 6 cells were injected subcutaneously into the flank of Balb/c nude mice. Numbers represent number of palpable tumors at 6 weeks. Cell Line Type LIN28 Expression LIN28B Expression Human ips Induced Pluripotent Cell + + (low) cells PA-1 Ovarian teratocarcinoma + - G401 Wilms Tumor + - NCCIT Embryonal + - carcinoma/teratocarcinoma H1299 NSCLC - + Caco-2 Colon adenocarcinoma - + A549 Lung adenocarcinoma - + Calu-1 Lung carcinoma, - - epidermoid Calu-6 Lung, anaplastic - + carcinoma H460 Large cell lung carcinoma - - LeSa (LL86) Normal Lung fibroblastlike - - K562 CML, blast crisis + (low) + Lama-84 CML, blast crisis - + AR230 CML, blast crisis - + Hela Cervical cancer - - T47D Breast Cancer + - CCRF-CEM ALL - + K562 CML, blast crisis - + LOXIMVI Melanoma - + SK_MEL_28 Melanoma - + UACC_257 Melanoma - + UACC_62 Melanoma - + HOP_62 Lung Cancer + - IGROV1 Ovarian Cancer + - Supplementary Table 2: List of cell lines tested for LIN28 and LIN28Bexpression by quantitative PCR, and curated from NCI-60 microarray data (grey) shown in (Fig. S3B)
16 Position Sample Description LIN28 Staining A1 Mucin adenocarcinoma (ascending colon) + B1 Apillary adenocarcinoma (rectal colon) ++ C1 Signet cell adenocarcinoma (rectal colonanus) + D1 Papillary adenocarcinoma (iliac-cecal 0 colon) E1 Adenocaricnoma (sigmoid colon) + F1 Adenocarcinoma (sigmoid colon) +++ G1 Adenocarcinoma (transverse colon) ++ H1 Adenocarcinoma (rectal colon) N/A I1 Adenocarcinoma (rectal colon) ++ J1 Adenocarcinoma (rectal colon) ++ K1 Mucin adenocarcinoma (rectal colon) +++ A2 Mucin adenocarcinoma (ascending colon) 0 B2 Papillary adenocaricnoma (rectal colon) ++ C2 Adenocarcinoma (colon) +++ D2 Mucin adenocarcinoma (rectal colon) + E2 0 F2 Colon mucosa adjacent to cancer 0/+ G2 Colon mucosa adjacent to cancer 0/+ H2 Colon mucosa adjacent to cancer 0/+ I2 Colon mucosa adjacent to cancer 0/+ J2 Colon mucosa adjacent to cancer + K2 Colon mucosa adjacent to cancer + A3 Colon mucosa adjacent to cancer 0/+ B3 Colon mucosa adjacent to cancer 0/+ C3 Colon mucosa adjacent to cancer 0/+ D3 Colon mucosa adjacent to cancer 0 E3 Colon mucosa adjacent to cancer 0 F3 Colon mucosa adjacent to cancer 0 G3 Colon mucosa adjacent to cancer 0 H3 Colon mucosa adjacent to cancer 0 I3 Colon mucosa adjacent to cancer 0 J3 Breast invasive ductal cancer, left ++ K3 Breast adenocarcinoma, left ++ A4 Breast adenocarcinoma, left N/A B4 Breast adenocarcnioma, right +++ C4 Breast invasive ductal cancer, left ++ D4 Breast adenocarcinoma, left + E4 Breast adenocarcinoma, left ++ F4 Breast adenocarcinoma, left ++ G4 Breast adenocarcinoma, right 0/+ H4 Breast adenocarcinoma, right +++ I4 Breast adenocarcinoma, left 0 J4 Breast adenocarcinoma, left +++ K4 Breast invasive ductal cancer, right ++ A5 Breast adjacent to breast cancer 0/+ B5 Breast adjacent to breast cancer ++ C5 Fibroadenosis, right ++
17 D5 Fibroadenosis, right 0 E5 Fibroadenoma, right 0 F5 Fibroadenoma, right 0/+ G5 Fibroadenoma, left 0 H5 Fibroadenoma, left 0 I5 Fibroadenoma, right 0 J5 Fibroadenosis, left 0 K5 Fibroadenosis, right 0 A6 Breast adjacent to breast cancer 0 B6 Fibroadenosis, left 0 C6 Fibroadenosis, left 0 D6 Fibroadenosis, left 0 E6 Breast adjacent to breast cancer 0 F6 Breast adjacent to breast cancer ++ G6 Lung squamous cancer, grade I, left-up 0/+ lobule H6 Lung adenocarcinoma, grade I, left-down 0/+ lobule I6 Lung small cell cancer, spindle, right-down ++ lobule J6 Lung bronchioalveolar-carcinoma + K6 Lung squamous cancer, grade II-III 0/+ A7 Lung adenocarcinoma, grade I ++ B7 Lung squamous cancer grade II-III ++ C7 Lung squamous cancer grade III +++ D7 Lung muco-adenocarcinoma, grade I, left 0 low E7 Lung adenocarcinoma, right middle 0 F7 Lung adenocarcinoma, left up 0/+ G7 Lung adenocarcinoma, right up 0 H7 Lung adenocarcinoma, left low 0 I7 Lung adenocarcinoma, right up N/A J7 Lung adenocarcinoma, right low ++ A8 Metastatic adenocarcinoma +++ B8 Ovarian muco-cystadenoma 0 C8 Ovarian muco-cystadenoma ++ D8 Ovarian clear cell carcinoma 0/+ E8 Ovarian serous papillary adenoma 0/+ F8 Ovarian small cell carcinoma 0/+ G8 Ovarian serous cystadenoma + H8 Ovarian clear cell carcinoma ++ I8 Ovarian serous papillary cystadenoma ++ J8 Ovarian adenocaricnoma, right 0 K8 Ovarian adenocarcinoma, right 0 A9 Cervical squamous cancer grade II ++ B9 Cervical squamous cancer grade II, deep ++ muscle invaded C9 Cervical squamous cancer grade III ++ D9 Cervical squamous cancer grade III 0 E9 Cervical squamous cancer grade I 0
18 F9 Cervical squamous cancer grade II, muscle 0/+ invaded G9 Cervical squamous cancer grade I 0 H9 Cervical squamous cancer grade III, muscle N/A invaded I9 Cervical squamous cancer grade III 0 J9 Cervical squamous cancer grade I 0 K9 Cervical squamous cancer grade I, superficial invaded N/A Supplementary Table 3: Female multi-tumor type microarray stained with an anti-lin28 antibody. Specimens contained on the array were: colorectal cancer (15 samples), breast cancer (15 samples), lung cancer (15 samples), cervical cancer (10 samples), ovarian cancer (10 samples). LIN28 staining level. +++: intense staining; ++: moderate staining; +: weak staining; 0/+: diffuse, weak staining, potentially nonspecific; 0: no staining. Pt ID Phase LIN28 LIN28B 1 CP BC Myeloid CP BC - Lymphoid CP BC - Myeloid CP BC - Lymphoid CP BC Myeloid CP BC - Lymphoid AP BC Myeloid CP BC Myeloid BC Myeloid BC- Remission CP BC-myeloid AP BC Myeloid CP BC Myeloid CP BC - Myeloid - - Table S4. Paired blast crisis (BC), accelerated phase (AP), or chronic phase (CP) samples from patients were analyzed for LIN28 and LIN28B expression by quantitative PCR as described in methods.
19 Tumor Type # of Tumors Broad Gain Focal Gain High Level (Broad or Focal) Unamplified All % 1.70% 3.40% 86.80% Breast % 8.60% 5.30% 71.30% CML % 7.60% 66.60% 33.40% HCC % 1.00% 2.50% 89.10% Lung NSC % 1.50% 1.20% 88.30% Wilms 2 0% 50.0% 0.00% 50.00% Supplementary Table 5: Summary of SNP array data analysis on 3330 primary tumors and cancer cell lines. Broad gain gain of the entire chromosome. Focal gain amplicon size smaller than a chromosomal arm. High level gain inferred copy number gain > 2. +1kb-BS-F: TTAGTAAAGGTGGTGGAGAAGAGTT +1kb-BS-R CTCTTTAAACAAAAAACCCAAAAAA For bisulfite sequencing of LIN28B locus hlin28bf GCCCCTTGGATATTCCAGTC hlin28br: TGACTCAAGGCCTTTGGAAG For quantitative RT-PCR using SYBR Green hgapdhf GCTCTCCAGAACATCATCCCTGCC For quantitative RT-PCR hgapdhr CGTTGTCATACCAGGAAATGAGCTT using SYBR Green LIN28F 5 -TTCGGCTTCCTGTCCATGAC-3 LIN28R 5 -CCACTGCCTCACCCTCCTT-3. For Taqman quantitative RT- LIN28 Probe 5 - FAM -ATGTCTTTGTGCACCAGAGTAAGCTGCACAT - BHQ -3 PCR assay (performed on CML patient samples). LIN28BF 5 -GGATTTGGATTCATCTCCATGATAA-3 For Taqman quantitative RT- LIN28BR 5 -GAATTCCACTGGTTCTCCTTCTTTT-3 PCR assay (performed on LIN28B Probe 5 - FAM - CAGTCGATGTATTTGTACACCAAAGCAAACTATTCATG - BHQ -3 CML patient samples) BCR 5 -CCTTCGACGTCAATAACAAGGAT-3 Forward BCR 5 -CCTGCGATGGCGTTCAC-3 Reverse BCR Probe 5 - FAM - TCCATCTCGCTCATCATCACCGACA - TAM -3 For Taqman quantitative RT- PCR assay (performed on CML patient samples) Supplementary Table 6: List of Primer Sequences
Supplementary Figure 1. Spitzoid Melanoma with PPFIBP1-MET fusion. (a) Histopathology (4x) shows a domed papule with melanocytes extending into the
 Histopathology (4x) shows a domed papule with melanocytes extending into the") Supplementary Figure 1. Spitzoid Melanoma with PPFIBP1-MET fusion. (a) Histopathology (4x) shows a domed papule with melanocytes extending into the deep dermis. (b) The melanocytes demonstrate abundant
Supplementary Figure 1. Spitzoid Melanoma with PPFIBP1-MET fusion. (a) Histopathology (4x) shows a domed papule with melanocytes extending into the deep dermis. (b) The melanocytes demonstrate abundant
Nature Immunology: doi: /ni Supplementary Figure 1. DNA-methylation machinery is essential for silencing of Cd4 in cytotoxic T cells.
 Supplementary Figure 1 DNA-methylation machinery is essential for silencing of Cd4 in cytotoxic T cells. (a) Scheme for the retroviral shrna screen. (b) Histogram showing CD4 expression (MFI) in WT cytotoxic
Supplementary Figures
 Supplementary Figures Supplementary Figure 1. Confirmation of Dnmt1 conditional knockout out mice. a, Representative images of sorted stem (Lin - CD49f high CD24 + ), luminal (Lin - CD49f low CD24 + )
Supplementary methods:
 Supplementary methods: Primers sequences used in real-time PCR analyses: β-actin F: GACCTCTATGCCAACACAGT β-actin [11] R: AGTACTTGCGCTCAGGAGGA MMP13 F: TTCTGGTCTTCTGGCACACGCTTT MMP13 R: CCAAGCTCATGGGCAGCAACAATA
Supplemental File. TRAF6 is an amplified oncogene bridging the Ras and nuclear factor-κb cascade in human lung cancer
 Supplemental File TRAF6 is an amplified oncogene bridging the Ras and nuclear factor-κb cascade in human lung cancer Daniel T. Starczynowski, William W. Lockwood, Sophie Delehouzee, Raj Chari, Joanna Wegrzyn,
(a) Schematic diagram of the FS mutation of UVRAG in exon 8 containing the highly instable
 Schematic diagram of the FS mutation of UVRAG in exon 8 containing the highly instable") Supplementary Figure 1. Frameshift (FS) mutation in UVRAG. (a) Schematic diagram of the FS mutation of UVRAG in exon 8 containing the highly instable A 10 DNA repeat, generating a premature stop codon
Supplementary Figure 1. Frameshift (FS) mutation in UVRAG. (a) Schematic diagram of the FS mutation of UVRAG in exon 8 containing the highly instable A 10 DNA repeat, generating a premature stop codon
Supplementary Information
 Supplementary Information - chimeric fusion transcript in human gastric cancer promotes tumorigenesis through activation of PI3K/AKT signaling Sun Mi Yun, Kwiyeom Yoon, Sunghoon Lee, Eunjeong Kim, Seong-Ho
Supplementary Information Titles Journal: Nature Medicine
 Supplementary Information Titles Journal: Nature Medicine Article Title: Corresponding Author: Supplementary Item & Number Supplementary Fig.1 Fig.2 Fig.3 Fig.4 Fig.5 Fig.6 Fig.7 Fig.8 Fig.9 Fig. Fig.11
CDH1 truncating alterations were detected in all six plasmacytoid-variant bladder tumors analyzed by whole-exome sequencing.
 Supplementary Figure 1 CDH1 truncating alterations were detected in all six plasmacytoid-variant bladder tumors analyzed by whole-exome sequencing. Whole-exome sequencing of six plasmacytoid-variant bladder
Exploring TCGA Pan-Cancer Data at the UCSC Cancer Genomics Browser
 Exploring TCGA Pan-Cancer Data at the UCSC Cancer Genomics Browser Melissa S. Cline 1*, Brian Craft 1, Teresa Swatloski 1, Mary Goldman 1, Singer Ma 1, David Haussler 1, Jingchun Zhu 1 1 Center for Biomolecular
SUPPLEMENTARY INFORMATION
 doi: 1.138/nature8645 Physical coverage (x haploid genomes) 11 6.4 4.9 6.9 6.7 4.4 5.9 9.1 7.6 125 Neither end mapped One end mapped Chimaeras Correct Reads (million ns) 1 75 5 25 HCC1187 HCC1395 HCC1599
(a) Significant biological processes (upper panel) and disease biomarkers (lower panel)
 Significant biological processes (upper panel) and disease biomarkers (lower panel)") Supplementary Figure 1. Functional enrichment analyses of secretomic proteins. (a) Significant biological processes (upper panel) and disease biomarkers (lower panel) 2 involved by hrab37-mediated secretory
Supplementary Figure 1. Functional enrichment analyses of secretomic proteins. (a) Significant biological processes (upper panel) and disease biomarkers (lower panel) 2 involved by hrab37-mediated secretory
No evidence of clonally selected somatic genomic alterations in cancer associated
 Supplementary Data Resource No evidence of clonally selected somatic genomic alterations in cancer associated fibroblasts from human breast and ovarian carcinomas Wen Qiu, Min Hu, Anita Sridhar, Ken Opeskin,
Supplemental Figure S1. A. Venn diagram depicting overlap between anti-correlated genes of
 Supplemental Figure S1. A. Venn diagram depicting overlap between anti-correlated genes of 1,000 most differentially expressed genes with NKX2-1 amplification in lung adenocarcinoma cell lines and anti-correlated
SUPPLEMENTARY INFORMATION
 DOI: 10.1038/ncb2607 Figure S1 Elf5 loss promotes EMT in mammary epithelium while Elf5 overexpression inhibits TGFβ induced EMT. (a, c) Different confocal slices through the Z stack image. (b, d) 3D rendering
SOPten flox/flox (KO) Pten flox/flox (WT) flox allele 6.0 kb. Pten. Actin. ! allele 2.3 kb. Supplementary Figure S1. Yanagi, et al.
 Pten flox/flox (WT) flox allele 6.0 kb. Pten. Actin. ! allele 2.3 kb. Supplementary Figure S1. Yanagi, et al.") s1 A Pten flox/flox () SOPten flox/flox () flox allele 6. kb B Pten flox/flox () SOPten flox/flox () Pten Actin! allele 2.3 kb Supplementary Figure S1. Yanagi, et al. A B BrdU BrdU positive cells ( ) 3
s1 A Pten flox/flox () SOPten flox/flox () flox allele 6. kb B Pten flox/flox () SOPten flox/flox () Pten Actin! allele 2.3 kb Supplementary Figure S1. Yanagi, et al. A B BrdU BrdU positive cells ( ) 3
SUPPLEMENTARY INFORMATION
 doi:.38/nature8975 SUPPLEMENTAL TEXT Unique association of HOTAIR with patient outcome To determine whether the expression of other HOX lincrnas in addition to HOTAIR can predict patient outcome, we measured
7SK ChIRP-seq is specifically RNA dependent and conserved between mice and humans.
 Supplementary Figure 1 7SK ChIRP-seq is specifically RNA dependent and conserved between mice and humans. Regions targeted by the Even and Odd ChIRP probes mapped to a secondary structure model 56 of the
Supplementary Figure 1 IL-27 IL
 Tim-3 Supplementary Figure 1 Tc0 49.5 0.6 Tc1 63.5 0.84 Un 49.8 0.16 35.5 0.16 10 4 61.2 5.53 10 3 64.5 5.66 10 2 10 1 10 0 31 2.22 10 0 10 1 10 2 10 3 10 4 IL-10 28.2 1.69 IL-27 Supplementary Figure 1.
Supplementary Information
 Supplementary Information mediates STAT3 activation at retromer-positive structures to promote colitis and colitis-associated carcinogenesis Zhang et al. a b d e g h Rel. Luc. Act. Rel. mrna Rel. mrna
Supplementary Figures
 Supplementary Figures Supplementary Figure 1 Characterization of stable expression of GlucB and sshbira in the CT26 cell line (a) Live cell imaging of stable CT26 cells expressing green fluorescent protein
SUPPLEMENTARY INFORMATION
 DOI: 10.1038/ncb3021 Supplementary figure 1 Characterisation of TIMPless fibroblasts. a) Relative gene expression of TIMPs1-4 by real time quantitative PCR (RT-qPCR) in WT or ΔTimp fibroblasts (mean ±
Copy number and somatic mutations drive tumors
 Detection of copy number alterations, ploidy and loss of heterozygosity across the genome in FFPE specimens Utility for diagnosis and treatment with comparison to FISH-based and as a complement to sequencing
a) List of KMTs targeted in the shrna screen. The official symbol, KMT designation,
 List of KMTs targeted in the shrna screen. The official symbol, KMT designation,") Supplementary Information Supplementary Figures Supplementary Figure 1. a) List of KMTs targeted in the shrna screen. The official symbol, KMT designation, gene ID and specifities are provided. Those highlighted
Supplementary Information Supplementary Figures Supplementary Figure 1. a) List of KMTs targeted in the shrna screen. The official symbol, KMT designation, gene ID and specifities are provided. Those highlighted
Molecular Detection of BCR/ABL1 for the Diagnosis and Monitoring of CML
 Molecular Detection of BCR/ABL1 for the Diagnosis and Monitoring of CML Imran Mirza, MD, MS, FRCPC Pathology & Laboratory Medicine Institute Sheikh Khalifa Medical City, Abu Dhabi, UAE. imirza@skmc.ae
microrna-200b and microrna-200c promote colorectal cancer cell proliferation via
 Supplementary Materials microrna-200b and microrna-200c promote colorectal cancer cell proliferation via targeting the reversion-inducing cysteine-rich protein with Kazal motifs Supplementary Table 1.
m 6 A mrna methylation regulates AKT activity to promote the proliferation and tumorigenicity of endometrial cancer
 SUPPLEMENTARY INFORMATION Articles https://doi.org/10.1038/s41556-018-0174-4 In the format provided by the authors and unedited. m 6 A mrna methylation regulates AKT activity to promote the proliferation
Comparison of open chromatin regions between dentate granule cells and other tissues and neural cell types.
 Supplementary Figure 1 Comparison of open chromatin regions between dentate granule cells and other tissues and neural cell types. (a) Pearson correlation heatmap among open chromatin profiles of different
MRC-Holland MLPA. Description version 08; 30 March 2015
 SALSA MLPA probemix P351-C1 / P352-D1 PKD1-PKD2 P351-C1 lot C1-0914: as compared to the previous version B2 lot B2-0511 one target probe has been removed and three reference probes have been replaced.
File Name: Supplementary Information Description: Supplementary Figures and Supplementary Tables. File Name: Peer Review File Description:
 File Name: Supplementary Information Description: Supplementary Figures and Supplementary Tables File Name: Peer Review File Description: Primer Name Sequence (5'-3') AT ( C) RT-PCR USP21 F 5'-TTCCCATGGCTCCTTCCACATGAT-3'
Supplementary Figure 1. Double-staining immunofluorescence analysis of invasive colon and breast cancers. Specimens from invasive ductal breast
 Supplementary Figure 1. Double-staining immunofluorescence analysis of invasive colon and breast cancers. Specimens from invasive ductal breast carcinoma (a) and colon adenocarcinoma (b) were staining
Nature Genetics: doi: /ng Supplementary Figure 1. SEER data for male and female cancer incidence from
 Supplementary Figure 1 SEER data for male and female cancer incidence from 1975 2013. (a,b) Incidence rates of oral cavity and pharynx cancer (a) and leukemia (b) are plotted, grouped by males (blue),
Chromatin marks identify critical cell-types for fine-mapping complex trait variants
 Chromatin marks identify critical cell-types for fine-mapping complex trait variants Gosia Trynka 1-4 *, Cynthia Sandor 1-4 *, Buhm Han 1-4, Han Xu 5, Barbara E Stranger 1,4#, X Shirley Liu 5, and Soumya
gliomas. Fetal brain expected who each low-
 Supplementary Figure S1. Grade-specificity aberrant expression of HOXA genes in gliomas. (A) Representative RT-PCR analyses of HOXA gene expression in human astrocytomas. Exemplified glioma samples include
Session 4 Rebecca Poulos
 The Cancer Genome Atlas (TCGA) & International Cancer Genome Consortium (ICGC) Session 4 Rebecca Poulos Prince of Wales Clinical School Introductory bioinformatics for human genomics workshop, UNSW 20
Type of file: PDF Size of file: 0 KB Title of file for HTML: Supplementary Information Description: Supplementary Figures
 Type of file: PDF Size of file: 0 KB Title of file for HTML: Supplementary Information Description: Supplementary Figures Supplementary Figure 1 mir-128-3p is highly expressed in chemoresistant, metastatic
T H E J O U R N A L O F C E L L B I O L O G Y
 T H E J O U R N A L O F C E L L B I O L O G Y Supplemental material Amelio et al., http://www.jcb.org/cgi/content/full/jcb.201203134/dc1 Figure S1. mir-24 regulates proliferation and by itself induces
p.r623c p.p976l p.d2847fs p.t2671 p.d2847fs p.r2922w p.r2370h p.c1201y p.a868v p.s952* RING_C BP PHD Cbp HAT_KAT11
 ARID2 p.r623c KMT2D p.v650fs p.p976l p.r2922w p.l1212r p.d1400h DNA binding RFX DNA binding Zinc finger KMT2C p.a51s p.d372v p.c1103* p.d2847fs p.t2671 p.d2847fs p.r4586h PHD/ RING DHHC/ PHD PHD FYR N
EPIGENETIC RE-EXPRESSION OF HIF-2α SUPPRESSES SOFT TISSUE SARCOMA GROWTH
 EPIGENETIC RE-EXPRESSION OF HIF-2α SUPPRESSES SOFT TISSUE SARCOMA GROWTH Supplementary Figure 1. Supplementary Figure 1. Characterization of KP and KPH2 autochthonous UPS tumors. a) Genotyping of KPH2
Discovery Dataset. PD Liver Luminal B/ Her-2+ Letrozole. PD Supraclavicular Lymph node. PD Supraclavicular Lymph node Luminal B.
 Discovery Dataset 11T pt1cpn2am1(liver) 2009 2010 Liver / Her-2+ 2011 Death Letrozole CHT pt1cpn0(sn)m0 Supraclavicular Lymph node Death 12T 2003 2006 2006 2008 Anastrozole Local RT+Examestane Fulvestrant
AP VP DLP H&E. p-akt DLP
 A B AP VP DLP H&E AP AP VP DLP p-akt wild-type prostate PTEN-null prostate Supplementary Fig. 1. Targeted deletion of PTEN in prostate epithelium resulted in HG-PIN in all three lobes. (A) The anatomy
SUPPLEMENTARY FIGURE LEGENDS. atypical adenomatous hyperplasias (AAH); Grade II: adenomas; Grade III: adenocarcinomas;
; Grade II: adenomas; Grade III: adenocarcinomas;") SUPPLEMENTARY FIGURE LEGENDS Supplementary Figure S1: Tumor grades in Ras G12D ; p53 / lung tumors. Representative histology (H&E) of K-Ras G12D ; p53 / lung tumors 13 weeks after tumor initiation. Grade
SUPPLEMENTARY FIGURE LEGENDS Supplementary Figure S1: Tumor grades in Ras G12D ; p53 / lung tumors. Representative histology (H&E) of K-Ras G12D ; p53 / lung tumors 13 weeks after tumor initiation. Grade
Assessment of Breast Cancer with Borderline HER2 Status Using MIP Microarray
 Assessment of Breast Cancer with Borderline HER2 Status Using MIP Microarray Hui Chen, Aysegul A Sahin, Xinyan Lu, Lei Huo, Rajesh R Singh, Ronald Abraham, Shumaila Virani, Bal Mukund Mishra, Russell Broaddus,
Patnaik SK, et al. MicroRNAs to accurately histotype NSCLC biopsies
 Patnaik SK, et al. MicroRNAs to accurately histotype NSCLC biopsies. 2014. Supplemental Digital Content 1. Appendix 1. External data-sets used for associating microrna expression with lung squamous cell
New Developments in Immunohistochemistry for Gynecologic Pathology
 New Developments in Immunohistochemistry for Gynecologic Pathology Michael T. Deavers, M.D. Professor, Departments of Pathology and Gynecologic Oncology Immunohistochemistry in Gynecologic Pathology Majority
oncogenes-and- tumour-suppressor-genes)
") Special topics in tumor biochemistry oncogenes-and- tumour-suppressor-genes) Speaker: Prof. Jiunn-Jye Chuu E-Mail: jjchuu@mail.stust.edu.tw Genetic Basis of Cancer Cancer-causing mutations Disease of aging
Special topics in tumor biochemistry oncogenes-and- tumour-suppressor-genes) Speaker: Prof. Jiunn-Jye Chuu E-Mail: jjchuu@mail.stust.edu.tw Genetic Basis of Cancer Cancer-causing mutations Disease of aging
Layered-IHC (L-IHC): A novel and robust approach to multiplexed immunohistochemistry So many markers and so little tissue
: A novel and robust approach to multiplexed immunohistochemistry So many markers and so little tissue") Page 1 The need for multiplex detection of tissue biomarkers. There is a constant and growing demand for increased biomarker analysis in human tissue specimens. Analysis of tissue biomarkers is key to
Page 1 The need for multiplex detection of tissue biomarkers. There is a constant and growing demand for increased biomarker analysis in human tissue specimens. Analysis of tissue biomarkers is key to
Bin Liu, Lei Yang, Binfang Huang, Mei Cheng, Hui Wang, Yinyan Li, Dongsheng Huang, Jian Zheng,
 The American Journal of Human Genetics, Volume 91 Supplemental Data A Functional Copy-Number Variation in MAPKAPK2 Predicts Risk and Survival of Lung Cancer Bin Liu, Lei Yang, Binfang Huang, Mei Cheng,
Supplementary Figure 1: Comparison of acgh-based and expression-based CNA analysis of tumors from breast cancer GEMMs.
 Supplementary Figure 1: Comparison of acgh-based and expression-based CNA analysis of tumors from breast cancer GEMMs. (a) CNA analysis of expression microarray data obtained from 15 tumors in the SV40Tag
Nature Medicine: doi: /nm.3967
 Supplementary Figure 1. Network clustering. (a) Clustering performance as a function of inflation factor. The grey curve shows the median weighted Silhouette widths for varying inflation factors (f [1.6,
IKK-dependent activation of NF-κB contributes to myeloid and lymphoid leukemogenesis by BCR-ABL1
 Supplemental Figures BLOOD/2014/547943 IKK-dependent activation of NF-κB contributes to myeloid and lymphoid leukemogenesis by BCR-ABL1 Hsieh M-Y and Van Etten RA Supplemental Figure S1. Titers of retroviral
Session 4 Rebecca Poulos
 The Cancer Genome Atlas (TCGA) & International Cancer Genome Consortium (ICGC) Session 4 Rebecca Poulos Prince of Wales Clinical School Introductory bioinformatics for human genomics workshop, UNSW 28
Soft Agar Assay. For each cell pool, 100,000 cells were resuspended in 0.35% (w/v)
") SUPPLEMENTARY MATERIAL AND METHODS Soft Agar Assay. For each cell pool, 100,000 cells were resuspended in 0.35% (w/v) top agar (LONZA, SeaKem LE Agarose cat.5004) and plated onto 0.5% (w/v) basal agar.
SUPPLEMENTARY MATERIAL AND METHODS Soft Agar Assay. For each cell pool, 100,000 cells were resuspended in 0.35% (w/v) top agar (LONZA, SeaKem LE Agarose cat.5004) and plated onto 0.5% (w/v) basal agar.
Supplementary Information
 Supplementary Information Supplementary Figure 1. Effect of mir mimics and anti-mirs on DTPs a, Representative fluorescence microscopy images of GFP vector control or mir mimicexpressing parental and DTP
Chapter 4 Cellular Oncogenes ~ 4.6 -
 Chapter 4 Cellular Oncogenes - 4.2 ~ 4.6 - Many retroviruses carrying oncogenes have been found in chickens and mice However, attempts undertaken during the 1970s to isolate viruses from most types of
Activation of cellular proto-oncogenes to oncogenes. How was active Ras identified?
 Dominant Acting Oncogenes Eugene E. Marcantonio, M.D. Ph.D. Oncogenes are altered forms of normal cellular genes called proto-oncogenes that are involved in pathways regulating cell growth, differentiation,
Nature Immunology: doi: /ni Supplementary Figure 1. Huwe1 has high expression in HSCs and is necessary for quiescence.
 Supplementary Figure 1 Huwe1 has high expression in HSCs and is necessary for quiescence. (a) Heat map visualizing expression of genes with a known function in ubiquitin-mediated proteolysis (KEGG: Ubiquitin
Supplemental Figure S1. RANK expression on human lung cancer cells.
 Supplemental Figure S1. RANK expression on human lung cancer cells. (A) Incidence and H-Scores of RANK expression determined from IHC in the indicated primary lung cancer subgroups. The overall expression
Deregulation of STING Signaling in Colorectal Carcinoma Constrains DNA Damage Responses and Correlates With Tumorigenesis
 Cell Reports Supplemental Information Deregulation of STING Signaling in Colorectal Carcinoma Constrains DNA Damage Responses and Correlates With Tumorigenesis Tianli Xia, Hiroyasu Konno, Jeonghyun Ahn,
SUPPLEMENTARY INFORMATION
 DOI:.38/ncb3399 a b c d FSP DAPI 5mm mm 5mm 5mm e Correspond to melanoma in-situ Figure a DCT FSP- f MITF mm mm MlanaA melanoma in-situ DCT 5mm FSP- mm mm mm mm mm g melanoma in-situ MITF MlanaA mm mm
Supplementary Figures
 Supplementary Figures Supplementary Fig. 1. Galectin-3 is present within tumors. (A) mrna expression levels of Lgals3 (galectin-3) and Lgals8 (galectin-8) in the four classes of cell lines as determined
The Cancer Genome Atlas
 The Cancer Genome Atlas July 14, 2011 Kenna M. Shaw, Ph.D. Deputy Director The Cancer Genome Atlas Program TCGA: Core Objectives Launched in 2006 as a pilot and expanded in 2009, the goals of TCGA are
Supplementary Figure 1. Genotyping strategies for Mcm3 +/+, Mcm3 +/Lox and Mcm3 +/- mice and luciferase activity in Mcm3 +/Lox mice. A.
 Supplementary Figure 1. Genotyping strategies for Mcm3 +/+, Mcm3 +/Lox and Mcm3 +/- mice and luciferase activity in Mcm3 +/Lox mice. A. Upper part, three-primer PCR strategy at the Mcm3 locus yielding
(A) PCR primers (arrows) designed to distinguish wild type (P1+P2), targeted (P1+P2) and excised (P1+P3)14-
 PCR primers (arrows) designed to distinguish wild type (P1+P2), targeted (P1+P2) and excised (P1+P3)14-") 1 Supplemental Figure Legends Figure S1. Mammary tumors of ErbB2 KI mice with 14-3-3σ ablation have elevated ErbB2 transcript levels and cell proliferation (A) PCR primers (arrows) designed to distinguish
1 Supplemental Figure Legends Figure S1. Mammary tumors of ErbB2 KI mice with 14-3-3σ ablation have elevated ErbB2 transcript levels and cell proliferation (A) PCR primers (arrows) designed to distinguish
Supplementary Figure 1: GFAP positive nerves in patients with adenocarcinoma of
 SUPPLEMENTARY FIGURES AND MOVIE LEGENDS Supplementary Figure 1: GFAP positive nerves in patients with adenocarcinoma of the pancreas. (A) Images of nerves stained for GFAP (green), S100 (red) and DAPI
Breeding scheme, transgenes, histological analysis and site distribution of SB-mutagenized osteosarcoma.
 Supplementary Figure 1 Breeding scheme, transgenes, histological analysis and site distribution of SB-mutagenized osteosarcoma. (a) Breeding scheme. R26-LSL-SB11 homozygous mice were bred to Trp53 LSL-R270H/+
Supplementary Figure 1. EC-specific Deletion of Snail1 Does Not Affect EC Apoptosis. (a,b) Cryo-sections of WT (a) and Snail1 LOF (b) embryos at
 Cryo-sections of WT (a) and Snail1 LOF (b) embryos at") Supplementary Figure 1. EC-specific Deletion of Snail1 Does Not Affect EC Apoptosis. (a,b) Cryo-sections of WT (a) and Snail1 LOF (b) embryos at E10.5 were double-stained for TUNEL (red) and PECAM-1 (green).
Supplementary Figure 1. EC-specific Deletion of Snail1 Does Not Affect EC Apoptosis. (a,b) Cryo-sections of WT (a) and Snail1 LOF (b) embryos at E10.5 were double-stained for TUNEL (red) and PECAM-1 (green).
Chromothripsis: A New Mechanism For Tumorigenesis? i Fellow s Conference Cheryl Carlson 6/10/2011
 Chromothripsis: A New Mechanism For Tumorigenesis? i Fellow s Conference Cheryl Carlson 6/10/2011 Massive Genomic Rearrangement Acquired in a Single Catastrophic Event during Cancer Development Cell 144,
Supporting Online Material for
 www.sciencemag.org/cgi/content/full/1171320/dc1 Supporting Online Material for A Frazzled/DCC-Dependent Transcriptional Switch Regulates Midline Axon Guidance Long Yang, David S. Garbe, Greg J. Bashaw*
Supplementary Figures
 Supplementary Figures Supplementary Figure 1. Pan-cancer analysis of global and local DNA methylation variation a) Variations in global DNA methylation are shown as measured by averaging the genome-wide
Supplemental Figure S1. Tertiles of FKBP5 promoter methylation and internal regulatory region
 Supplemental Figure S1. Tertiles of FKBP5 promoter methylation and internal regulatory region methylation in relation to PSS and fetal coupling. A, PSS values for participants whose placentas showed low,
SHN-1 Human Digestive Panel Test results
 SHN-1 Human Digestive Panel Test results HN-30 tongue HN-24 salivary gland HN-12 larynx HN-28 esophagus HN-29 stomach HN-20 pancreas HN-13 liver HN-14 gall bladder HN-27-1 duodenum HN-27-2 ileum HN-27-3
mir-509-5p and mir-1243 increase the sensitivity to gemcitabine by inhibiting
 mir-509-5p and mir-1243 increase the sensitivity to gemcitabine by inhibiting epithelial-mesenchymal transition in pancreatic cancer Hidekazu Hiramoto, M.D. 1,3, Tomoki Muramatsu, Ph.D. 1, Daisuke Ichikawa,
of TERT, MLL4, CCNE1, SENP5, and ROCK1 on tumor development were discussed.
 Supplementary Note The potential association and implications of HBV integration at known and putative cancer genes of TERT, MLL4, CCNE1, SENP5, and ROCK1 on tumor development were discussed. Human telomerase
Nature Genetics: doi: /ng Supplementary Figure 1
 Supplementary Figure 1 MSI2 interactors are associated with the riboproteome and are functionally relevant. (a) Coomassie blue staining of FLAG-MSI2 immunoprecipitated complexes. (b) GO analysis of MSI2-interacting
Supplementary Information and Figure legends
 Supplementary Information and Figure legends Table S1. Primers for quantitative RT-PCR Target Sequence (5 -> 3 ) Target Sequence (5 -> 3 ) DAB2IP F:TGGACGATGTGCTCTATGCC R:GGATGGTGATGGTTTGGTAG Snail F:CCTCCCTGTCAGATGAGGAC
Supplementary Figure 1. Identification of tumorous sphere-forming CSCs and CAF feeder cells. The LEAP (Laser-Enabled Analysis and Processing)
") Supplementary Figure 1. Identification of tumorous sphere-forming CSCs and CAF feeder cells. The LEAP (Laser-Enabled Analysis and Processing) platform with laser manipulation to efficiently purify lung
Supplementary Figure 1. Identification of tumorous sphere-forming CSCs and CAF feeder cells. The LEAP (Laser-Enabled Analysis and Processing) platform with laser manipulation to efficiently purify lung
Cancer Genetics. What is Cancer? Cancer Classification. Medical Genetics. Uncontrolled growth of cells. Not all tumors are cancerous
 Session8 Medical Genetics Cancer Genetics J avad Jamshidi F a s a U n i v e r s i t y o f M e d i c a l S c i e n c e s, N o v e m b e r 2 0 1 7 What is Cancer? Uncontrolled growth of cells Not all tumors
MRC-Holland MLPA. Description version 06; 23 December 2016
 SALSA MLPA probemix P417-B2 BAP1 Lot B2-1216. As compared to version B1 (lot B1-0215), two reference probes have been added and two target probes have a minor change in length. The BAP1 (BRCA1 associated
Application of Whole Genome Microarrays in Cancer: You should be doing this test!!
 Application of Whole Genome Microarrays in Cancer: You should be doing this test!! Daynna Wolff, Ph.D. Director, Cytogenetics and Genomics Disclosures Clinical Laboratory Director and Employee, Medical
Presentation material is for education purposes only. All rights reserved URMC Radiology Page 1 of 98
 Presentation material is for education purposes only. All rights reserved. 2011 URMC Radiology Page 1 of 98 Radiology / Pathology Conference February 2011 Brooke Koltz, Cytopathology Resident Presentation
Profiles of gene expression & diagnosis/prognosis of cancer. MCs in Advanced Genetics Ainoa Planas Riverola
 Profiles of gene expression & diagnosis/prognosis of cancer MCs in Advanced Genetics Ainoa Planas Riverola Gene expression profiles Gene expression profiling Used in molecular biology, it measures the
MRC-Holland MLPA. Description version 12; 13 January 2017
 SALSA MLPA probemix P219-B3 PAX6 Lot B3-0915: Compared to version B2 (lot B2-1111) two reference probes have been replaced and one additional reference probe has been added. In addition, one flanking probe
Nature Genetics: doi: /ng Supplementary Figure 1. Somatic coding mutations identified by WES/WGS for 83 ATL cases.
 Supplementary Figure 1 Somatic coding mutations identified by WES/WGS for 83 ATL cases. (a) The percentage of targeted bases covered by at least 2, 10, 20 and 30 sequencing reads (top) and average read
America, Hershey, PA Australia, Melbourne, VIC Europe, Munich
 America, Hershey, PA Australia, Melbourne, VIC Europe, Munich info@vivopharm.com www.vivopharm.com Bladder MB-9-luc 2 Mouse urinary bladder carcinoma yes yes yes C57BL/6 2 Bone UMR-106 Rat osteosarcoma
Supplementary Figure 1. Baf60c and baf180 are induced during cardiac regeneration in zebrafish. RNA in situ hybridization was performed on paraffin
 Supplementary Figure 1. Baf60c and baf180 are induced during cardiac regeneration in zebrafish. RNA in situ hybridization was performed on paraffin sections from sham-operated adult hearts (a and i) and
(A) Cells grown in monolayer were fixed and stained for surfactant protein-c (SPC,
 Cells grown in monolayer were fixed and stained for surfactant protein-c (SPC,") Supplemental Figure Legends Figure S1. Cell line characterization (A) Cells grown in monolayer were fixed and stained for surfactant protein-c (SPC, green) and co-stained with DAPI to visualize the nuclei.
Supplemental Figure Legends Figure S1. Cell line characterization (A) Cells grown in monolayer were fixed and stained for surfactant protein-c (SPC, green) and co-stained with DAPI to visualize the nuclei.
List of Available TMAs in the PRN
 TMA RPCI_BrainCa01 RPCI_BrCa03 RPCI_BrCa04 RPCI_BrCa05 RPCI_BrCa0 RPCI_BrCa07 RPCI_BrCa08 RPCI_BrCa15 RPCI_BrCa1 RPCI_BrCa17 RPCI_BrCa18 RPCI_BrCa19 RPCI_BrCa20 RPCI_BrCa21 RPCI_BrCa24 RPCI_BrCa25 RPCI_BrCa2
Characterisation of structural variation in breast. cancer genomes using paired-end sequencing on. the Illumina Genome Analyser
 Characterisation of structural variation in breast cancer genomes using paired-end sequencing on the Illumina Genome Analyser Phil Stephens Cancer Genome Project Why is it important to study cancer? Why
SUPPLEMENTAL INFORMATION
 SUPPLEMENTAL INFORMATION GO term analysis of differentially methylated SUMIs. GO term analysis of the 458 SUMIs with the largest differential methylation between human and chimp shows that they are more
Supplementary Figure 1. IDH1 and IDH2 mutation site sequences on WHO grade III
 Supplementary Materials: Supplementary Figure 1. IDH1 and IDH2 mutation site sequences on WHO grade III patient samples. Genomic DNA samples extracted from punch biopsies from either FFPE or frozen tumor
Title: Epigenetic mechanisms underlying maternal diabetes-associated risk of congenital heart disease
 1 Supplemental Materials 2 3 Title: Epigenetic mechanisms underlying maternal diabetes-associated risk of congenital heart disease 4 5 6 Authors: Madhumita Basu, 1 Jun-Yi Zhu, 2 Stephanie LaHaye 1,3, Uddalak
Supplementary Figure S1. Generation of LSL-EZH2 conditional transgenic mice.
 Downstream Col1A locus S P P P EP Genotyping with P1, P2 frt PGKneopA + frt hygro-pa Targeting vector Genotyping with P3, P4 P1 pcag-flpe P2 P3 P4 frt SApA CAG LSL PGKATG frt hygro-pa C. D. E. ormal KRAS
Nature Immunology: doi: /ni Supplementary Figure 1. Characteristics of SEs in T reg and T conv cells.
 Supplementary Figure 1 Characteristics of SEs in T reg and T conv cells. (a) Patterns of indicated transcription factor-binding at SEs and surrounding regions in T reg and T conv cells. Average normalized
Significance of Chromosome Changes in Hematological Disorders and Solid Tumors
 Significance of Chromosome Changes in Hematological Disorders and Solid Tumors Size of Components of Human Genome Size of haploid genome 3.3 X 10 9 DNA basepairs Estimated genetic constitution 30,000
Significance of Chromosome Changes in Hematological Disorders and Solid Tumors
 Significance of Chromosome Changes in Hematological Disorders and Solid Tumors Size of Components of Human Genome Size of haploid genome! Estimated genetic constitution! Size of average chromosome
SALSA MLPA probemix P315-B1 EGFR
 SALSA MLPA probemix P315-B1 EGFR Lot B1-0215 and B1-0112. As compared to the previous A1 version (lot 0208), two mutation-specific probes for the EGFR mutations L858R and T709M as well as one additional
Supplementary Figure 1
 Supplementary Figure 1 Supplementary Fig. 1: Quality assessment of formalin-fixed paraffin-embedded (FFPE)-derived DNA and nuclei. (a) Multiplex PCR analysis of unrepaired and repaired bulk FFPE gdna from
Cancers of unknown primary : Knowing the unknown. Prof. Ahmed Hossain Professor of Medicine SSMC
 Cancers of unknown primary : Knowing the unknown Prof. Ahmed Hossain Professor of Medicine SSMC Definition Cancers of unknown primary site (CUPs) Represent a heterogeneous group of metastatic tumours,
Supplementary Figure 1. SA-β-Gal positive senescent cells in various cancer tissues. Representative frozen sections of breast, thyroid, colon and
 Supplementary Figure 1. SA-β-Gal positive senescent cells in various cancer tissues. Representative frozen sections of breast, thyroid, colon and stomach cancer were stained with SA-β-Gal and nuclear fast