Title: Epigenetic mechanisms underlying maternal diabetes-associated risk of congenital heart disease
|
|
|
- Janice Dixon
- 5 years ago
- Views:
Transcription
1 1 Supplemental Materials 2 3 Title: Epigenetic mechanisms underlying maternal diabetes-associated risk of congenital heart disease Authors: Madhumita Basu, 1 Jun-Yi Zhu, 2 Stephanie LaHaye 1,3, Uddalak Majumdar 1, Kai Jiao 4, Zhe Han, 2 and Vidu Garg 1,3, Affiliations: 1 Center for Cardiovascular Research and The Heart Center, Nationwide Children s Hospital, Columbus, OH Center for Genetic Medicine Research, Children's National Health System, Washington, DC 20010, USA 3 Department of Molecular Genetics, The Ohio State University, Columbus, OH 43210, USA 4 Department of Genetics, The University of Alabama at Birmingham, Birmingham, AL 35294, USA. 5 Departments of Pediatrics, The Ohio State University, Columbus, OH 43210, USA
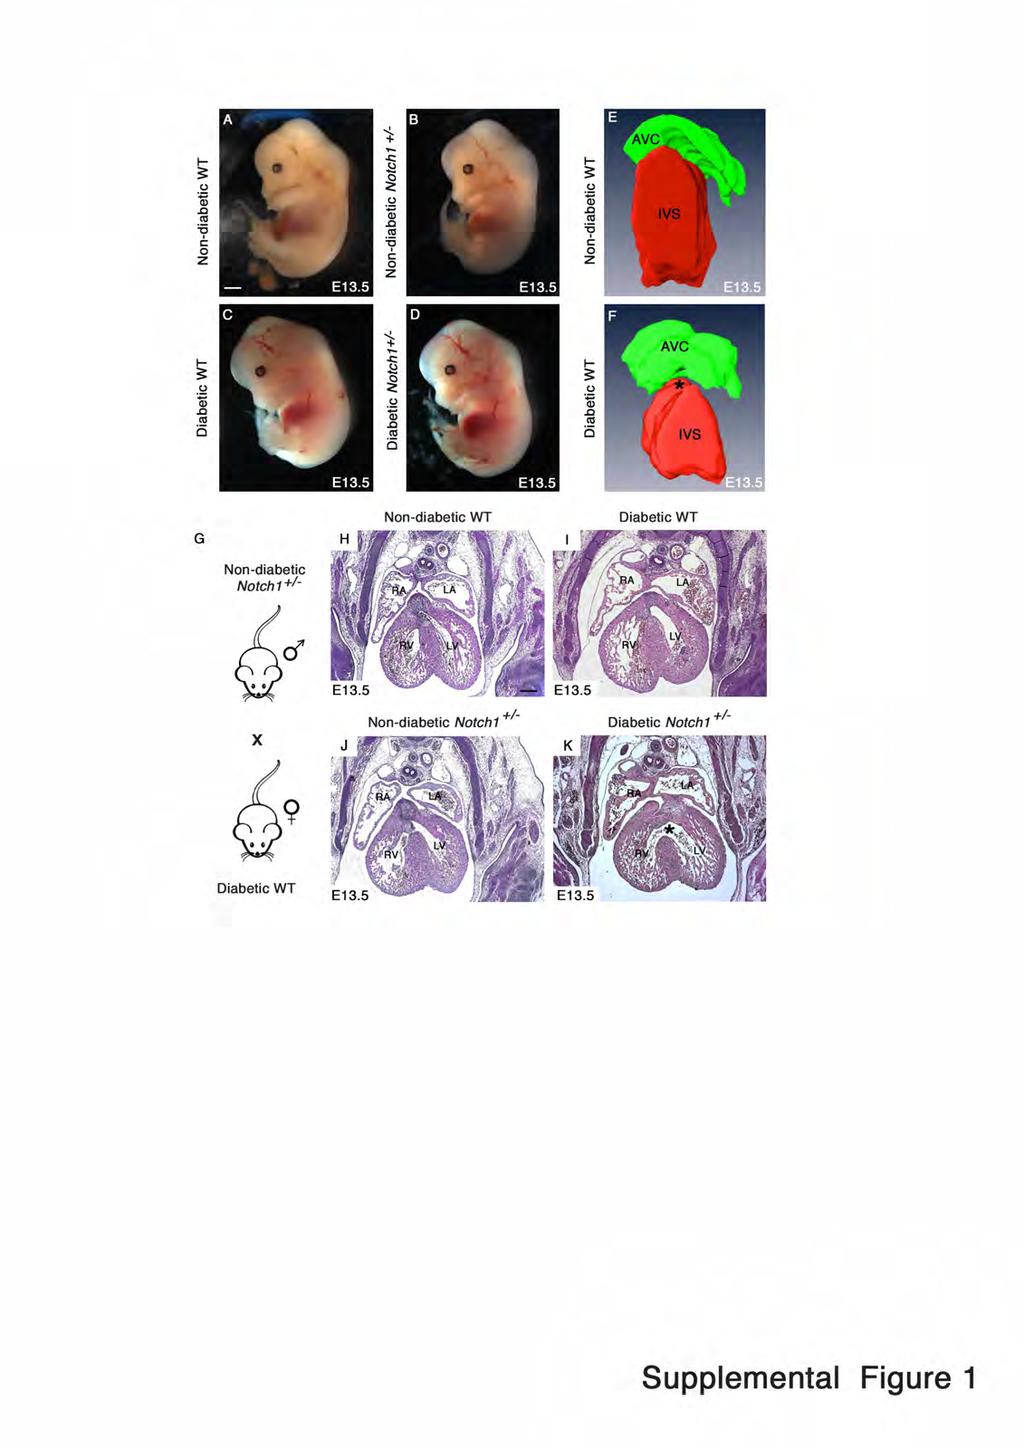
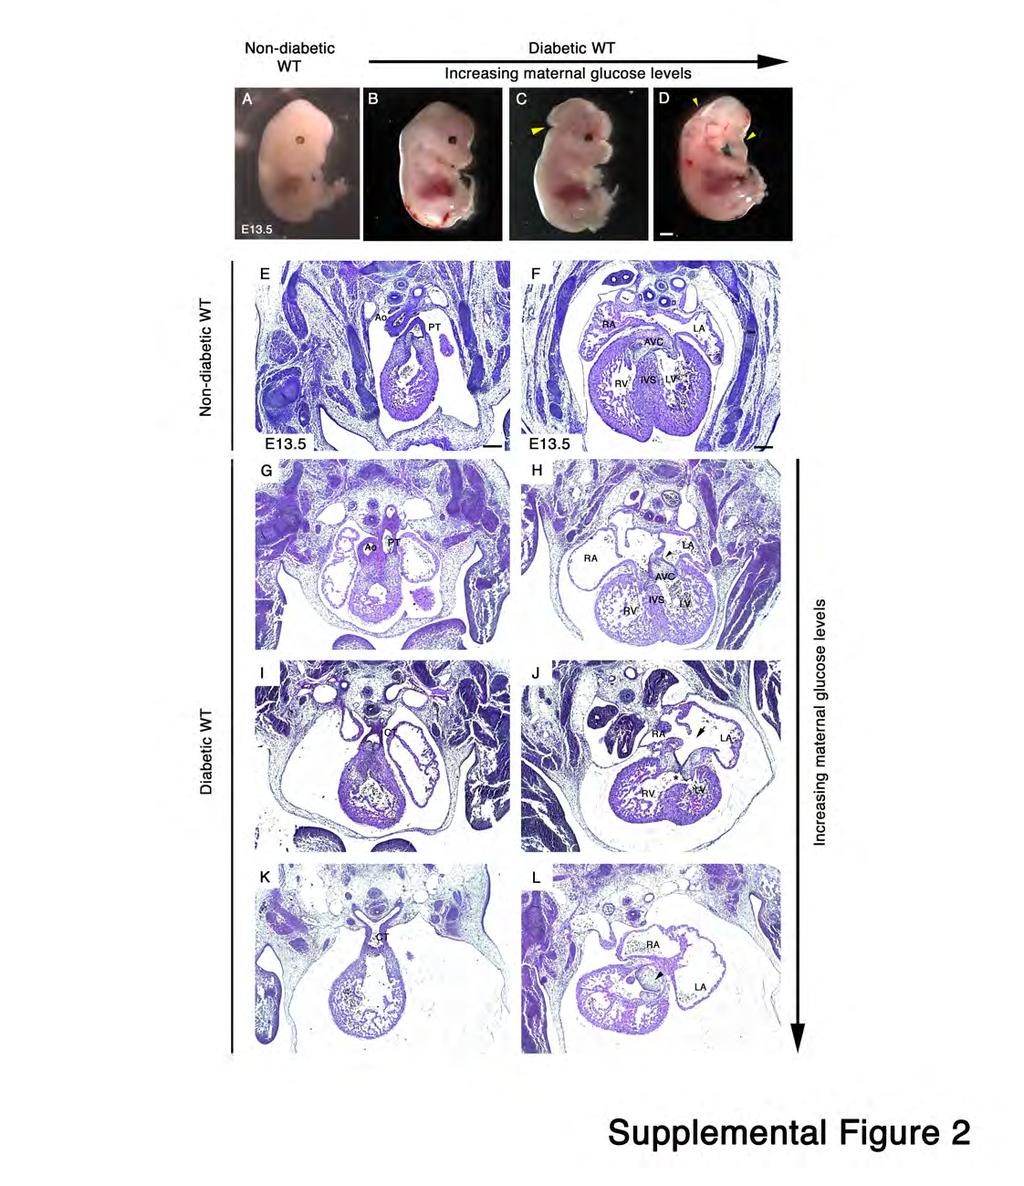
2 22 Supplemental Figure and Figure Legends: Supplemental Figure 1: Gene-environment interaction between MDM and Notch1. (A-D) Representative images of wildtype (WT) and Notch1 +/- E13.5 embryos from non-diabetic and diabetic mothers show no apparent growth retardation. (E, F) Three-dimensional reconstruction of E13.5 nondiabetic and diabetic WT heart (N=1 per group) using AMIRAv5.5 software showed the perimembranous VSD (*). AVC, Atrioventricular cushion (green); IVS, interventricular septum (red). 28 (G) Breeding scheme showing non-diabetic Notch1 +/- males crossed with diabetic (hyperglycemic, blood glucose >200mg/dl) WT females to test that resultant CHD phenotype is independent of maternal genetic background. (H-K) Representative histologic sections showing location of VSD (*) in E13.5 hearts (WT and Notch1 +/- ) exposed to maternal diabetes as compared to non-diabetic controls. Scale bars: (A-D) 1 mm and (H-K) 200 µm. RA, right atrium, LA, left atrium; RV, right ventricle; LV, left ventricle Supplemental Figure 2: Maternal hyperglycemic stress results in spectrum of birth defects in developing embryos. (B-D) General appearance of E13.5 embryos exposed to increasing level of maternal glucose (N=3, range of maternal blood glucose (mg/dl) = mg/dl at time of embryo collection) compared to non-diabetic wildtype (WT) control (A). Yellow arrowheads indicate craniofacial and neural tube defects (C, D). (E-L) Representative hematoxylin & eosin images of E13.5 heart sections demonstrate improper septation of outflow tract (I, K) compared to E and G, enlarged AV cushion (H, L, black arrowheads), septal defects (J, asterisk and black arrow) and myocardial wall thinning (H, J, L) compared to control embryos (E, F). Scale bars: (A-D) 1 mm and (E-L) 200 µm. RA,
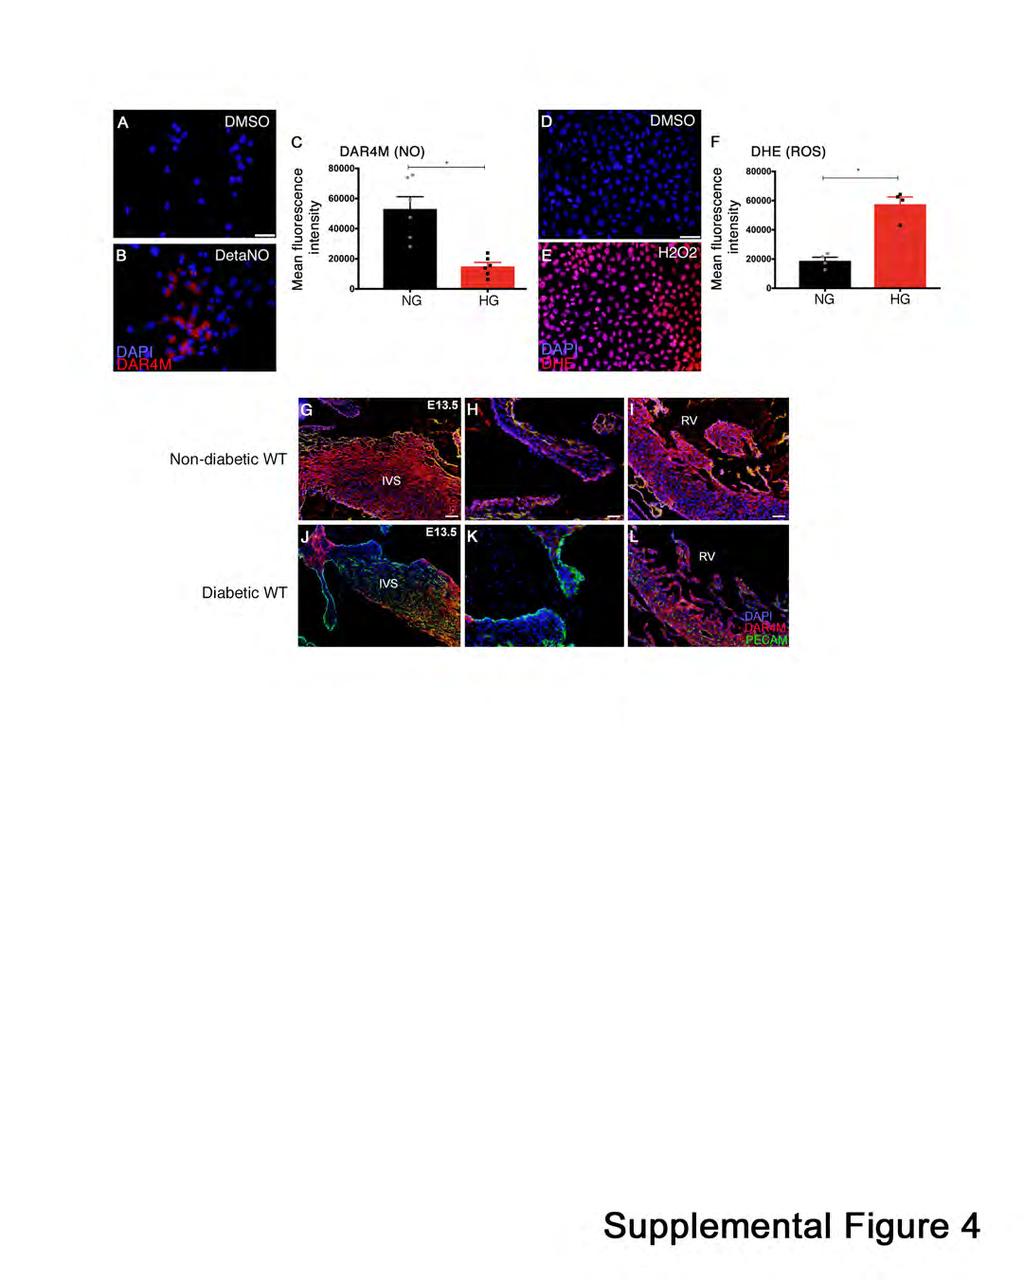
3 43 44 right atrium, LA, left atrium; RV, right ventricle; LV, left ventricle; Ao, Aorta; PT, Pulmonary trunk; CT, common trunk; AVC, Atrioventricular cushion; IVS, Intervetricular septum Supplemental Figure 3: Chromatin accessibility at Notch1 and its downstream target loci. (A) Integrative Genome Viewer (IGV) tracks showing ATAC-seq signals for four open regions (R1-R4) at Notch1 loci in NG (red) and HG (blue). (B-E) Chromatin accessibility at the proximal promoter regions of Hey2, EfnB2, Nrg1 and Jarid2 loci remain unaltered in HG compared in NG. Statistically significant changes in chromatin accessibility were found at the enhancer, downstream and intronic regions of Hey2, Efnb2 and Nrg1 respectively (peaks shown with asterisks) Supplemental Figure 4: Specificity of the probes and quantification of DAR-4M AM + and DHE + cells. AVM cells treated with (A, D) DMSO, (B) 250µM DetaNONOate and (E) 300µM H 2 O 2 served as negative and positive controls for DAR-4M AM and DHE staining, respectively, indicating the specificity of the dyes. (C, F) Quantification of mean fluorescence intensity of DAR4M + and DHE + cells in NG and HG (N>4). Data presented as mean±sem; *, p-value <0.05 by 2-tailed Student s t test. Scale bars: 50µm (A, B) and 100µm (D, E). (G-I) and (J-L) Endothelial cell-specific NO production was measured using DAR4M AM (red) staining in E13.5 non-diabetic and diabetes exposed embryos (N=1 per group) co-stained with PECAM (green) and nuclei stained with DAPI (blue). Scale bars: 100µm (G, I, J, L) and 50µm (H, K). 62
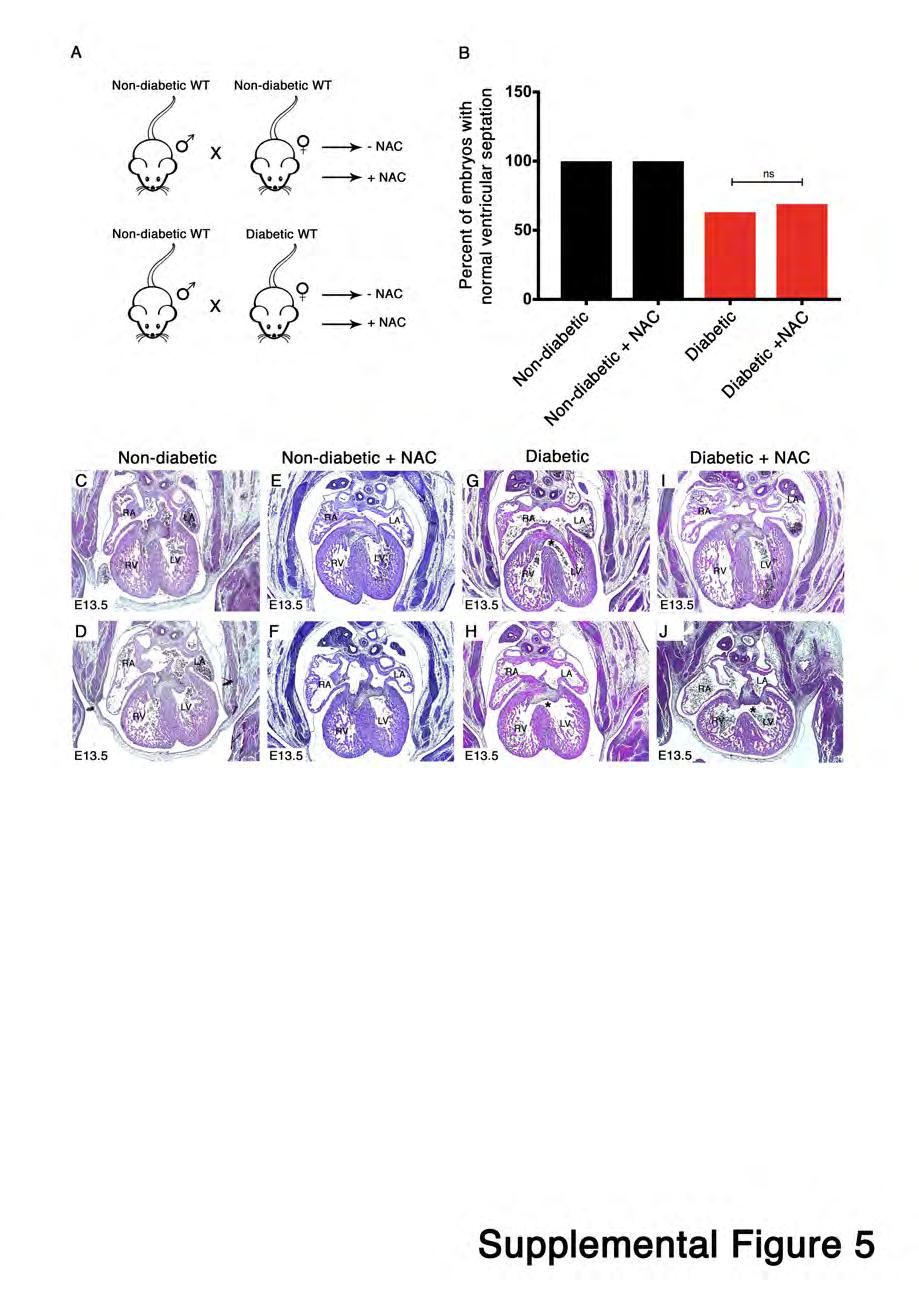
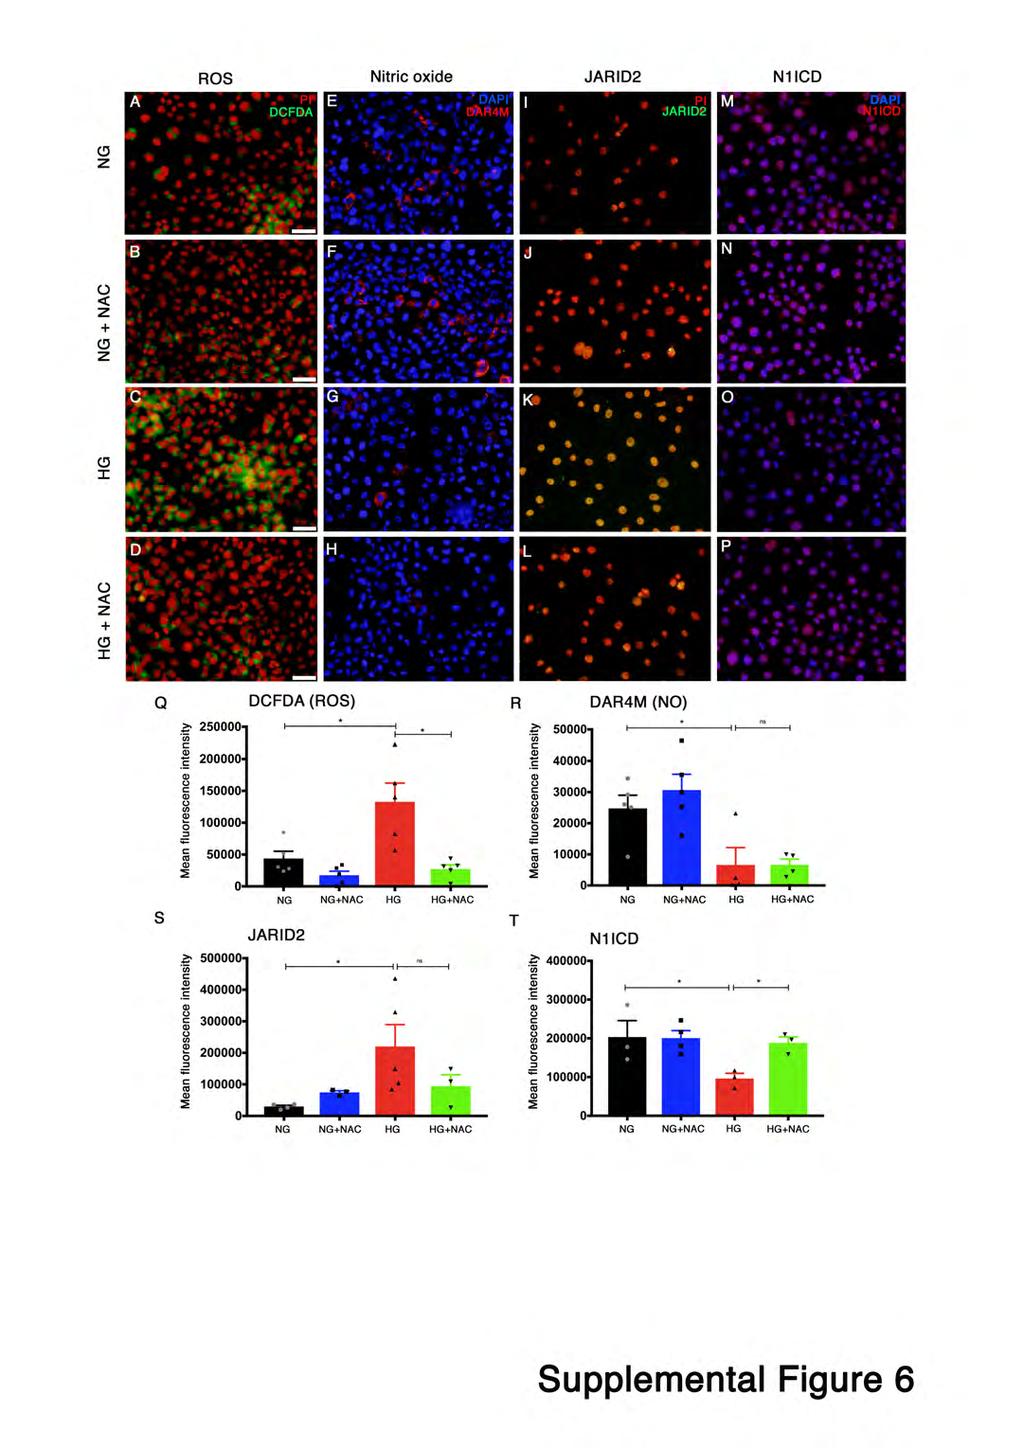
4 Supplemental Figure 5: Inability of N-acetyl cysteine mediated rescue of VSD phenotype in vivo: (A) Breeding scheme showing non-diabetic wildtype (WT) males crossed with non-diabetic (blood glucose = mg/dl at time of embryo harvest) and diabetic (blood glucose= mg/dl at time of embryo harvest) WT females and subset of these females were treated with N-acetyl cysteine (NAC). (B) No significant rescue was observed in the incidence of VSD among diabetic groups with (31%) or without (37%) treatment of NAC. No VSD was observed in non-diabetic control groups (0%). (G-J) Histologic sections showing location of ventricular septal defects (VSD, *) in E13.5 hearts from two 70 representative embryos exposed to maternal diabetes with or without NAC treatment. Non-diabetic wildtype (WT) control embryos are shown with normal ventricular septation. RA, right atrium, LA, left atrium; RV, right ventricle; LV, left ventricle. Scale bar: 200 µm Supplemental Figure 6: N-acetyl cysteine mediated rescue in vitro. AVM cells maintained in NG and HG were stained for (A-D) ROS generation using H 2 DCFDA (green) and (E-H) NO detected using DAR4M AM (red) after treatment with 5mM NAC and compared to untreated controls. (I-L) and (M-P) Immunofluorescent staining demonstrate JARID2 (green) and active NOTCH1 (N1ICD, red) expression in presence and absence of NAC. Propidium iodide (red, A-D; I-L) and DAPI (blue, E-H; M-P) stain the nuclei. Scale bar: 50µm. (Q-T) Quantification of mean fluorescent intensity of DCFDA, DAR4M, JARID2 and N1ICD staining by ImageJ. N>3, Data presented as mean±sem; *, p-value <0.05 by 2- tailed Student s t test
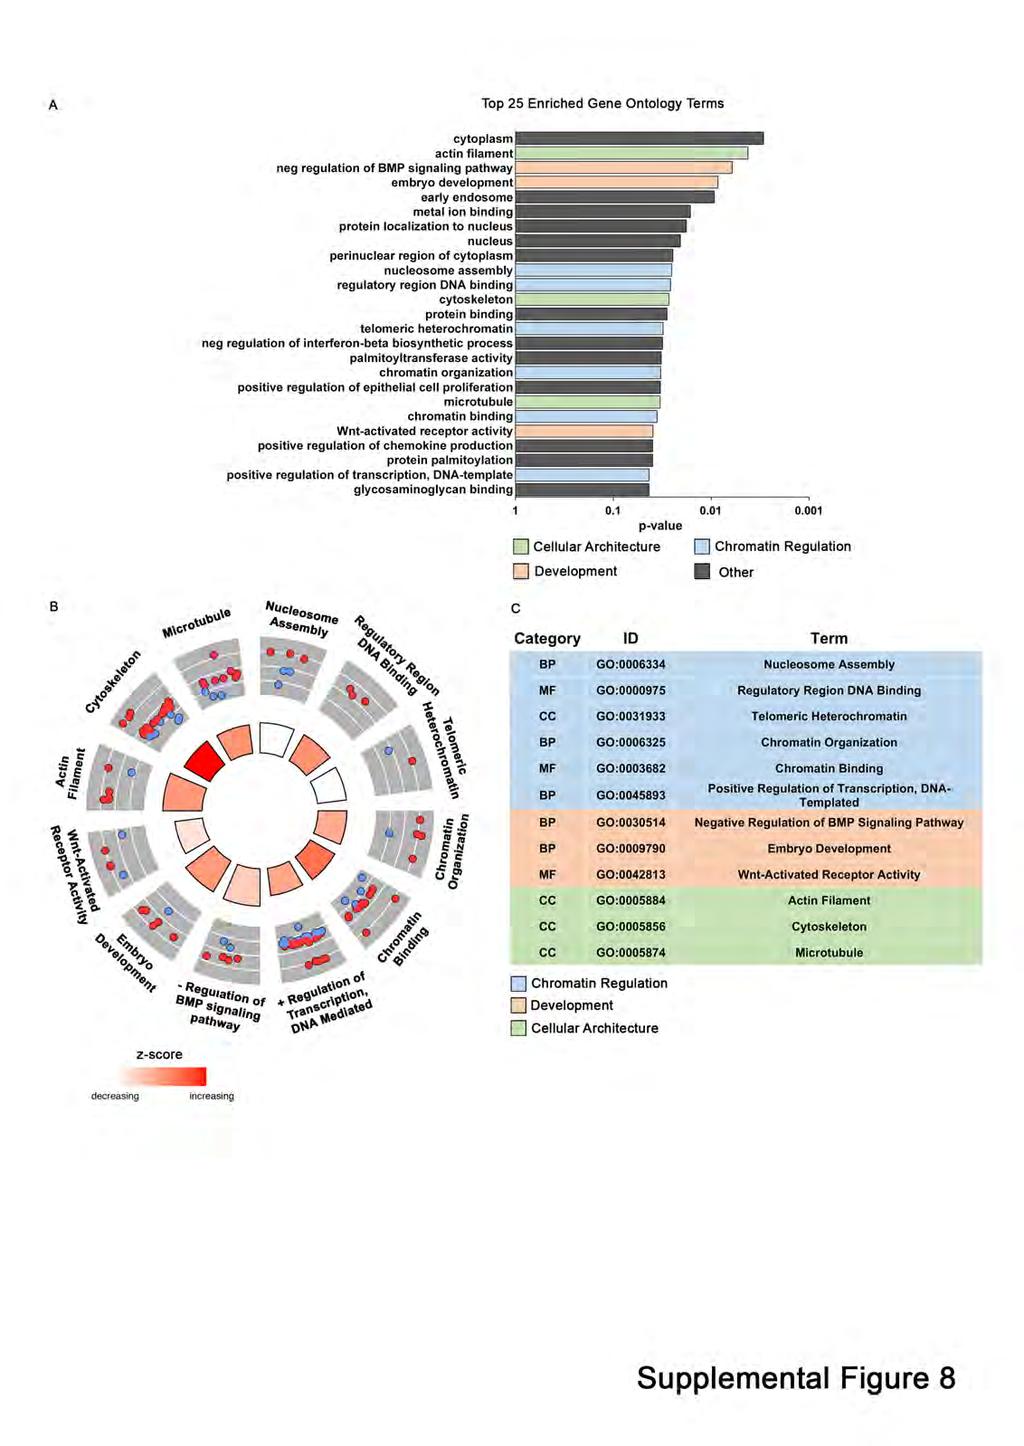
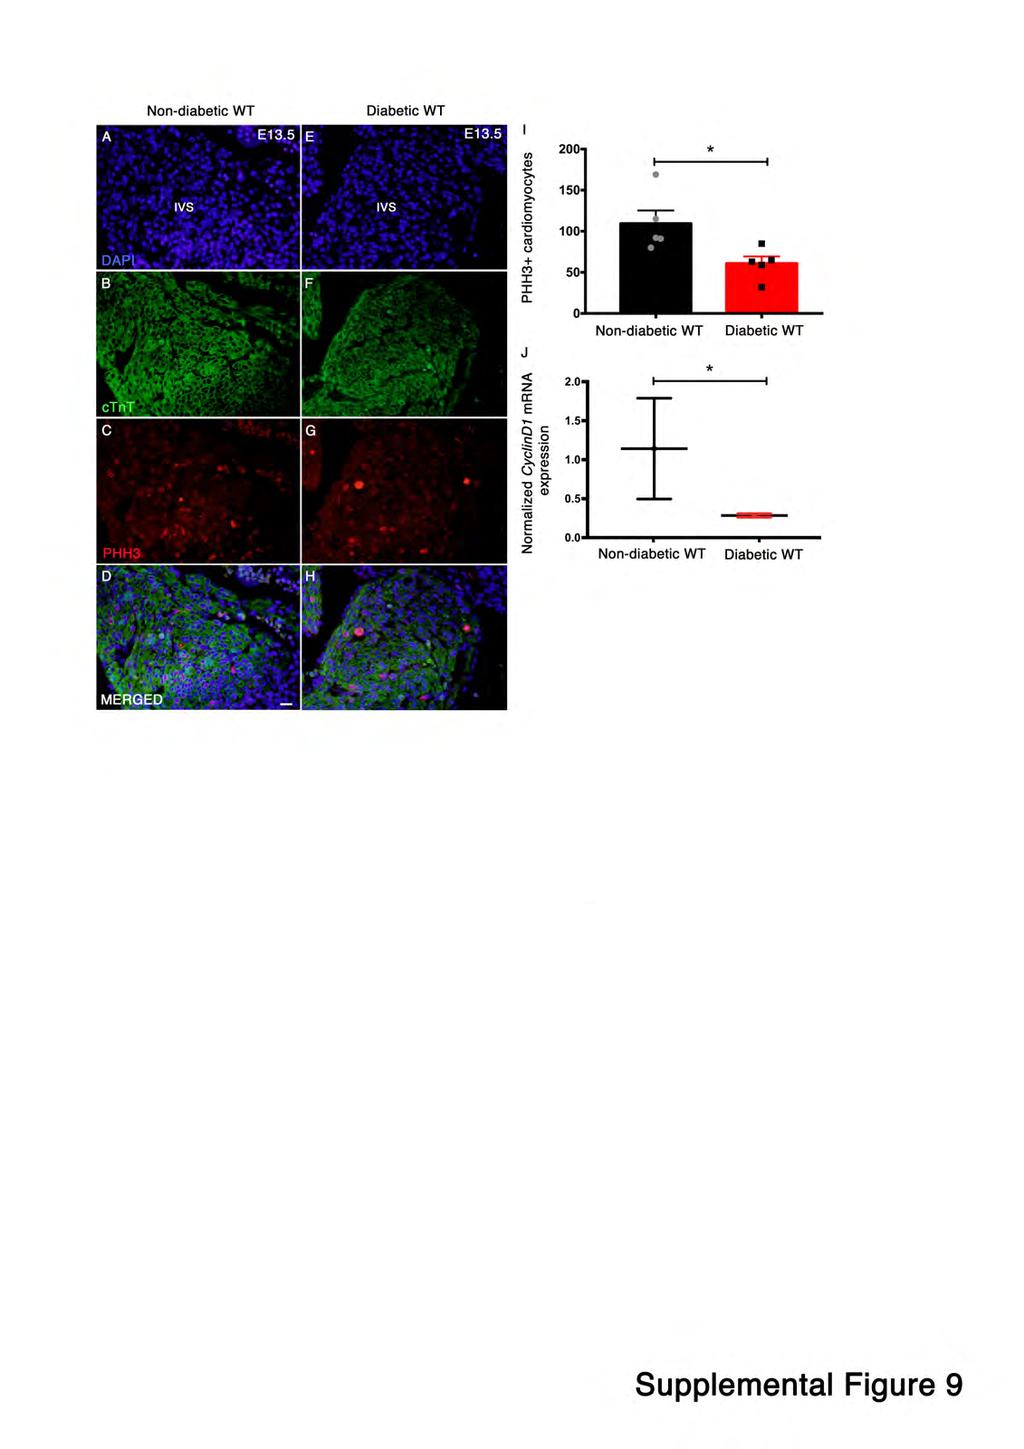
5 Supplemental Figure 7: RNAi transgene rescues shorter lifespan and cardiac phenotype in Drosophila maternal diabetic model. Survival curves for adult progenies those overexpressing heart specific Jarid2, Numb, Notch RNAi and Jarid2 RNAi transgenes are shown. Color-coding identifies exposure to maternal diabetes and presence of transgenes Supplemental Figure 8: In vitro ATAC-seq highlights top GO enriched terms altered in hyperglycemic stress. (A) Gene ontology analysis performed on genes associated with peaks in promoter regions, with p-value <0.05 and >1.5 fold change, highlights the 25 most significant GO terms. Green: Cellular Architecture, Blue: Chromatin Regulation, Pink: Development, Grey: Other. (B) Circle plot generated to highlight the 12 GO terms that fall within Chromatin Regulation (Blue), Development (Pink), or Cellular Architecture (Green) classifications (C). Within the circle plot, the colored dots represent gene associated peaks that are more open in high glucose (red) or more open in normal glucose (blue) within each GO term. The size of the rectangle in the inner circle represents the p- value, with larger rectangles equating to lower p-values. The color of the rectangle represents the z- score, blue and red representing low and high z-scores respectively. The z-score used in this analysis refers to the following equation: z-score = (# of peaks up - # of peaks down)/ (sqrt of total count), allowing for an inference in the overall change of the biological function Supplemental Figure 9: Hyperglycemia reduces cardiomyocytes proliferation at E13.5 embryos. (A-H) Immunofluorescent staining using phospho-histone H3 (PHH3, Ser10, red) demonstrates decreased cardiomyocyte proliferation in the interventricular septum (IVS) of the diabetic E13.5 WT embryonic hearts compared to non-diabetic controls (N=3 each group). ctnt staining (green) is shown to label cardiomyocytes and corresponding nucleus stained with DAPI (blue). Scale bar (A-H): 20 µm.
6 (I) Quantitation of PHH3 + cardiomyocytes demonstrated downregulation of cardiomyocyte proliferation between two groups. N=5. Data presented as mean±sem; *, p-value <0.05 by 2-tailed Student s t test. (J) Transcript expression of CyclinD1 is reduced in diabetic WT E13.5 embryonic hearts with respect to non-diabetic controls (N=6 whole hearts pooled together/ group) as measured with qrt-pcr. Data shown as average± SD; *, p-value <0.05 by 2-tailed Student s t test. 112
 (non-diabetic vs. diabetic) Non-diabetic Notch1 +/- (male) Diabetic WT (female) Notch1 +/- 8/9 (88%) WT 2/7 (28.7%) 0.")
7 113 Supplemental Tables: Supplemental Table 1: Incidence of VSD in E13.5 WT and Notch1 +/- embryos derived from Notch1 +/- male and WT diabetic female. Parental Genotype Embryo Embryos with Fisher Exact p-value Genotype VSD (%) (non-diabetic vs. diabetic) Non-diabetic Notch1 +/- (male) Diabetic WT (female) Notch1 +/- 8/9 (88%) WT 2/7 (28.7%) 0.035* 116 * indicates statistically significant 2-tailed p value<0.05; WT= wildtype 117 Supplemental Table 2: Full annotated ATAC-seq features in AVM cells treated with NG and HG Supplemental Table 3: Motif enrichment analysis of NG ATAC-seq dataset with HG set as background identified overrepresented known and de novo motifs respectively
8 Supplemental Table 4: Known and de novo transcription factor binding motifs enriched in NG compared to HG 127 Supplemental Table 5: TFBS profile for Nos3_R1 128 Supplemental Table 6: TFBS profile for Nos3_R2 129 Supplemental Table 7: TFBS profile for Nos3_R Supplemental Table 8: Incidence of VSD in E13.5 embryos with and without exposure to maternal diabetes and NAC treatment. Embryonic Maternal Embryos with p-value p-value Genotype Environment VSD (%) (non-diabetic (diabetic vs. vs. diabetic) diabetic +NAC) WT Non-diabetic 0/5 (0%) Non-diabetic+ NAC 0/9 (0%) NS - WT Diabetic 3/8 (37%) 0.036* Diabetic + NAC 5/16 (31%) 0.044* NS 132 * indicates statistically significant 2-tailed p value<0.05; WT= wildtype, NS=non-significant 133 Supplemental Table 9: TFBS profile for Jarid2_R1 134 Supplemental Table 10: TFBS profile for Jarid2_R2 135 Supplemental Table 11: TFBS profile for Jarid2_R3
9 136 Supplemental Table 12: TFBS profile for Notch1_R1 137 Supplemental Table 13: TFBS profile for Notch1_R2 138 Supplemental Table 14: TFBS profile for Notch1_R3 139 Supplemental Table 15: TFBS profile for Notch1_R Supplemental Table 16: Differential peaks within 1.5kb upstream and downstream of TSS, P- value<0.05 and >1.5fold change between NG and HG 142 Supplemental Table 17: Gene Ontology enriched terms 143 Supplemental Table 18: ATAC-seq index primer sequences: Index Primers Sequence 5-3 Ad1_noMx AATGATACGGCGACCACCGAGATCTACACTCGTCGGCAGCGTCAGATGTG Ad2.1_TAAGGCGA CAAGCAGAAGACGGCATACGAGATTCGCCTTAGTCTCGTGGGCTCGGAGATGT Ad2.2_CGTACTAG CAAGCAGAAGACGGCATACGAGATCTAGTACGGTCTCGTGGGCTCGGAGATGT Ad2.3_AGGCAGAA CAAGCAGAAGACGGCATACGAGATTTCTGCCTGTCTCGTGGGCTCGGAGATGT Ad2.4_TCCTGAGC CAAGCAGAAGACGGCATACGAGATGCTCAGGAGTCTCGTGGGCTCGGAGATGT Ad2.5_GGACTCCT CAAGCAGAAGACGGCATACGAGATAGGAGTCCGTCTCGTGGGCTCGGAGATGT Ad2.6_TAGGCATG CAAGCAGAAGACGGCATACGAGATCATGCCTAGTCTCGTGGGCTCGGAGATGT
10 146 Supplemental Table 19: Oligonucleotide sequences for gene expression Gene name Primer Name Sequence S mus_18s F.P ACGACCCATTCGAACGTCTGC mus_18s R.P GGACTCATTCCAATTACAGGG Gapdh mus_gapdh F.P GAAGGGCTCATGACCACAGT mus_gapdh R.P GATGCAGGGATGATGTTCTGG Notch1 mus_notch1 F.P CCAGGAAAGAGGGCATCAGA mus_notch1 R.P ACACTTCCAGCGTCTTTGGG Hey1 mus_hey1 F.P CCAGACTACAGCTCCTCAGATA mus_hey1 R.P CGCCGAACTCAAGTTTCCATT Hey2 mus_hey2 F.P CCTGGTCTCTCATCTCAGCA mus_hey2 R.P GGCCAGAGAGGAAGTCATTG Nrg1 mus_nrg1 F.P AAATCGCCCCCTTCGGAAAT mus_nrg1 R.P GTCACAAGAAGCAGAGGCCT EfnB2 mus_efnb2 F.P CATCACTTTGGTGGTGCTGC mus_efnb2 R.P CCATTGTTGTTGCCACCTCG Bmp10 mus_bmp10 F.P TGACCCTTTGCTGGTTGTGT
11 mus_bmp10 R.P ATCGGGCCCACTGAAGAAAG Jarid2 mus_jarid2 F.P CTGGCCTTCACTCTTCTGCA mus_jarid2 R.P GCAGATCTGGCACCTCCTTT Cyclin D1 mus_cyclind1 F.P GCCGAGAAGTTGTGCATCTA mus_cyclin D1 R.P GTTCACCAGAAGCAGTTCCA Nos3 mus_nos3 F.P ATTGGCATGAGGGACCTGTG mus_nos3 R.P GGTGTCCAGATCCATGCACA Supplemental Table 20: Oligonucleotide sequences for ChIP qpcr Gene name Primer Name Sequence 5-3 Nos3_R1F.P GAAACTCTGCCTCTGTCCGA Nos3_R1R.P TCACAGTGTCCAGAAGAGGG Nos3 Nos3_R2F.P Nos3_R2R.P TGAGTCACTTCAGAAGGCCA CTAGCTGCCGTTGTGATTCC Nos3_R3F.P GAGTATGAGAGAGGCCTCCA Nos3_R3R.P GTGGAAGGGCTCTAGTGTGT Notch1 Notch1ChIP_+1150 F.P ACTGCCTGCCCTTTCCTTAA
12 Notch1ChIP_+1150 R.P CCCACGCCATCTTAAAGAGC 149
13
14
15
16
17
18
19
20
21
Supplementary Figure S1 Enlarged coronary artery branches in Edn1-knockout mice. a-d, Coronary angiography by ink injection in wild-type (a, b) and
 and") Supplementary Figure S1 Enlarged coronary artery branches in Edn1-knockout mice. a-d, Coronary angiography by ink injection in wild-type (a, b) and Edn1-knockout (Edn1-KO) (c, d) hearts. The boxed areas
Supplementary Figure S1 Enlarged coronary artery branches in Edn1-knockout mice. a-d, Coronary angiography by ink injection in wild-type (a, b) and Edn1-knockout (Edn1-KO) (c, d) hearts. The boxed areas
Supplementary Figure 1. EC-specific Deletion of Snail1 Does Not Affect EC Apoptosis. (a,b) Cryo-sections of WT (a) and Snail1 LOF (b) embryos at
 Cryo-sections of WT (a) and Snail1 LOF (b) embryos at") Supplementary Figure 1. EC-specific Deletion of Snail1 Does Not Affect EC Apoptosis. (a,b) Cryo-sections of WT (a) and Snail1 LOF (b) embryos at E10.5 were double-stained for TUNEL (red) and PECAM-1 (green).
Supplementary Figure 1. EC-specific Deletion of Snail1 Does Not Affect EC Apoptosis. (a,b) Cryo-sections of WT (a) and Snail1 LOF (b) embryos at E10.5 were double-stained for TUNEL (red) and PECAM-1 (green).
SUPPLEMENTARY FIGURES
 SUPPLEMENTARY FIGURES 1 Supplementary Figure 1, Adult hippocampal QNPs and TAPs uniformly express REST a-b) Confocal images of adult hippocampal mouse sections showing GFAP (green), Sox2 (red), and REST
7SK ChIRP-seq is specifically RNA dependent and conserved between mice and humans.
 Supplementary Figure 1 7SK ChIRP-seq is specifically RNA dependent and conserved between mice and humans. Regions targeted by the Even and Odd ChIRP probes mapped to a secondary structure model 56 of the
Supplementary Figure 1. Baf60c and baf180 are induced during cardiac regeneration in zebrafish. RNA in situ hybridization was performed on paraffin
 Supplementary Figure 1. Baf60c and baf180 are induced during cardiac regeneration in zebrafish. RNA in situ hybridization was performed on paraffin sections from sham-operated adult hearts (a and i) and
"Lecture Index. 1) Heart Progenitors. 2) Cardiac Tube Formation. 3) Valvulogenesis and Chamber Formation. 4) Epicardium Development.
 Heart Progenitors. 2) Cardiac Tube Formation. 3) Valvulogenesis and Chamber Formation. 4) Epicardium Development.") "Lecture Index 1) Heart Progenitors. 2) Cardiac Tube Formation. 3) Valvulogenesis and Chamber Formation. 4) Epicardium Development. 5) Septation and Maturation. 6) Changes in Blood Flow during Development.
"Lecture Index 1) Heart Progenitors. 2) Cardiac Tube Formation. 3) Valvulogenesis and Chamber Formation. 4) Epicardium Development. 5) Septation and Maturation. 6) Changes in Blood Flow during Development.
Supplementary Figure S1. Gene expression analysis of epidermal marker genes and TP63.
 Supplementary Figure Legends Supplementary Figure S1. Gene expression analysis of epidermal marker genes and TP63. A. Screenshot of the UCSC genome browser from normalized RNAPII and RNA-seq ChIP-seq data
Fig. S1. Weight of embryos during development. Embryos are collected at different time points (E12.5, E14.5, E16.5 and E18.5) from matings between
 from matings between") Fig. S1. Weight of embryos during development. Embryos are collected at different time points (E12.5, E14.5, E16.5 and E18.5) from matings between Myod +/ or Myod / females and Myod +/ ;Igf2 +/ males and
Fig. S1. Weight of embryos during development. Embryos are collected at different time points (E12.5, E14.5, E16.5 and E18.5) from matings between Myod +/ or Myod / females and Myod +/ ;Igf2 +/ males and
Supplementary Materials for
 www.sciencesignaling.org/cgi/content/full/8/375/ra41/dc1 Supplementary Materials for Actin cytoskeletal remodeling with protrusion formation is essential for heart regeneration in Hippo-deficient mice
SUPPLEMENTARY INFORMATION
 1 SUPPLEMENTARY INFORMATION Mutations in the NOTCH pathway regulator MIB1 cause left ventricular noncompaction cardiomyopathy Guillermo Luxán, Jesús C. Casanova, Beatriz Martínez-Poveda, Belén Prados,
Sirt1 Hmg20b Gm (0.17) 24 (17.3) 877 (857)
 24 (17.3) 877 (857)") 3 (0.17) 24 (17.3) Sirt1 Hmg20 Gm4763 877 (857) c d Suppl. Figure 1. Screen validation for top candidate antagonists of Dot1L (a) Numer of genes with one (gray), two (cyan) or three (red) shrna scored
3 (0.17) 24 (17.3) Sirt1 Hmg20 Gm4763 877 (857) c d Suppl. Figure 1. Screen validation for top candidate antagonists of Dot1L (a) Numer of genes with one (gray), two (cyan) or three (red) shrna scored
Supplementary Figures
 Supplementary Figures Supplementary Figure 1. nrg1 bns101/bns101 embryos develop a functional heart and survive to adulthood (a-b) Cartoon of Talen-induced nrg1 mutation with a 14-base-pair deletion in
(a-r) Whole mount X-gal staining on a developmental time-course of hearts from
 Whole mount X-gal staining on a developmental time-course of hearts from") 1 2 3 4 5 6 7 8 9 10 11 12 13 14 15 16 Supplementary Figure 1 (a-r) Whole mount X-gal staining on a developmental time-course of hearts from Sema3d +/- ;Ephb4 LacZ/+ and Sema3d -/- ;Ephb4 LacZ/+ embryos.
1 2 3 4 5 6 7 8 9 10 11 12 13 14 15 16 Supplementary Figure 1 (a-r) Whole mount X-gal staining on a developmental time-course of hearts from Sema3d +/- ;Ephb4 LacZ/+ and Sema3d -/- ;Ephb4 LacZ/+ embryos.
Supplemental Information. Myocardial Polyploidization Creates a Barrier. to Heart Regeneration in Zebrafish
 Developmental Cell, Volume 44 Supplemental Information Myocardial Polyploidization Creates a Barrier to Heart Regeneration in Zebrafish Juan Manuel González-Rosa, Michka Sharpe, Dorothy Field, Mark H.
SUPPLEMENTARY INFORMATION
 doi:10.1038/nature10188 Supplementary Figure 1. Embryonic epicardial genes are down-regulated from midgestation stages and barely detectable post-natally. Real time qrt-pcr revealed a significant down-regulation
Journal of Molecular and Cellular Cardiology
 Journal of Molecular and Cellular Cardiology 60 (2013) 129 141 Contents lists available at SciVerse ScienceDirect Journal of Molecular and Cellular Cardiology journal homepage: www.elsevier.com/locate/yjmcc
Supplementary Table 1. The primers used for quantitative RT-PCR. Gene name Forward (5 > 3 ) Reverse (5 > 3 )
 Reverse (5 > 3 )") 770 771 Supplementary Table 1. The primers used for quantitative RT-PCR. Gene name Forward (5 > 3 ) Reverse (5 > 3 ) Human CXCL1 GCGCCCAAACCGAAGTCATA ATGGGGGATGCAGGATTGAG PF4 CCCCACTGCCCAACTGATAG TTCTTGTACAGCGGGGCTTG
770 771 Supplementary Table 1. The primers used for quantitative RT-PCR. Gene name Forward (5 > 3 ) Reverse (5 > 3 ) Human CXCL1 GCGCCCAAACCGAAGTCATA ATGGGGGATGCAGGATTGAG PF4 CCCCACTGCCCAACTGATAG TTCTTGTACAGCGGGGCTTG
Heart Development and Congenital Heart Disease
 Heart Development and Congenital Heart Disease Sally Dunwoodie s.dunwoodie@victorchang.edu.au Developmental and Stem Cell Biology Division Victor Chang Cardiac Research Institute for the heart of Australia...
Supplementary Figure 1. Efficiency of Mll4 deletion and its effect on T cell populations in the periphery. Nature Immunology: doi: /ni.
 Supplementary Figure 1 Efficiency of Mll4 deletion and its effect on T cell populations in the periphery. Expression of Mll4 floxed alleles (16-19) in naive CD4 + T cells isolated from lymph nodes and
Supplementary Figure 1 ITGB1 and ITGA11 increase with evidence for heterodimers following HSC activation. (a) Time course of rat HSC activation
 Time course of rat HSC activation") Supplementary Figure 1 ITGB1 and ITGA11 increase with evidence for heterodimers following HSC activation. (a) Time course of rat HSC activation indicated by the detection of -SMA and COL1 (log scale).
Supplementary Figure 1 ITGB1 and ITGA11 increase with evidence for heterodimers following HSC activation. (a) Time course of rat HSC activation indicated by the detection of -SMA and COL1 (log scale).
Type of file: PDF Title of file for HTML: Supplementary Information Description: Supplementary Figures and Supplementary Table.
 Type of file: PDF Title of file for HTML: Supplementary Information Description: Supplementary Figures and Supplementary Tale. Type of file: VI Title of file for HTML: Supplementary Movie 1 Description:
Supplemental Figure S1. Expression of Cirbp mrna in mouse tissues and NIH3T3 cells.
 SUPPLEMENTAL FIGURE AND TABLE LEGENDS Supplemental Figure S1. Expression of Cirbp mrna in mouse tissues and NIH3T3 cells. A) Cirbp mrna expression levels in various mouse tissues collected around the clock
Comparison of open chromatin regions between dentate granule cells and other tissues and neural cell types.
 Supplementary Figure 1 Comparison of open chromatin regions between dentate granule cells and other tissues and neural cell types. (a) Pearson correlation heatmap among open chromatin profiles of different
Development of the Heart
 Development of the Heart Thomas A. Marino, Ph.D. Temple University School of Medicine Stages of Development of the Heart 1. The horseshoe-shaped pericardial cavity. 2. The formation of the single heart
c Ischemia (30 min) Reperfusion (8 w) Supplementary Figure bp 300 bp Ischemia (30 min) Reperfusion (4 h) Dox 20 mg/kg i.p.
 Reperfusion (8 w) Supplementary Figure bp 300 bp Ischemia (30 min) Reperfusion (4 h) Dox 20 mg/kg i.p.") a Marker Ripk3 +/ 5 bp 3 bp b Ischemia (3 min) Reperfusion (4 h) d 2 mg/kg i.p. 1 w 5 w Sacrifice for IF size A subset for echocardiography and morphological analysis c Ischemia (3 min) Reperfusion (8
a Marker Ripk3 +/ 5 bp 3 bp b Ischemia (3 min) Reperfusion (4 h) d 2 mg/kg i.p. 1 w 5 w Sacrifice for IF size A subset for echocardiography and morphological analysis c Ischemia (3 min) Reperfusion (8
SUPPLEMENTARY INFORMATION
 Suppl. Fig. 1 in vivo expression of ISL1 in the human fetal heart. a, Hematoxylin eosin staining showing structures of left atrium and left atrium appendage (*) of a human fetal heart at 11 weeks of gestation.
SUPPLEMENTARY INFORMATION
 DOI: 10.1038/ncb2988 Supplementary Figure 1 Kif7 L130P encodes a stable protein that does not localize to cilia tips. (a) Immunoblot with KIF7 antibody in cell lysates of wild-type, Kif7 L130P and Kif7
SUPPLEMENTARY INFORMATION
 DOI: 10.1038/ncb2607 Figure S1 Elf5 loss promotes EMT in mammary epithelium while Elf5 overexpression inhibits TGFβ induced EMT. (a, c) Different confocal slices through the Z stack image. (b, d) 3D rendering
Congenital Heart Defects
 Normal Heart Congenital Heart Defects 1. Patent Ductus Arteriosus The ductus arteriosus connects the main pulmonary artery to the aorta. In utero, it allows the blood leaving the right ventricle to bypass
Tcf21 MCM ; R26 mtmg Sham GFP Col 1/3 TAC 8W TAC 2W. Postn MCM ; R26 mtmg Sham GFP Col 1/3 TAC 8W TAC 2W
 A Tcf21 MCM ; R26 mtmg Sham GFP Col 1/3 Tcf21 MCM ; R26 mtmg TAC 2W Tcf21 MCM ; R26 mtmg TAC 8W B Postn MCM ; R26 mtmg Sham GFP Col 1/3 Postn MCM ; R26 mtmg TAC 2W Postn MCM ; R26 mtmg TAC 8W Supplementary
Control. csarnt -/- Cre, f/f
 ody weight (g) A re,f/f re x f/f f/+ re, f/+ re,f/+ f/f x f/f f/+ cs -/- re, f/f re f/f re, f/f Normal chow Tamoxifen Tamoxifen Tamoxifen W 4W re f/f re, re/ff f/f re f/f re, re/ff f/f Normal chow Tamoxifen
Segmental Analysis. Gautam K. Singh, M.D. Washington University School of Medicine St. Louis
 Segmental Analysis Gautam K. Singh, M.D. Washington University School of Medicine St. Louis Segmental Analysis Segmental Analysis: From Veins to Ventricles Segmental Approach to Evaluation of Congenital
Supplementary Information
 Supplementary Information Supplementary Figure 1! a! b! Nfatc1!! Nfatc1"! P1! P2! pa1! pa2! ex1! ex2! exons 3-9! ex1! ex11!!" #" Nfatc1A!!" Nfatc1B! #"!" Nfatc1C! #" DN1! DN2! DN1!!A! #A!!B! #B!!C! #C!!A!
Probe. Hind III Q,!?R'!! /0!!!!D1"?R'! vector. Homologous recombination
 Supple-Zhang Page 1 Wild-type locus Targeting construct Targeted allele Exon Exon3 Exon Probe P1 P P3 FRT FRT loxp loxp neo vector amh I Homologous recombination neo P1 P P3 FLPe recombination Q,!?R'!!
Lung Met 1 Lung Met 2 Lung Met Lung Met H3K4me1. Lung Met H3K27ac Primary H3K4me1
 a Gained Met-VELs 1.5 1.5 -.5 Lung Met 1 Lung Met Lung Met 3 1. Lung Met H3K4me1 Lung Met H3K4me1 1 Lung Met H3K4me1 Lung Met H3K7ac 1.5 Lung Met H3K7ac Lung Met H3K7ac.8 Primary H3K4me1 Primary H3K7ac
Supplementary Information Titles Journal: Nature Medicine
 Supplementary Information Titles Journal: Nature Medicine Article Title: Corresponding Author: Supplementary Item & Number Supplementary Fig.1 Fig.2 Fig.3 Fig.4 Fig.5 Fig.6 Fig.7 Fig.8 Fig.9 Fig. Fig.11
Nature Neuroscience: doi: /nn Supplementary Figure 1. Neuron class-specific arrangements of Khc::nod::lacZ label in dendrites.
 Supplementary Figure 1 Neuron class-specific arrangements of Khc::nod::lacZ label in dendrites. Staining with fluorescence antibodies to detect GFP (Green), β-galactosidase (magenta/white). (a, b) Class
Zhu et al, page 1. Supplementary Figures
 Zhu et al, page 1 Supplementary Figures Supplementary Figure 1: Visual behavior and avoidance behavioral response in EPM trials. (a) Measures of visual behavior that performed the light avoidance behavior
EPIGENETIC RE-EXPRESSION OF HIF-2α SUPPRESSES SOFT TISSUE SARCOMA GROWTH
 EPIGENETIC RE-EXPRESSION OF HIF-2α SUPPRESSES SOFT TISSUE SARCOMA GROWTH Supplementary Figure 1. Supplementary Figure 1. Characterization of KP and KPH2 autochthonous UPS tumors. a) Genotyping of KPH2
Postn MCM Smad2 fl/fl Postn MCM Smad3 fl/fl Postn MCM Smad2/3 fl/fl. Postn MCM. Tgfbr1/2 fl/fl TAC
 A Smad2 fl/fl Smad3 fl/fl Smad2/3 fl/fl Tgfbr1/2 fl/fl 1. mm B Tcf21 MCM Tcf21 MCM Smad3 fl/fl Tcf21 MCM Smad2/3 fl/fl Tcf21 MCM Tgfbr1/2 fl/fl αmhc MCM C 1. mm 1. mm D Smad2 fl/fl Smad3 fl/fl Smad2/3
HISTORY. Question: What type of heart disease is suggested by this history? CHIEF COMPLAINT: Decreasing exercise tolerance.
 HISTORY 15-year-old male. CHIEF COMPLAINT: Decreasing exercise tolerance. PRESENT ILLNESS: A heart murmur was noted in childhood, but subsequent medical care was sporadic. Easy fatigability and slight
Nature Genetics: doi: /ng Supplementary Figure 1. Parameters and consequences of mononuclear cardiomyocyte frequency.
 Supplementary Figure 1 Parameters and consequences of mononuclear cardiomyocyte frequency. (a) Correlation of the frequency of mononuclear cardiomyocytes to the frequency of cardiomyocytes with three or
Supplementary Figure 1 Madm is not required in GSCs and hub cells. (a,b) Act-Gal4-UAS-GFP (a), Act-Gal4-UAS- GFP.nls (b,c) is ubiquitously expressed
 Act-Gal4-UAS-GFP (a), Act-Gal4-UAS- GFP.nls (b,c) is ubiquitously expressed") Supplementary Figure 1 Madm is not required in GSCs and hub cells. (a,b) Act-Gal4-UAS-GFP (a), Act-Gal4-UAS- GFP.nls (b,c) is ubiquitously expressed in the testes. The testes were immunostained with GFP
Supplementary Figure 1 Madm is not required in GSCs and hub cells. (a,b) Act-Gal4-UAS-GFP (a), Act-Gal4-UAS- GFP.nls (b,c) is ubiquitously expressed in the testes. The testes were immunostained with GFP
Appendix II: ECHOCARDIOGRAPHY ANALYSIS
 Appendix II: ECHOCARDIOGRAPHY ANALYSIS Two-Dimensional (2D) imaging was performed using the Vivid 7 Advantage cardiovascular ultrasound system (GE Medical Systems, Milwaukee) with a frame rate of 400 frames
islets scored 1 week month months
 Supplementary Table 1. Sampling parameters for the morphometrical analyses Time (post- DT) Control mice (age-matched) α-cells mice pancreatic surface (mm 2 ) scored DT-treated mice islets scored mice pancreatic
Nature Genetics: doi: /ng Supplementary Figure 1. Assessment of sample purity and quality.
 Supplementary Figure 1 Assessment of sample purity and quality. (a) Hematoxylin and eosin staining of formaldehyde-fixed, paraffin-embedded sections from a human testis biopsy collected concurrently with
Supplementary Materials for
 www.sciencesignaling.org/cgi/content/full/10/487/eaag2476/dc1 Supplementary Materials for Gene expression profiles of brain endothelial cells during embryonic development at bulk and single-cell levels
Figure S1. (A) Schematic diagram of dnrar transgene allele. (B) X-Gal staining of testis from
 Schematic diagram of dnrar transgene allele. (B) X-Gal staining of testis from") Figure S1. (A) Schematic diagram of dnrar transgene allele. (B) X-Gal staining of testis from germ cell mutants (dnrar flox/flox, Stra8-Cre +, RARElacZ) (A ), controls (dnrar flox/flox, RARElacZ) (B ),
Figure S1. (A) Schematic diagram of dnrar transgene allele. (B) X-Gal staining of testis from germ cell mutants (dnrar flox/flox, Stra8-Cre +, RARElacZ) (A ), controls (dnrar flox/flox, RARElacZ) (B ),
CARDIAC DEVELOPMENT CARDIAC DEVELOPMENT
 CARDIAC DEVELOPMENT CARDIAC DEVELOPMENT Diane E. Spicer, BS, PA(ASCP) University of Florida Dept. of Pediatric Cardiology Curator Van Mierop Cardiac Archive This lecture is given with special thanks to
Effects of UBL5 knockdown on cell cycle distribution and sister chromatid cohesion
 Supplementary Figure S1. Effects of UBL5 knockdown on cell cycle distribution and sister chromatid cohesion A. Representative examples of flow cytometry profiles of HeLa cells transfected with indicated
Supplementary Figures
 J. Cell Sci. 128: doi:10.1242/jcs.173807: Supplementary Material Supplementary Figures Fig. S1 Fig. S1. Description and/or validation of reagents used. All panels show Drosophila tissues oriented with
Supplementary Figure 1: Signaling centers contain few proliferating cells, express p21, and
 Supplementary Figure 1: Signaling centers contain few proliferating cells, express p21, and exclude YAP from the nucleus. (a) Schematic diagram of an E10.5 mouse embryo. (b,c) Sections at B and C in (a)
p = formed with HCI-001 p = Relative # of blood vessels that formed with HCI-002 Control Bevacizumab + 17AAG Bevacizumab 17AAG
 A.. Relative # of ECs associated with HCI-001 1.4 1.2 1.0 0.8 0.6 0.4 0.2 0.0 ol b p < 0.001 Relative # of blood vessels that formed with HCI-001 1.4 1.2 1.0 0.8 0.6 0.4 0.2 0.0 l b p = 0.002 Control IHC:
Supplementary Materials for
 advances.sciencemag.org/cgi/content/full/3/8/e1701143/dc1 Supplementary Materials for Impaired DNA replication derepresses chromatin and generates a transgenerationally inherited epigenetic memory Adam
a) List of KMTs targeted in the shrna screen. The official symbol, KMT designation,
 List of KMTs targeted in the shrna screen. The official symbol, KMT designation,") Supplementary Information Supplementary Figures Supplementary Figure 1. a) List of KMTs targeted in the shrna screen. The official symbol, KMT designation, gene ID and specifities are provided. Those highlighted
Supplementary Information Supplementary Figures Supplementary Figure 1. a) List of KMTs targeted in the shrna screen. The official symbol, KMT designation, gene ID and specifities are provided. Those highlighted
Developmental SHP2 dysfunction underlies cardiac hypertrophy in Noonan syndrome with multiple lentigines
 Developmental SHP2 dysfunction underlies cardiac hypertrophy in Noonan syndrome with multiple lentigines Jessica Lauriol,, Kyu-Ho Lee, Maria I. Kontaridis J Clin Invest. 2016;126(8):2989-3005. https://doi.org/10.1172/jci80396.
Supplemental Table S1. Primers used in qrt-pcr analyses. Supplemental Figure S1, related to Figure 4. Extracellular matrix proteins
 Supplemental Material PDGFRb regulates craniofacial development through homodimers and functional heterodimers with PDGFRa Katherine A. Fantauzzo and Philippe Soriano Supplemental materials provided: Supplemental
s u p p l e m e n ta ry i n f o r m at i o n
 Figure S1 Characterization of tet-off inducible cell lines expressing GFPprogerin and GFP-wt lamin A. a, Western blot analysis of GFP-progerin- or GFP-wt lamin A- expressing cells before induction (0d)
Moore-Morris et al. Supplemental Table 1.
 Moore-Morris et al. Supplemental Table. In vivo echocardiographic assessment of cardiac size and function following transaortic constriction (T) at 7d and 8d. SHM 7d N=6 T 7d N=5 SHM 8d N= T 8d N=6 W,
Nature Immunology: doi: /ni Supplementary Figure 1. DNA-methylation machinery is essential for silencing of Cd4 in cytotoxic T cells.
 Supplementary Figure 1 DNA-methylation machinery is essential for silencing of Cd4 in cytotoxic T cells. (a) Scheme for the retroviral shrna screen. (b) Histogram showing CD4 expression (MFI) in WT cytotoxic
Broad H3K4me3 is associated with increased transcription elongation and enhancer activity at tumor suppressor genes
 Broad H3K4me3 is associated with increased transcription elongation and enhancer activity at tumor suppressor genes Kaifu Chen 1,2,3,4,5,10, Zhong Chen 6,10, Dayong Wu 6, Lili Zhang 7, Xueqiu Lin 1,2,8,
Supplementary Figure 1: Hsp60 / IEC mice are embryonically lethal (A) Light microscopic pictures show mouse embryos at developmental stage E12.
 Light microscopic pictures show mouse embryos at developmental stage E12.") Supplementary Figure 1: Hsp60 / IEC mice are embryonically lethal (A) Light microscopic pictures show mouse embryos at developmental stage E12.5 and E13.5 prepared from uteri of dams and subsequently genotyped.
Supplementary Figure 1: Hsp60 / IEC mice are embryonically lethal (A) Light microscopic pictures show mouse embryos at developmental stage E12.5 and E13.5 prepared from uteri of dams and subsequently genotyped.
Fig. S1. Upregulation of K18 and K14 mrna levels during ectoderm specification of hescs. Quantitative real-time PCR analysis of mrna levels of OCT4
 Fig. S1. Upregulation of K18 and K14 mrna levels during ectoderm specification of hescs. Quantitative real-time PCR analysis of mrna levels of OCT4 (n=3 independent differentiation experiments for each
Supplemental Information. Tissue Myeloid Progenitors Differentiate. into Pericytes through TGF-b Signaling. in Developing Skin Vasculature
 Cell Reports, Volume 18 Supplemental Information Tissue Myeloid Progenitors Differentiate into Pericytes through TGF-b Signaling in Developing Skin Vasculature Tomoko Yamazaki, Ani Nalbandian, Yutaka Uchida,
T H E J O U R N A L O F C E L L B I O L O G Y
 T H E J O U R N A L O F C E L L B I O L O G Y Supplemental material Amelio et al., http://www.jcb.org/cgi/content/full/jcb.201203134/dc1 Figure S1. mir-24 regulates proliferation and by itself induces
Making Sense of Cardiac Views and Imaging Characteristics for 13 Congenital Heart Defects (CHDs)
") Making Sense of Cardiac Views and Imaging Characteristics for 13 Congenital Heart Defects (CHDs) Manny Gaziano, MD, FACOG obimages.net obimages.net@gmail.com Acknowledgements: Krista Wald, RDMS, sonographer,
Making Sense of Cardiac Views and Imaging Characteristics for 13 Congenital Heart Defects (CHDs) Manny Gaziano, MD, FACOG obimages.net obimages.net@gmail.com Acknowledgements: Krista Wald, RDMS, sonographer,
Supplemental Information. Otic Mesenchyme Cells Regulate. Spiral Ganglion Axon Fasciculation. through a Pou3f4/EphA4 Signaling Pathway
 Neuron, Volume 73 Supplemental Information Otic Mesenchyme Cells Regulate Spiral Ganglion Axon Fasciculation through a Pou3f4/EphA4 Signaling Pathway Thomas M. Coate, Steven Raft, Xiumei Zhao, Aimee K.
GFP/Iba1/GFAP. Brain. Liver. Kidney. Lung. Hoechst/Iba1/TLR9!
 Supplementary information a +KA Relative expression d! Tlr9 5!! 5! NSC Neuron Astrocyte Microglia! 5! Tlr7!!!! NSC Neuron Astrocyte! GFP/Sβ/! Iba/Hoechst Microglia e Hoechst/Iba/TLR9! GFP/Iba/GFAP f Brain
Supplemental Information. Figures. Figure S1
 Supplemental Information Figures Figure S1 Identification of JAGGER T-DNA insertions. A. Positions of T-DNA and Ds insertions in JAGGER are indicated by inverted triangles, the grey box represents the
The Ciliary Protein Ftm Is Required for Ventricular Wall and Septal Development
 The Ciliary Protein Ftm Is Required for Ventricular Wall and Septal Development Christoph Gerhardt, Johanna M. Lier, Stefanie Kuschel, Ulrich Rüther* Institute for Animal Developmental and Molecular Biology,
Supplementary Figure 1. IDH1 and IDH2 mutation site sequences on WHO grade III
 Supplementary Materials: Supplementary Figure 1. IDH1 and IDH2 mutation site sequences on WHO grade III patient samples. Genomic DNA samples extracted from punch biopsies from either FFPE or frozen tumor
Supplemental Figure S1. RANK expression on human lung cancer cells.
 Supplemental Figure S1. RANK expression on human lung cancer cells. (A) Incidence and H-Scores of RANK expression determined from IHC in the indicated primary lung cancer subgroups. The overall expression
Nature Immunology: doi: /ni eee Supplementary Figure 1
 eee Supplementary Figure 1 Hyphae induce NET release, but yeast do not. (a) NET release by human peripheral neutrophils stimulated with a hgc1 yeast-locked C. albicans mutant (yeast) or pre-formed WT C.
Morphogenesis of the right ventricle requires myocardial expression of Gata4
 Research article Morphogenesis of the right ventricle requires myocardial expression of Gata4 Elisabeth M. Zeisberg, 1,2 Qing Ma, 3 Amy L. Juraszek, 3,4 Kelvin Moses, 5 Robert J. Schwartz, 5 Seigo Izumo,
Cardiac ultrasound protocols
 Cardiac ultrasound protocols IDEXX Telemedicine Consultants Two-dimensional and M-mode imaging planes Right parasternal long axis four chamber Obtained from the right side Displays the relative proportions
Figure S1A. Blood glucose levels in mice after glucose injection
 ## Figure S1A. Blood glucose levels in mice after glucose injection Blood glucose (mm/l) 25 2 15 1 5 # 15 3 6 3+3 Time after glucose injection (min) # Figure S1B. α-kg levels in mouse livers after glucose
Supplementary Figure 1 (Related with Figure 4). Molecular consequences of Eed deletion. (a) ChIP analysis identifies 3925 genes that are associated
. Molecular consequences of Eed deletion. (a) ChIP analysis identifies 3925 genes that are associated") Supplementary Figure 1 (Related with Figure 4). Molecular consequences of Eed deletion. (a) ChIP analysis identifies 3925 genes that are associated with the H3K27me3 mark in chondrocytes (see Table S1,
Supplementary Figure 1 (Related with Figure 4). Molecular consequences of Eed deletion. (a) ChIP analysis identifies 3925 genes that are associated with the H3K27me3 mark in chondrocytes (see Table S1,
Supplementary Figure 1 Validation of Per2 deletion in neuronal cells in N Per2 -/- mice. (a) Western blot from liver extracts of mice held under ad
 Western blot from liver extracts of mice held under ad") Supplementary Figure 1 Validation of Per2 deletion in neuronal cells in N Per2 -/- mice. (a) Western blot from liver extracts of mice held under ad libitum conditions detecting PER2 protein in brain and
Supplementary Figure 1 Validation of Per2 deletion in neuronal cells in N Per2 -/- mice. (a) Western blot from liver extracts of mice held under ad libitum conditions detecting PER2 protein in brain and
Notes: 1)Membranous part contribute in the formation of small portion in the septal cusp.
Membranous part contribute in the formation of small portion in the septal cusp.") Embryology 9 : Slide 16 : There is a sulcus between primitive ventricular and bulbis cordis that will disappear gradually and lead to the formation of one chamber which is called bulboventricular chamber.
Embryology 9 : Slide 16 : There is a sulcus between primitive ventricular and bulbis cordis that will disappear gradually and lead to the formation of one chamber which is called bulboventricular chamber.
SUPPLEMENTARY INFORMATION
 doi:10.1038/nature12652 Supplementary Figure 1. PRDM16 interacts with endogenous EHMT1 in brown adipocytes. Immunoprecipitation of PRDM16 complex by flag antibody (M2) followed by Western blot analysis
Adult Congenital Heart Disease: What All Echocardiographers Should Know Sharon L. Roble, MD, FACC Echo Hawaii 2016
 1 Adult Congenital Heart Disease: What All Echocardiographers Should Know Sharon L. Roble, MD, FACC Echo Hawaii 2016 DISCLOSURES I have no disclosures relevant to today s talk 2 Why should all echocardiographers
Nature Immunology: doi: /ni Supplementary Figure 1. Characteristics of SEs in T reg and T conv cells.
 Supplementary Figure 1 Characteristics of SEs in T reg and T conv cells. (a) Patterns of indicated transcription factor-binding at SEs and surrounding regions in T reg and T conv cells. Average normalized
Supplementary Figures
 Supplementary Figures Supplementary Figure 1. Confirmation of Dnmt1 conditional knockout out mice. a, Representative images of sorted stem (Lin - CD49f high CD24 + ), luminal (Lin - CD49f low CD24 + )
Figure legends Supplemental Fig.1. Glucose-induced insulin secretion and insulin content of islets. Supplemental Fig. 2.
 Figure legends Supplemental Fig.. Glucose-induced insulin secretion and insulin content of islets. Insulin secretory responses to.,., and. mm glucose (A) (n = 7-), and the insulin content in the islets
SUPPLEMENTARY INFORMATION
 DOI:.38/ncb3399 a b c d FSP DAPI 5mm mm 5mm 5mm e Correspond to melanoma in-situ Figure a DCT FSP- f MITF mm mm MlanaA melanoma in-situ DCT 5mm FSP- mm mm mm mm mm g melanoma in-situ MITF MlanaA mm mm
Heart and Soul Evaluation of the Fetal Heart
 Heart and Soul Evaluation of the Fetal Heart Ivana M. Vettraino, M.D., M.B.A. Clinical Associate Professor, Michigan State University College of Human Medicine Objectives Review the embryology of the formation
Supporting Information
 Supporting Information M1 macrophage-derived nanovesicles potentiate the anticancer efficacy of immune checkpoint inhibitors Yeon Woong Choo, 1, Mikyung Kang, 2, Han Young Kim, 1 Jin Han, 1 Seokyung Kang,
Computational Analysis of UHT Sequences Histone modifications, CAGE, RNA-Seq
 Computational Analysis of UHT Sequences Histone modifications, CAGE, RNA-Seq Philipp Bucher Wednesday January 21, 2009 SIB graduate school course EPFL, Lausanne ChIP-seq against histone variants: Biological
Multimodality Imaging of Anomalous Left Coronary Artery from the Pulmonary
 1 IMAGES IN CARDIOVASCULAR ULTRASOUND 2 3 4 Multimodality Imaging of Anomalous Left Coronary Artery from the Pulmonary Artery 5 6 7 Byung Gyu Kim, MD 1, Sung Woo Cho, MD 1, Dae Hyun Hwang, MD 2 and Jong
SUPPLEMENTARY INFORMATION
 DOI: 10.1038/ncb2638 Figure S1 Morphological characteristics of fetal testes and ovaries from 6.5-20 developmental weeks. Representative images of Hematoxylin and Eosin staining of testes and ovaries over
Heart and Lungs. LUNG Coronal section demonstrates relationship of pulmonary parenchyma to heart and chest wall.
 Heart and Lungs Normal Sonographic Anatomy THORAX Axial and coronal sections demonstrate integrity of thorax, fetal breathing movements, and overall size and shape. LUNG Coronal section demonstrates relationship
hemodynamic stress. A. Echocardiographic quantification of cardiac dimensions and function in
 SUPPLEMENTAL FIGURE LEGENDS Supplemental Figure 1. Fbn1 C1039G/+ hearts display normal cardiac function in the absence of hemodynamic stress. A. Echocardiographic quantification of cardiac dimensions and
Supplemental Figure 1: Leydig cells are reduced at multiple stages in both male sterile mutants
 SUPPLEMENTAL FIGURE LEGENDS: Supplemental Figure 1: Leydig cells are reduced at multiple stages in both male sterile mutants (Sgpl1 -/- and Plekha1 -/- ). Using an antibody against CYP11a1 to label Leydig
SUPPLEMENTARY INFORMATION
 Figure S1 Treatment with both Sema6D and Plexin-A1 sirnas induces the phenotype essentially identical to that induced by treatment with Sema6D sirna alone or Plexin-A1 sirna alone. (a,b) The cardiac tube
Supplementary Figure 1. Nature Neuroscience: doi: /nn.4547
 Supplementary Figure 1 Characterization of the Microfetti mouse model. (a) Gating strategy for 8-color flow analysis of peripheral Ly-6C + monocytes from Microfetti mice 5-7 days after TAM treatment. Living
ISSN: CODEN Code: PIHNBQ ZDB-Number: IC Journal No: Vol. 2 No Online Available at
 Received: 13-05-2013 Accepted: 16-06-2013 ISSN: 2277-7695 CODEN Code: PIHNBQ ZDB-Number: 2663038-2 IC Journal No: 7725 Vol. 2 No. 5 2013 Online Available at www.thepharmajournal.com THE PHARMA INNOVATION
Supplemental Figure 1. Quantification of proliferation in thyroid of WT, Ctns -/- and grafted
 Supplemental Figure 1. Quantification of proliferation in thyroid of WT, Ctns -/- and grafted Ctns -/- mice. Cells immunolabeled for the proliferation marker (Ki-67) were counted in sections (n=3 WT, n=4
HISTORY. Question: What category of heart disease is suggested by this history? CHIEF COMPLAINT: Heart murmur present since early infancy.
 HISTORY 18-year-old man. CHIEF COMPLAINT: Heart murmur present since early infancy. PRESENT ILLNESS: Although normal at birth, a heart murmur was heard at the six week check-up and has persisted since
fl/+ KRas;Atg5 fl/+ KRas;Atg5 fl/fl KRas;Atg5 fl/fl KRas;Atg5 Supplementary Figure 1. Gene set enrichment analyses. (a) (b)
 (b)") KRas;At KRas;At KRas;At KRas;At a b Supplementary Figure 1. Gene set enrichment analyses. (a) GO gene sets (MSigDB v3. c5) enriched in KRas;Atg5 fl/+ as compared to KRas;Atg5 fl/fl tumors using gene set
KRas;At KRas;At KRas;At KRas;At a b Supplementary Figure 1. Gene set enrichment analyses. (a) GO gene sets (MSigDB v3. c5) enriched in KRas;Atg5 fl/+ as compared to KRas;Atg5 fl/fl tumors using gene set
Maoqing Ye, Yan Yin, Kazumi Fukatsu, and Paul Grossfeld
 Evidence That Deletion of ETS-1, a Gene in the Jacobsen Syndrome (11q-) Cardiac Critical Region, Causes Congenital Heart Defects through Impaired Cardiac Neural Crest Cell Function 52 Maoqing Ye, Yan Yin,