Nature Immunology: doi: /ni Supplementary Figure 1
|
|
|
- Lee Beasley
- 5 years ago
- Views:
Transcription
1 Supplementary Figure 1 NLRP12 is downregulated in biopsy samples from patients with active ulcerative colitis (UC). (a-g) NLRP12 expression in 7 UC mrna profiling studies deposited in NCBI GEO database. Disease stages, GEO accession numbers, subject tissues for mrna purification, therapeutic treatments including corticosteroid or anti-tnf (infliximab) and mrna measuring microarrays and sequencer platforms are listed. For (a), n=5/group; (b), healthy (n=6), UC nonresponse (n=13), UC response (n=8); (c) healthy (n=20), active UC (n=15), inactive UC (n=18); (d) healthy (n=12), active UC (n=13); (e) n=20/group; (f) healthy (n=6), UC before treatment (n=20), UC response to treatment (n=8); (g) healthy (n=42), UC (n=40). Error bars show SEM. *p<0.05, **p<0.01 and n.s. means no significance determined by two-tailed unpaired t test.
 DAI and (b) colon length (n=17/group) of conventionally-raised mice treated with 3% DSS, compiled from 3 independent experiments.")
2 Supplementary Figure 2 Conventionally raised Nlrp12 / mice display exacerbated colitis. (a) DAI and (b) colon length (n=17/group) of conventionally-raised mice treated with 3% DSS, compiled from 3 independent experiments. (c) Representative images of H&E-stained colons from conventionally-raised or germ-free mice after DSS-induced colitis. Scale bars represent 1 mm for 40X and 200 μm for 200X. (d) Histopathology scoring of H&E-stained colons (WT, n=7; Nlrp12 /, n=8; GF WT, n=6; GF Nlrp12 /, n=6). (e-g) Representative immunoblots of distal colon proteins and composite densitometry from 2 independent experiments. One dot or one lane represents one mouse. Error bars show SEM. *p<0.05, **p<0.01, ***p<0.001, and n.s. means no significance determined by two-tailed unpaired t test.
3 Supplementary Figure 3 Nlrp12 defieciency causes significant changes in the intestinal microbiota. (a) Schematic showing fecal DNA collection from mice housed in two distinct vivarium for 16s rrna gene sequencing. (b) Bacterial diversity within WT (n=18) and Nlrp12 / (n=15) mice, (c) PCoA plot showing microbiota compositional differences between WT and Nlrp12 -/- mice from a repeated 16S rrna gene microbiome sequencing experiment conducted in vivarium #2. (d) Schematic showing fecal DNA collection from Nlrp12 +/+ and Nlrp12 / littermates derived from the same parents for 16s rrna gene sequencing. (e) PCoA plots of microbiota compositional differences between Nlrp12 +/+ and Nlrp12 / littermates. Error bars show SEM. One dot represents one mouse. **p<0.01 determined by two-tailed unpaired t test.
4
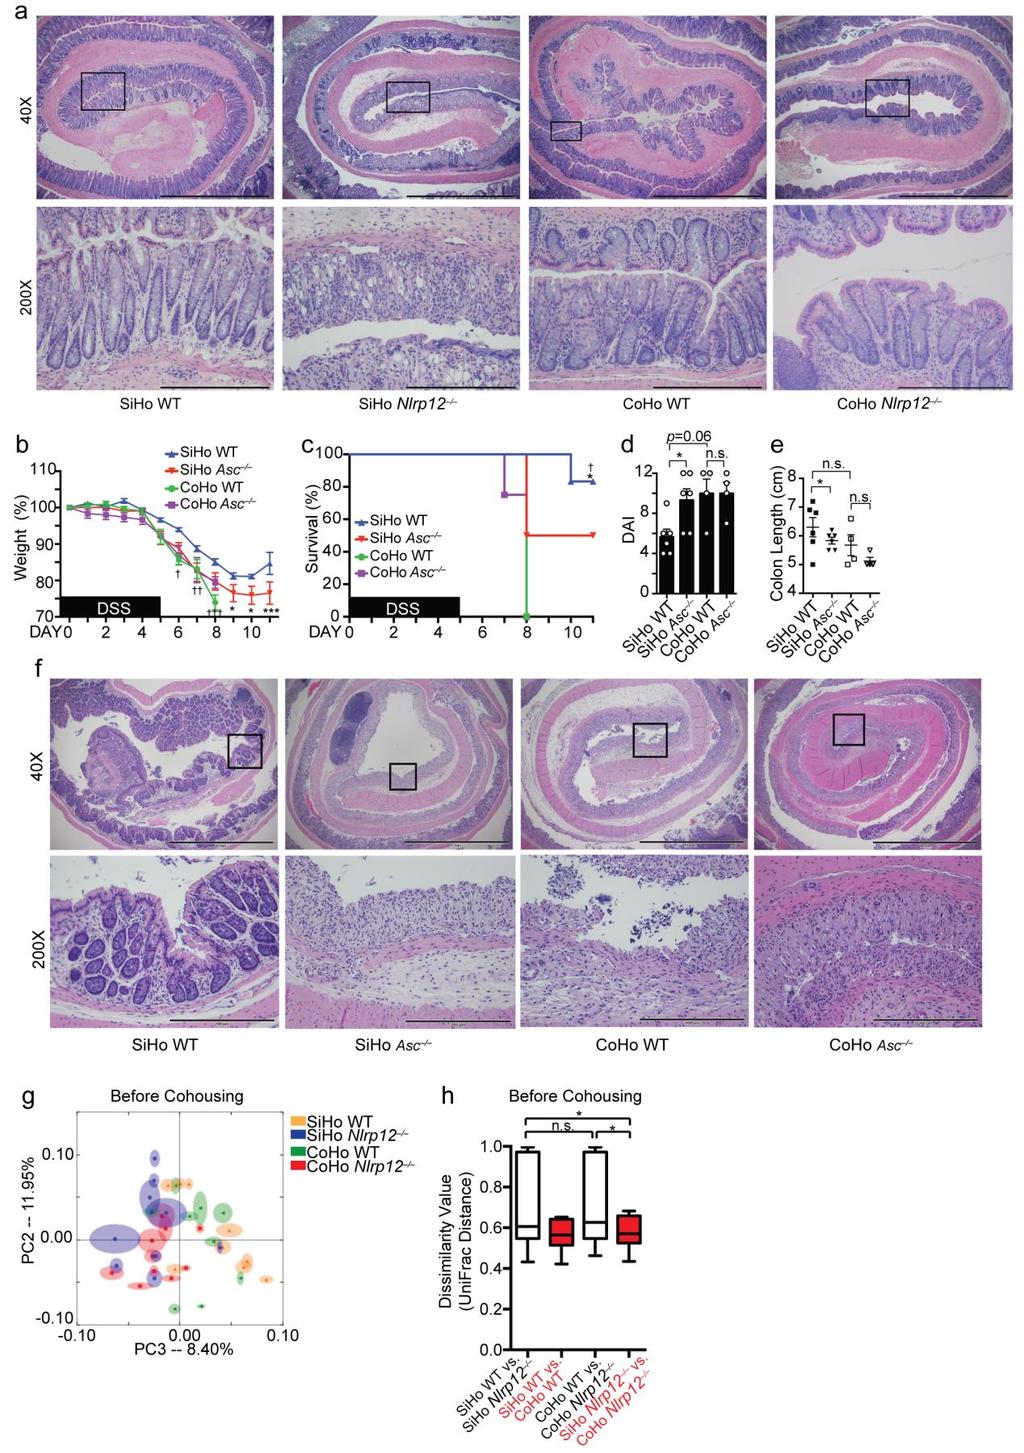
5 Supplementary Figure 4 Nlrp12 / mice cohoused with wild-type mice display attenuated colitis. (a) Representative images of H&E-stained colons from DSS-treated cohoused or single-housed WT and Nlrp12 / mice. (b) Body weight, (c) percent survival ( indicates statistical significance between SiHo WT vs. SiHo Asc /, and * indicates significance between SiHo WT vs. CoHo WT), (d) DAI and (e) colon length of DSS-treated cohoused or single-housed WT and Asc / mice (CoHo WT and CoHo Asc /, n=4; SiHo WT and SiHo Asc /, n=6). (f) Representative images of H&E-stained colons of SiHo and Coho WT and Asc / mice after DSS-induced colitis. (g) PCoA plot showing fecal microbial composition before cohousing (n=9/group). (h) Quantification of UniFrac distance between mice from (g) after cohousing, indicated as dissimilarity values. Error bars show SEM. *p<0.05, ***p<0.001 and n.s. means no significance, determined by two-tailed unpaired t test (b, d, e), Log-rank (Mantel Cox) test (c) and ANOSIM (h). Scale bars represent 1 mm for 40X and 200 μm for 200X (a,f). The Tukey s boxplot indicates first (bottom of the box) and third quartiles (top of the box), and the band inside the box is the median, and the ends of the whiskers indicate 1.5 interquartile range of the upper or lower quartile (h).
 Representative images of H&E-stained colons from mice administered Lachnospiraceae or BHI vehicle prior to DSS treatment.")
6 Supplementary Figure 5 Inoculation of Lachnospiraceae strains suppresses colitis in Nlrp12 / mice. (a) Representative images of H&E-stained colons from mice administered Lachnospiraceae or BHI vehicle prior to DSS treatment. Scale bars represent 1 mm for 40X and 200 μm for 200X.
 Flow chart showing WT and Nlrp12 / littermates treated with anti-tnf and anti-il6r antibodies (Ab) or PBS, and experimental strategy for Ab dosing (filled triangles) and fecal collection (open")
7 Supplementary Figure 6 Treatment with anti-tnf and anti-il6r reverses dysbiosis in Nlrp12 / mice. (a, b) Flow chart showing WT and Nlrp12 / littermates treated with anti-tnf and anti-il6r antibodies (Ab) or PBS, and experimental strategy for Ab dosing (filled triangles) and fecal collection (open triangles) (n=6 mice/group). (c) Microbial diversity and (d) PCoA plots of microbial compositional differences in WT and Nlrp12 / mice before antibody treatment. (e) Quantification of UniFrac distances calculated from (d) represented as dissimilarity values. Error bars show SEM. *p<0.05, **p<0.01, ****p< and n.s. means no significance determined by two-tailed unpaired t test (c) or ANOSIM (e).

8 Supplementary Figure 7 Model for the role of NLRP12 in maintaining intestinal homeostasis between host innate immunity and intestinal commensal symbiosis. Graphic summary of NLRP12 in maintaining intestinal homeostasis between host innate immunity and intestinal commensal symbiosis. The dysbiosis and inflammation caused by dysfunction of NLRP12 are shown in red. And therapeutic intervention points for the treatment of IBD during NLRP12 dysfunction are shown in blue.
SUPPLEMENTARY MATERIAL
 SUPPLEMENTARY MATERIAL IL-1 signaling modulates activation of STAT transcription factors to antagonize retinoic acid signaling and control the T H 17 cell it reg cell balance Rajatava Basu 1,5, Sarah K.
Gut microbiota, metabolic syndrome, obesity and the nutrient sensor pathways
 Gut microbiota, metabolic syndrome, obesity and the nutrient sensor pathways Department of Gastroenterology, Endocrinology & Metabolism Medical University Innsbruck Herbert Tilg Nothing to disclose Fig.
Gut Reaction. Mary ET Boyle, Ph. D. Department of Cognitive Science UCSD
 Gut Reaction Mary ET Boyle, Ph. D. Department of Cognitive Science UCSD Ley, R. et al (2005) PNAS vol. 102 no. 31 Bacterial diversity in the distal gut (ceca) of C57BL6 mice. (A) Phylogenetic tree of
Supplementary Figure 1. ETBF activate Stat3 in B6 and Min mice colons
 Supplementary Figure 1 ETBF activate Stat3 in B6 and Min mice colons a pstat3 controls Pos Neg ETBF 1 2 3 4 b pstat1 pstat2 pstat3 pstat4 pstat5 pstat6 Actin Figure Legend: (a) ETBF induce predominantly
The enteric microbiota: Implications for IBD. Eugene B. Chang, M.D. University of Chicago
 The enteric microbiota: Implications for IBD Eugene B. Chang, M.D. University of Chicago On a per cell basis, humans are mostly prokaryote 100 90 80 70 60 50 40 30 20 10 0 EuK ProK The microbial flora
Supplementary Figures
 Supplementary Figures Supplementary Figure 1 Characterization of stable expression of GlucB and sshbira in the CT26 cell line (a) Live cell imaging of stable CT26 cells expressing green fluorescent protein
Supplementary Figures
 Supplementary Figures Supplementary Figure 1 Increased ABHD5 expression in human colon cancer associated macrophages. (a) Murine peritoneal macrophages were treated with regular culture medium (Ctrl) or
Supplementary Information
 Supplementary Information mediates STAT3 activation at retromer-positive structures to promote colitis and colitis-associated carcinogenesis Zhang et al. a b d e g h Rel. Luc. Act. Rel. mrna Rel. mrna
Supplementary Material
 Supplementary Material Fig. S1. Gpa33 -/- mice do not express Gpa33 mrna or GPA33 protein. (A) The Gpa33 null allele contains a premature translational stop codon (STOP) in exon 2, and almost all of the
Supplementary Figure 1. Repression of hepcidin expression in the liver of mice treated with
 Supplementary Figure 1. Repression of hepcidin expression in the liver of mice treated with DMN Immunohistochemistry for hepcidin and H&E staining (left). qrt-pcr assays for hepcidin in the liver (right).
Figure S1. Reduction in glomerular mir-146a levels correlate with progression to higher albuminuria in diabetic patients.
 Supplementary Materials Supplementary Figures Figure S1. Reduction in glomerular mir-146a levels correlate with progression to higher albuminuria in diabetic patients. Figure S2. Expression level of podocyte
Supplementary Figure 1. Antibiotic partially rescues mice from sepsis. (ab) BALB/c mice under CLP were treated with antibiotic or PBS.
 BALB/c mice under CLP were treated with antibiotic or PBS.") 1 Supplementary Figure 1. Antibiotic partially rescues mice from sepsis. (ab) BALB/c mice under CLP were treated with antibiotic or PBS. (a) Survival curves. WT Sham (n=5), WT CLP or WT CLP antibiotic
1 Supplementary Figure 1. Antibiotic partially rescues mice from sepsis. (ab) BALB/c mice under CLP were treated with antibiotic or PBS. (a) Survival curves. WT Sham (n=5), WT CLP or WT CLP antibiotic
Supplementary Figure 1 IMQ-Induced Mouse Model of Psoriasis. IMQ cream was
 Supplementary Figure 1 IMQ-Induced Mouse Model of Psoriasis. IMQ cream was painted on the shaved back skin of CBL/J and BALB/c mice for consecutive days. (a, b) Phenotypic presentation of mouse back skin
Faecalibacterium prausnitzii
 Faecalibacterium prausnitzii is an anti-inflammatory commensal bacterium identified by gut microbiota analysis of Crohn disease patients PNAS 105(43): 16731-16736, 2008. Speaker: Ming-Cheng Chen Advisor:
Supplemental Table 1. Primers used for RT-PCR analysis of inflammatory cytokines Gene Primer Sequence
 Supplemental Table 1. Primers used for RT-PCR analysis of inflammatory cytokines Gene Primer Sequence IL-1α Forward primer 5 -CAAGATGGCCAAAGTTCGTGAC-3' Reverse primer 5 -GTCTCATGAAGTGAGCCATAGC-3 IL-1β
Supplemental Figure 1: Lrig1-Apple expression in small intestine. Lrig1-Apple is observed at the crypt base and in insterstial cells of Cajal, but is
 Supplemental Figure 1: Lrig1-Apple expression in small intestine. Lrig1-Apple is observed at the crypt base and in insterstial cells of Cajal, but is not co-expressed in DCLK1-positive tuft cells. Scale
SUPPLEMENTARY INFORMATION
 doi:1.138/nature1554 a TNF-α + in CD4 + cells [%] 1 GF SPF 6 b IL-1 + in CD4 + cells [%] 5 4 3 2 1 Supplementary Figure 1. Effect of microbiota on cytokine profiles of T cells in GALT. Frequencies of TNF-α
Serum mirna signature diagnoses and discriminates murine colitis subtypes and predicts ulcerative colitis in humans
 Serum mirna signature diagnoses and discriminates murine colitis subtypes and predicts ulcerative colitis in humans Emilie Viennois 1*, Yuan Zhao 1, 2, Moon Kwon Han 1, Bo Xiao 1, 3, Mingzhen Zhang 1,
Supplementary Figure 1. Characterization of basophils after reconstitution of SCID mice
 Supplementary figure legends Supplementary Figure 1. Characterization of after reconstitution of SCID mice with CD4 + CD62L + T cells. (A-C) SCID mice (n = 6 / group) were reconstituted with 2 x 1 6 CD4
Soluble ADAM33 initiates airway remodeling to promote susceptibility for. Elizabeth R. Davies, Joanne F.C. Kelly, Peter H. Howarth, David I Wilson,
 Revised Suppl. Data: Soluble ADAM33 1 Soluble ADAM33 initiates airway remodeling to promote susceptibility for allergic asthma in early life Elizabeth R. Davies, Joanne F.C. Kelly, Peter H. Howarth, David
Supplementary Materials
 Supplementary Materials Supplementary figure 1. Taxonomic representation summarized at genus level. Fecal microbiota from a separate set of Jackson and Harlan mice prior to irradiation. A taxon was included
COPD lungs show an attached stratified mucus layer that separate. bacteria from the epithelial cells resembling the protective colonic
 COPD lungs show an attached stratified mucus layer that separate bacteria from the epithelial cells resembling the protective colonic mucus SUPPLEMENTARY TABLES AND FIGURES Tables S1 S8, page 1 and separate
Nature Medicine: doi: /nm.3922
 Title: Glucocorticoid-induced tumor necrosis factor receptor-related protein co-stimulation facilitates tumor regression by inducing IL-9-producing helper T cells Authors: Il-Kyu Kim, Byung-Seok Kim, Choong-Hyun
GPR120 *** * * Liver BAT iwat ewat mwat Ileum Colon. UCP1 mrna ***
 a GPR120 GPR120 mrna/ppia mrna Arbitrary Units 150 100 50 Liver BAT iwat ewat mwat Ileum Colon b UCP1 mrna Fold induction 20 15 10 5 - camp camp SB202190 - - - H89 - - - - - GW7647 Supplementary Figure
Balancing intestinal and systemic inflammation through cell type-specific expression of
 Supplementary Information Balancing intestinal and systemic inflammation through cell type-specific expression of the aryl hydrocarbon receptor repressor Olga Brandstätter 1,2,6, Oliver Schanz 1,6, Julia
Innate immune regulation of T-helper (Th) cell homeostasis in the intestine
 cell homeostasis in the intestine") Innate immune regulation of T-helper (Th) cell homeostasis in the intestine Masayuki Fukata, MD, Ph.D. Research Scientist II Division of Gastroenterology, Department of Medicine, F. Widjaja Foundation,
Innate immune regulation of T-helper (Th) cell homeostasis in the intestine Masayuki Fukata, MD, Ph.D. Research Scientist II Division of Gastroenterology, Department of Medicine, F. Widjaja Foundation,
Supplementary Figure S1 Expression of mir-181b in EOC (A) Kaplan-Meier
 Kaplan-Meier") Supplementary Figure S1 Expression of mir-181b in EOC (A) Kaplan-Meier curves for progression-free survival (PFS) and overall survival (OS) in a cohort of patients (N=52) with stage III primary ovarian
Supplementary Figure S1 Expression of mir-181b in EOC (A) Kaplan-Meier curves for progression-free survival (PFS) and overall survival (OS) in a cohort of patients (N=52) with stage III primary ovarian
Nature Immunology: doi: /ni eee Supplementary Figure 1
 eee Supplementary Figure 1 Hyphae induce NET release, but yeast do not. (a) NET release by human peripheral neutrophils stimulated with a hgc1 yeast-locked C. albicans mutant (yeast) or pre-formed WT C.
Stable Isotope Probing of gut bacteria RNA. Wayne Young. Identifying gut bacteria that can use sialic acid using an RNA-SIP approach
 Stable Isotope Probing of gut bacteria RNA Identifying gut bacteria that can use sialic acid using an RNA-SIP approach Wayne Young Food Nutrition & Health Team Food & Bio-based Products Group AgResearch
What Have We Learned About the Microbiome in Pediatric IBD?
 What Have We Learned About the Microbiome in Pediatric IBD? Ted Denson, MD Cincinnati Children s Hospital Medical Center and the University of Cincinnati College of Medicine Disclosures: NIH, CCF, AbbVie
Gut Microbiota and IBD. Vahedi. H M.D Associate Professor of Medicine DDRI
 Gut Microbiota and IBD Vahedi. H M.D Associate Professor of Medicine DDRI 1393.3.1 2 GUT MICROBIOTA 100 Trillion Microbes - 10 times more than cells in our body Collective weight of about 1kg in human
Type of file: PDF Title of file for HTML: Supplementary Information Description: Supplementary Figures
 Type of file: PDF Title of file for HTML: Supplementary Information Description: Supplementary Figures Type of file: MOV Title of file for HTML: Supplementary Movie 1 Description: NLRP3 is moving along
Hypothalamic TLR2 triggers sickness behavior via a microglia-neuronal axis
 Hypothalamic TLR triggers sickness behavior via a microglia-neuronal axis Sungho Jin, *, Jae Geun Kim,, *, Jeong Woo Park, Marco Koch,, Tamas L. Horvath and Byung Ju Lee Department of Biological Sciences,
Supplementary Material
 Supplementary Material Summary: The supplementary information includes 1 table (Table S1) and 4 figures (Figure S1 to S4). Supplementary Figure Legends Figure S1 RTL-bearing nude mouse model. (A) Tumor
Understanding clinical aspects of Crohn s disease and ulcerative colitis: Implications for the basic scientist
 Understanding clinical aspects of Crohn s disease and ulcerative colitis: Implications for the basic scientist Scott Plevy, MD Associate Professor of Medicine, Microbiology & Immunology UNC School of Medicine
Supplementary Figure 1. Double-staining immunofluorescence analysis of invasive colon and breast cancers. Specimens from invasive ductal breast
 Supplementary Figure 1. Double-staining immunofluorescence analysis of invasive colon and breast cancers. Specimens from invasive ductal breast carcinoma (a) and colon adenocarcinoma (b) were staining
GFP/Iba1/GFAP. Brain. Liver. Kidney. Lung. Hoechst/Iba1/TLR9!
 Supplementary information a +KA Relative expression d! Tlr9 5!! 5! NSC Neuron Astrocyte Microglia! 5! Tlr7!!!! NSC Neuron Astrocyte! GFP/Sβ/! Iba/Hoechst Microglia e Hoechst/Iba/TLR9! GFP/Iba/GFAP f Brain
Matched Analysis of Differences of Microbiomes in Japanese vs. Non-Japanese Patients from an Ulcerative Colitis Study
 Matched Analysis of Differences of Microbiomes in Japanese vs. Non-Japanese Patients from an Ulcerative Colitis Study Davit Sargsyan 1,2, Javier Cabrera 2, Kathy Mutambanengwe 3, Dhammika Amaratunga 2,
SUPPLEMENTARY INFORMATION
 doi:10.1038/nature10134 Supplementary Figure 1. Anti-inflammatory activity of sfc. a, Autoantibody immune complexes crosslink activating Fc receptors, promoting activation of macrophages, and WWW.NATURE.COM/NATURE
Supplementary Figure 1. A. Bar graph representing the expression levels of the 19 indicated genes in the microarrays analyses comparing human lung
 Supplementary Figure 1. A. Bar graph representing the expression levels of the 19 indicated genes in the microarrays analyses comparing human lung immortalized broncho-epithelial cells (AALE cells) expressing
Supplemental Table 1: Demographics and characteristics of study participants. Male, n (%) 3 (20%) 6 (50%) Age, years [mean ± SD] 33.3 ± ± 9.
![Supplemental Table 1: Demographics and characteristics of study participants. Male, n (%) 3 (20%) 6 (50%) Age, years [mean ± SD] 33.3 ± ± 9.](/thumbs/90/103696086.jpg "Supplemental Table 1: Demographics and characteristics of study participants. Male, n (%) 3 (20%) 6 (50%) Age, years [mean ± SD] 33.3 ± ± 9.") SUPPLEMENTAL DATA Supplemental Table 1: Demographics and characteristics of study participants Lean (n=15) Obese (n=12) Male, n (%) 3 (20%) 6 (50%) Age, years [mean ± SD] 33.3 ± 9.5 44.8 ± 9.1 White, n
SUPPLEMENTAL DATA Supplemental Table 1: Demographics and characteristics of study participants Lean (n=15) Obese (n=12) Male, n (%) 3 (20%) 6 (50%) Age, years [mean ± SD] 33.3 ± 9.5 44.8 ± 9.1 White, n
Supplementary. presence of the. (c) mrna expression. Error. in naive or
 mrna expression. Error. in naive or") Figure 1. (a) Naive CD4 + T cells were activated in the presence of the indicated cytokines for 3 days. Enpp2 mrna expression was measured by qrt-pcrhr, infected with (b, c) Naive CD4 + T cells were activated
Figure 1. (a) Naive CD4 + T cells were activated in the presence of the indicated cytokines for 3 days. Enpp2 mrna expression was measured by qrt-pcrhr, infected with (b, c) Naive CD4 + T cells were activated
and follicular helper T cells is Egr2-dependent. (a) Diagrammatic representation of the
 Diagrammatic representation of the") Supplementary Figure 1. LAG3 + Treg-mediated regulation of germinal center B cells and follicular helper T cells is Egr2-dependent. (a) Diagrammatic representation of the experimental protocol for the
Supplementary Figure 1. LAG3 + Treg-mediated regulation of germinal center B cells and follicular helper T cells is Egr2-dependent. (a) Diagrammatic representation of the experimental protocol for the
Benakis et al. Supplementary Figure 1
 Benakis et al. Supplementary Figure a flora Naive C7BL/ d AC weeks d S rrna sequencing Antibiotic in drinking water Stool pellet collection riginal seeder flora flora Naive C7BL/ d AC weeks d S rrna sequencing
Dual epithelial and immune cell function of Dvl1 regulates gut microbiota composition and intestinal homeostasis
 Dual epithelial and immune cell function of Dvl1 regulates gut microbiota composition and intestinal homeostasis Haim Belinson,, Richard M. Locksley, Ophir D. Klein JCI Insight. 2016;1(10):e85395. https://doi.org/10.1172/jci.insight.85395.
Programmed necrosis, not apoptosis, is a key mediator of cell loss and DAMP-mediated inflammation in dsrna-induced retinal degeneration
 Programmed necrosis, not apoptosis, is a key mediator of cell loss and DAMP-mediated inflammation in dsrna-induced retinal degeneration The Harvard community has made this article openly available. Please
Supplementary Figure S1: Defective heterochromatin repair in HGPS progeroid cells
 Supplementary Figure S1: Defective heterochromatin repair in HGPS progeroid cells Immunofluorescence staining of H3K9me3 and 53BP1 in PH and HGADFN003 (HG003) cells at 24 h after γ-irradiation. Scale bar,
Dietary Zinc Alters the Microbiota and Decreases Resistance to Clostridium difficile Infection
 1 Dietary Zinc Alters the Microbiota and Decreases Resistance to Clostridium difficile Infection 2 3 4 5 Joseph P. Zackular 1, Jessica L. Moore 2,3, Ashley T. Jordan 1, Lillian J. Juttukonda 1, Michael
Supplementary Figures. Supplementary Figure 1. Treatment schematic of SIV infection and ARV and PP therapies.
 Supplementary Figures Supplementary Figure 1. Treatment schematic of SIV infection and ARV and PP therapies. Supplementary Figure 2. SIV replication and CD4 + T cell count. (A) Log SIVmac239 copies/ml
marker. DAPI labels nuclei. Flies were 20 days old. Scale bar is 5 µm. Ctrl is
 Supplementary Figure 1. (a) Nos is detected in glial cells in both control and GFAP R79H transgenic flies (arrows), but not in deletion mutant Nos Δ15 animals. Repo is a glial cell marker. DAPI labels
Genetics. Environment. You Are Only 10% Human. Pathogenesis of IBD. Advances in the Pathogenesis of IBD: Genetics Leads to Function IBD
 Advances in the Pathogenesis of IBD: Genetics Leads to Function Pathogenesis of IBD Environmental Factors Microbes Scott Plevy, MD Associate Professor of Medicine, Microbiology & Immunology UNC School
Supplementary Fig. 1. GPRC5A post-transcriptionally down-regulates EGFR expression. (a) Plot of the changes in steady state mrna levels versus
 Plot of the changes in steady state mrna levels versus") Supplementary Fig. 1. GPRC5A post-transcriptionally down-regulates EGFR expression. (a) Plot of the changes in steady state mrna levels versus changes in corresponding proteins between wild type and Gprc5a-/-
Supplementary Fig. 1. GPRC5A post-transcriptionally down-regulates EGFR expression. (a) Plot of the changes in steady state mrna levels versus changes in corresponding proteins between wild type and Gprc5a-/-
SUPPLEMENTARY INFORMATION
 SUPPLEMENTARY INFORMATION doi:10.1038/nature11429 S1a 6 7 8 9 Nlrc4 allele S1b Nlrc4 +/+ Nlrc4 +/F Nlrc4 F/F 9 Targeting construct 422 bp 273 bp FRT-neo-gb-PGK-FRT 3x.STOP S1c Nlrc4 +/+ Nlrc4 F/F casp1
The Gut Microbiota: Evidence For Gut Microbes as Contributors to Weight Gain
 The Gut Microbiota: Evidence For Gut Microbes as Contributors to Weight Gain Michael T. Bailey, Ph.D. Center for Microbial Pathogenesis The Research Institute, Nationwide Children s Hospital Department
Supplementary Figure 1
 S U P P L E M E N TA R Y I N F O R M AT I O N DOI: 10.1038/ncb2896 Supplementary Figure 1 Supplementary Figure 1. Sequence alignment of TERB1 homologs in vertebrates. M. musculus TERB1 was derived from
Supplementary figure 1 (related to fig 1)
") Histological score linical Score Weight loss (%) olon length (cm) Supplementary figure (related to fig ) N ### ## ays on % E ### - - - - N ays on % $$ $$ # ## N. N N Supplementary figure : Lack of fibre
Histological score linical Score Weight loss (%) olon length (cm) Supplementary figure (related to fig ) N ### ## ays on % E ### - - - - N ays on % $$ $$ # ## N. N N Supplementary figure : Lack of fibre
Supplementary fig. 1. Crystals induce necroptosis does not involve caspases, TNF receptor or NLRP3. A. Mouse tubular epithelial cells were pretreated
 Supplementary fig. 1. Crystals induce necroptosis does not involve caspases, TNF receptor or NLRP3. A. Mouse tubular epithelial cells were pretreated with zvad-fmk (10µM) and exposed to calcium oxalate
New Insights on the Structure of the Human Gut Microbiota. Chaysavanh Manichanh, PhD Vall d Hebron Research Institute Barcelona
 New Insights on the Structure of the Human Gut Microbiota Chaysavanh Manichanh, PhD Vall d Hebron Research Institute Barcelona Sessio Societat Catalana Malalties Infecciosas i Microbiologia March 20th,
Supplementary Figure 1: Expression of NFAT proteins in Nfat2-deleted B cells (a+b) Protein expression of NFAT2 (a) and NFAT1 (b) in isolated splenic
 Protein expression of NFAT2 (a) and NFAT1 (b) in isolated splenic") Supplementary Figure 1: Expression of NFAT proteins in Nfat2-deleted B cells (a+b) Protein expression of NFAT2 (a) and NFAT1 (b) in isolated splenic B cells from WT Nfat2 +/+, TCL1 Nfat2 +/+ and TCL1 Nfat2
Supplementary Figure 1: Expression of NFAT proteins in Nfat2-deleted B cells (a+b) Protein expression of NFAT2 (a) and NFAT1 (b) in isolated splenic B cells from WT Nfat2 +/+, TCL1 Nfat2 +/+ and TCL1 Nfat2
Supplementary Figure 1
 Supplementary Figure 1 # nonsynonymous mutations (tngs, 1561 genes) 600 p=0.056 500 250 200 150 100 50 0 HLA-DR (-) HLA-DR (+) Supplementary Figure 1: HLA-DR(+) melanoma cell lines are associated with
Sarkis K Mazmanian, California Institute of Technology
 Sarkis K Mazmanian, California Institute of Technology The human microbiota The human gut harbors 10 11-10 12 bacteria per gram colonic content (>10 14 total bacteria) Total bacteria outnumber human cells
Nature Medicine doi: /nm.3957
 Supplementary Fig. 1. p38 alternative activation, IL-21 expression, and T helper cell transcription factors in PDAC tissue. (a) Tissue microarrays of pancreatic tissue from 192 patients with pancreatic
Research in IBD at University of Colorado Denver
 Research in IBD at University of Colorado Denver Blair Fennimore, MD Assistant Professor of Medicine Division of Gastroenterology and Hepatology UCH Crohn s and Colitis Center Mucosal Inflammation Program
Supplementary Figure 1. H-PGDS deficiency does not affect GI tract functions and anaphylactic reaction. (a) Representative pictures of H&E-stained
 Representative pictures of H&E-stained") 1 2 3 4 5 6 7 8 9 10 11 Supplementary Figure 1. H-PGDS deficiency does not affect GI tract functions and anaphylactic reaction. (a) Representative pictures of H&E-stained jejunum sections ( 200 magnification;
1 2 3 4 5 6 7 8 9 10 11 Supplementary Figure 1. H-PGDS deficiency does not affect GI tract functions and anaphylactic reaction. (a) Representative pictures of H&E-stained jejunum sections ( 200 magnification;
Metabolic ER stress and inflammation in white adipose tissue (WAT) of mice with dietary obesity.
 of mice with dietary obesity.") Supplementary Figure 1 Metabolic ER stress and inflammation in white adipose tissue (WAT) of mice with dietary obesity. Male C57BL/6J mice were fed a normal chow (NC, 10% fat) or a high-fat diet (HFD,
Supplementary Figure 1 Metabolic ER stress and inflammation in white adipose tissue (WAT) of mice with dietary obesity. Male C57BL/6J mice were fed a normal chow (NC, 10% fat) or a high-fat diet (HFD,
Supplementary. properties of. network types. randomly sampled. subsets (75%
 Supplementary Information Gene co-expression network analysis reveals common system-level prognostic genes across cancer types properties of Supplementary Figure 1 The robustness and overlap of prognostic
fl/+ KRas;Atg5 fl/+ KRas;Atg5 fl/fl KRas;Atg5 fl/fl KRas;Atg5 Supplementary Figure 1. Gene set enrichment analyses. (a) (b)
 (b)") KRas;At KRas;At KRas;At KRas;At a b Supplementary Figure 1. Gene set enrichment analyses. (a) GO gene sets (MSigDB v3. c5) enriched in KRas;Atg5 fl/+ as compared to KRas;Atg5 fl/fl tumors using gene set
KRas;At KRas;At KRas;At KRas;At a b Supplementary Figure 1. Gene set enrichment analyses. (a) GO gene sets (MSigDB v3. c5) enriched in KRas;Atg5 fl/+ as compared to KRas;Atg5 fl/fl tumors using gene set
TEB. Id4 p63 DAPI Merge. Id4 CK8 DAPI Merge
 a Duct TEB b Id4 p63 DAPI Merge Id4 CK8 DAPI Merge c d e Supplementary Figure 1. Identification of Id4-positive MECs and characterization of the Comma-D model. (a) IHC analysis of ID4 expression in the
Nature Genetics: doi: /ng Supplementary Figure 1. Details of sequencing analysis.
 Supplementary Figure 1 Details of sequencing analysis. (a) Flow chart showing which patients fall into each category and were used for analysis. (b) Graph showing the average and median coverage for all
Nature Neuroscience: doi: /nn Supplementary Figure 1
 Supplementary Figure 1 Atlas representations of the midcingulate (MCC) region targeted in this study compared against the anterior cingulate (ACC) region commonly reported. Coronal sections are shown on
Nature Neuroscience: doi: /nn Supplementary Figure 1
 Supplementary Figure 1 Relative expression of K IR2.1 transcript to enos was reduced 29-fold in capillaries from knockout animals. Relative expression of K IR2.1 transcript to enos was reduced 29-fold
Supplementary Figure 1. DNA methylation of the adiponectin promoter R1, Pparg2, and Tnfa promoter in adipocytes is not affected by obesity.
 Supplementary Figure 1. DNA methylation of the adiponectin promoter R1, Pparg2, and Tnfa promoter in adipocytes is not affected by obesity. (a) Relative amounts of adiponectin, Ppar 2, C/ebp, and Tnf mrna
Supplementary Figure 1.
 Supplementary Figure 1. Female Pro-ins2 -/- mice at 5-6 weeks of age were either inoculated i.p. with a single dose of CVB4 (1x10 5 PFU/mouse) or PBS and treated with αgalcer or control vehicle. On day
1.5 ASK1KO fed. fasted 16 hrs w/o water. Fed. 4th. 4th WT ASK1KO N=29, 11(WT), ,5(ASK1KO) ASK1KO ASK1KO **** Time [h]
![1.5 ASK1KO fed. fasted 16 hrs w/o water. Fed. 4th. 4th WT ASK1KO N=29, 11(WT), ,5(ASK1KO) ASK1KO ASK1KO **** Time [h]](/thumbs/87/97258189.jpg "1.5 ASK1KO fed. fasted 16 hrs w/o water. Fed. 4th. 4th WT ASK1KO N=29, 11(WT), ,5(ASK1KO) ASK1KO ASK1KO **** Time [h]") 7: 13: 19: 1: 7: 151117 a 151117 4th 4th b c RQ.95 KO.9.85.8.75.7 light dark light dark.65 7: 19: 7: 19: 7: Means ± SEM, N=6 RQ 1..9.8.7.6.6 KO CL (-) CL (+) ibat weight ratio (/body weight) [%].5.4.3.2.1
7: 13: 19: 1: 7: 151117 a 151117 4th 4th b c RQ.95 KO.9.85.8.75.7 light dark light dark.65 7: 19: 7: 19: 7: Means ± SEM, N=6 RQ 1..9.8.7.6.6 KO CL (-) CL (+) ibat weight ratio (/body weight) [%].5.4.3.2.1
pplementary Figur Supplementary Figure 1. a.
 pplementary Figur Supplementary Figure 1. a. Quantification by RT-qPCR of YFV-17D and YFV-17D pol- (+) RNA in the supernatant of cultured Huh7.5 cells following viral RNA electroporation of respective
Supplementary Figure 1. Analysis of LN S1P gradients.
 Supplementary Figure 1 Analysis of LN S1P gradients. (a) Diagram showing the spatial distribution of NK cells in WT LN. Inset: Upon infection, sinus-lining macrophages secrete IL-18 and other cytokines,
Expanded View Figures
 PEX13 functions in selective autophagy Ming Y Lee et al Expanded View Figures Figure EV1. PEX13 is required for Sindbis virophagy. A, B Quantification of mcherry-capsid puncta per cell (A) and GFP-LC3
Supplementary Figure 1 Chemokine and chemokine receptor expression during muscle regeneration (a) Analysis of CR3CR1 mrna expression by real time-pcr
 Analysis of CR3CR1 mrna expression by real time-pcr") Supplementary Figure 1 Chemokine and chemokine receptor expression during muscle regeneration (a) Analysis of CR3CR1 mrna expression by real time-pcr at day 0, 1, 4, 10 and 21 post- muscle injury. (b)
Supplementary Figure 1 Chemokine and chemokine receptor expression during muscle regeneration (a) Analysis of CR3CR1 mrna expression by real time-pcr at day 0, 1, 4, 10 and 21 post- muscle injury. (b)
Reviewers' comments: Reviewer #1 (Remarks to the Author):
:") Reviewers' comments: Reviewer #1 (Remarks to the Author): The manuscript by Sun et al., provide data showing that short-chain fatty acids produced by intestinal microbiota act through GPR43 to induced
Reviewers' comments: Reviewer #1 (Remarks to the Author): The manuscript by Sun et al., provide data showing that short-chain fatty acids produced by intestinal microbiota act through GPR43 to induced
Nature Medicine: doi: /nm.4324
 1 2 3 4 5 6 7 8 9 10 11 12 13 14 15 16 17 18 19 20 21 22 23 24 25 Supplementary Figure 1. Kinetics of SnCs development in surgically-induced OA and effect of GCV-induced SnC clearance on OA disease progression
Supplementary Table 1 Clinicopathological characteristics of 35 patients with CRCs
 Supplementary Table Clinicopathological characteristics of 35 patients with CRCs Characteristics Type-A CRC Type-B CRC P value Sex Male / Female 9 / / 8.5 Age (years) Median (range) 6. (9 86) 6.5 (9 76).95
Mark Manary MD. International Symposium on Understanding Moderate Malnutrition in Children for Effective Interventions
 Possible role of the microbiome in the development of acute malnutrition and implications for food-based strategies to prevent and treat acute malnutrition International Symposium on Understanding Moderate
Nature Immunology: doi: /ni Supplementary Figure 1. Transcriptional program of the TE and MP CD8 + T cell subsets.
 Supplementary Figure 1 Transcriptional program of the TE and MP CD8 + T cell subsets. (a) Comparison of gene expression of TE and MP CD8 + T cell subsets by microarray. Genes that are 1.5-fold upregulated
Modulation of Host Learning in Aedes aegypti Mosquitoes
 Current Biology, Volume 28 Supplemental Information Modulation of Host Learning in Aedes aegypti Mosquitoes Clément Vinauger, Chloé Lahondère, Gabriella H. Wolff, Lauren T. Locke, Jessica E. Liaw, Jay
The number of microorganisms residing in our intestines is 10 times the number of our somatic and germ cells.
 The number of microorganisms residing in our intestines is 10 times the number of our somatic and germ cells. The number of microorganisms residing in our intestines is 10 times the number of our somatic
Supplementary Figure 1. Ent inhibits LPO activity in a dose- and time-dependent fashion.
 Supplementary Information Supplementary Figure 1. Ent inhibits LPO activity in a dose- and time-dependent fashion. Various concentrations of Ent, DHBA or ABAH were pre-incubated for 10 min with LPO (50
SUPPLEMENTARY DATA. Nature Medicine: doi: /nm.4171
 SUPPLEMENTARY DATA Supplementary Figure 1 a b c PF %Change - -4-6 Body weight Lean mass Body fat Tissue weight (g).4.3.2.1. PF GC iwat awat BAT PF d e f g week 2 week 3 NEFA (mmol/l) 1..5. PF phsl (Ser565)
Supplementary Figure 1: Additional metabolic parameters of obesity mouse models and controls. (a) Body weight, (b) blood glucose and (c) insulin
 Body weight, (b) blood glucose and (c) insulin") Supplementary Figure 1: Additional metabolic parameters of obesity mouse models and controls. (a) Body weight, (b) blood glucose and (c) insulin resistance index of homeostatic model assessment (HOMA IR)
Supplementary Figure 1: Additional metabolic parameters of obesity mouse models and controls. (a) Body weight, (b) blood glucose and (c) insulin resistance index of homeostatic model assessment (HOMA IR)
Supplemental Materials
 Supplemental Materials Programmed death one homolog maintains the pool size of regulatory T cells by promoting their differentiation and stability Qi Wang 1, Jianwei He 1, Dallas B. Flies 2, Liqun Luo
Functional Nutrition Approaches to Gut Health 20 CPEU Module accredited by Nutrition Mission
 Topics Covered 1. Good Health Starts in the Gut 2. Microbiome Part 1 3. Microbiome Part 2 4. What Can Go Wrong 5. FODMAP Intolerance 6. GERD 7. Celiac Disease 8. Non-Celiac Gluten Sensitivity 9. Intestinal
SUPPLEMENTARY INFORMATION
 DOI: 10.1038/ncb2607 Figure S1 Elf5 loss promotes EMT in mammary epithelium while Elf5 overexpression inhibits TGFβ induced EMT. (a, c) Different confocal slices through the Z stack image. (b, d) 3D rendering
Title of file for HTML: Supplementary Information Description: Supplementary Figures and Supplementary Table
 Title of file for HTML: Supplementary Information Description: Supplementary Figures and Supplementary Table Title of file for HTML: Peer Review File Description: Innate Scavenger Receptor-A regulates
EPIGENETIC RE-EXPRESSION OF HIF-2α SUPPRESSES SOFT TISSUE SARCOMA GROWTH
 EPIGENETIC RE-EXPRESSION OF HIF-2α SUPPRESSES SOFT TISSUE SARCOMA GROWTH Supplementary Figure 1. Supplementary Figure 1. Characterization of KP and KPH2 autochthonous UPS tumors. a) Genotyping of KPH2
sequences of a styx mutant reveals a T to A transversion in the donor splice site of intron 5
 sfigure 1 Styx mutant mice recapitulate the phenotype of SHIP -/- mice. (A) Analysis of the genomic sequences of a styx mutant reveals a T to A transversion in the donor splice site of intron 5 (GTAAC
Supplementary Figure S1. Flow cytometric analysis of the expression of Thy1 in NH cells. Flow cytometric analysis of the expression of T1/ST2 and
 Supplementary Figure S1. Flow cytometric analysis of the expression of Thy1 in NH cells. Flow cytometric analysis of the expression of T1/ST2 and Thy1 in NH cells derived from the lungs of naïve mice.
Supplementary Information. Protectin DX alleviates insulin resistance by activating a myokine-liver glucoregulatory axis.
 Supplementary Information Protectin DX alleviates insulin resistance by activating a myokine-liver glucoregulatory axis. Phillip J. White, Philippe St-Pierre, Alexandre Charbonneau, Patricia Mitchell,
Supplementary Figure 1
 Supplementary Figure 1 Asymmetrical function of 5p and 3p arms of mir-181 and mir-30 families and mir-142 and mir-154. (a) Control experiments using mirna sensor vector and empty pri-mirna overexpression
Supplementary Information Titles Journal: Nature Medicine
 Supplementary Information Titles Journal: Nature Medicine Article Title: Corresponding Author: Supplementary Item & Number Supplementary Fig.1 Fig.2 Fig.3 Fig.4 Fig.5 Fig.6 Fig.7 Fig.8 Fig.9 Fig. Fig.11
TGF-β Signaling Regulates Neuronal C1q Expression and Developmental Synaptic Refinement
 Supplementary Information Title: TGF-β Signaling Regulates Neuronal C1q Expression and Developmental Synaptic Refinement Authors: Allison R. Bialas and Beth Stevens Supplemental Figure 1. In vitro characterization
SUPPLEMENTARY INFORMATION
 DOI: 10.1038/ncb2211 a! mir-143! b! mir-103/107! let-7a! mir-144! mir-122a! mir-126-3p! mir-194! mir-27a! mir-30c! Figure S1 Northern blot analysis of mir-143 expression dependent on feeding conditions.