Supplementary Figure 1. Analysis of LN S1P gradients.
|
|
|
- Elisabeth Thornton
- 5 years ago
- Views:
Transcription

1 Supplementary Figure 1 Analysis of LN S1P gradients. (a) Diagram showing the spatial distribution of NK cells in WT LN. Inset: Upon infection, sinus-lining macrophages secrete IL-18 and other cytokines, which stimulate IFN- production by NK cells. IFN- in turn activates microbicidal activity in the macrophages. (b) Diagram showing the response to S1P by cells expressing the reporter construct. (c) FTY720 treatment demonstrates that reporting macrophages within the medulla are not saturated with S1P. S1P reporter mice (Mx1-Cre) were treated i.p. with 1 mg/kg of the S1PR1 agonist FTY720 or
2 vehicle 5h before LN harvest. LN sections were stained with antibodies against GFP (green), RFP (red), CD11b (white), Lyve1 (not shown) and B220 (not shown). Left: Representative cells from the medullary cords and medullary sinuses of FTY720-treated and vehicle-treated S1P reporter mice. Scale bar, 5 m. Representative of 2 pairs of mice analyzed in 2 experiments (image file: Right: Quantification of the GFP:RFP ratio on the surface of reporting cells as in Fig. 1c. Each point on the graph represents the average ratio over an area of at least 7x10 2 square microns. Horizontal lines indicate the mean and SEM. Ratios were not normalized. Graph shows data from 1 pair of mice, representative of 2 experiments. *, p<0.01; **, p< (Fisher s LSD test). (d) Reporter-transduced T cells sense more S1P in the medullary cords than the T zone. T cells isolated from WT CD or Cd69 / CD mice were retrovirally transduced with the S1P reporter and intravenously transferred to WT CD mice. LN were harvested for sectioning and confocal imaging 1d after transfer. We used Cd69 / T cells to avoid CD69-mediated S1PR1 internalization, although we did not see any differences between reporting by Cd69 / and WT T cells (not shown) 27. Left: LN sections were stained with antibodies against GFP (green), RFP (red), CD45.1 (to identify the surface of transferred cells, not shown), Lyve1 (not shown), and B220 (not shown). Representative cells are shown from the T zone and medullary cords. Scale bars, 5 m (image files: Right: Quantification of S1P reporting by transferred T cells in the T zone and medullary cords. The ratio of GFP to RFP for each CD RFP + pixel was calculated, and the ratio was averaged over individual cells. Graph compiles 19 cells in the medullary cords and 55 cells in the T zone from 16 sections (14 from 2 mice with Cd69 / donor T cells analyzed in 2 experiments, and 2 from 1 mouse with WT donor T cells in 1 experiment). Center line represents the median, box limits extend from the 25 th to 75 th percentile, Tukey whiskers extend to 1.5 IQR beyond the box, and symbols represent outliers. For each experiment all ratios were normalized such that the average ratio for the T zone was 1.0. *, p<0.01 (unpaired Student s 2- tailed t-test). (Supplementary Note 2)
, anti-nkp46 (magenta), and anti-lyve1 (blue). Image is representative of 2 mice in 2 experiments.")
3 Supplementary Figure 2 Identification of NK cells in tissue sections. Most NK1.1 + cells in LN sections are NKp46 + NK cells. Confocal immunofluorescence image of a LN section from a WT animal stained with anti-nk1.1 (green), anti-nkp46 (magenta), and anti-lyve1 (blue). Image is representative of 2 mice in 2 experiments. Scale bars, 20 m. More than 85% of NK1.1 + cells are also positive for NKp46. In most experiments, we identified NK cells by expression of NK1.1 rather than the more NK-specific NKp46 because the anti-nk1.1 antibody was more robust in our hands. Because the vast majority of cells that stain with NK1.1 in LN sections are NKp46 +, potential mislocalization of NKT cells or other NK1.1 + subsets would not substantially affect the results.
4
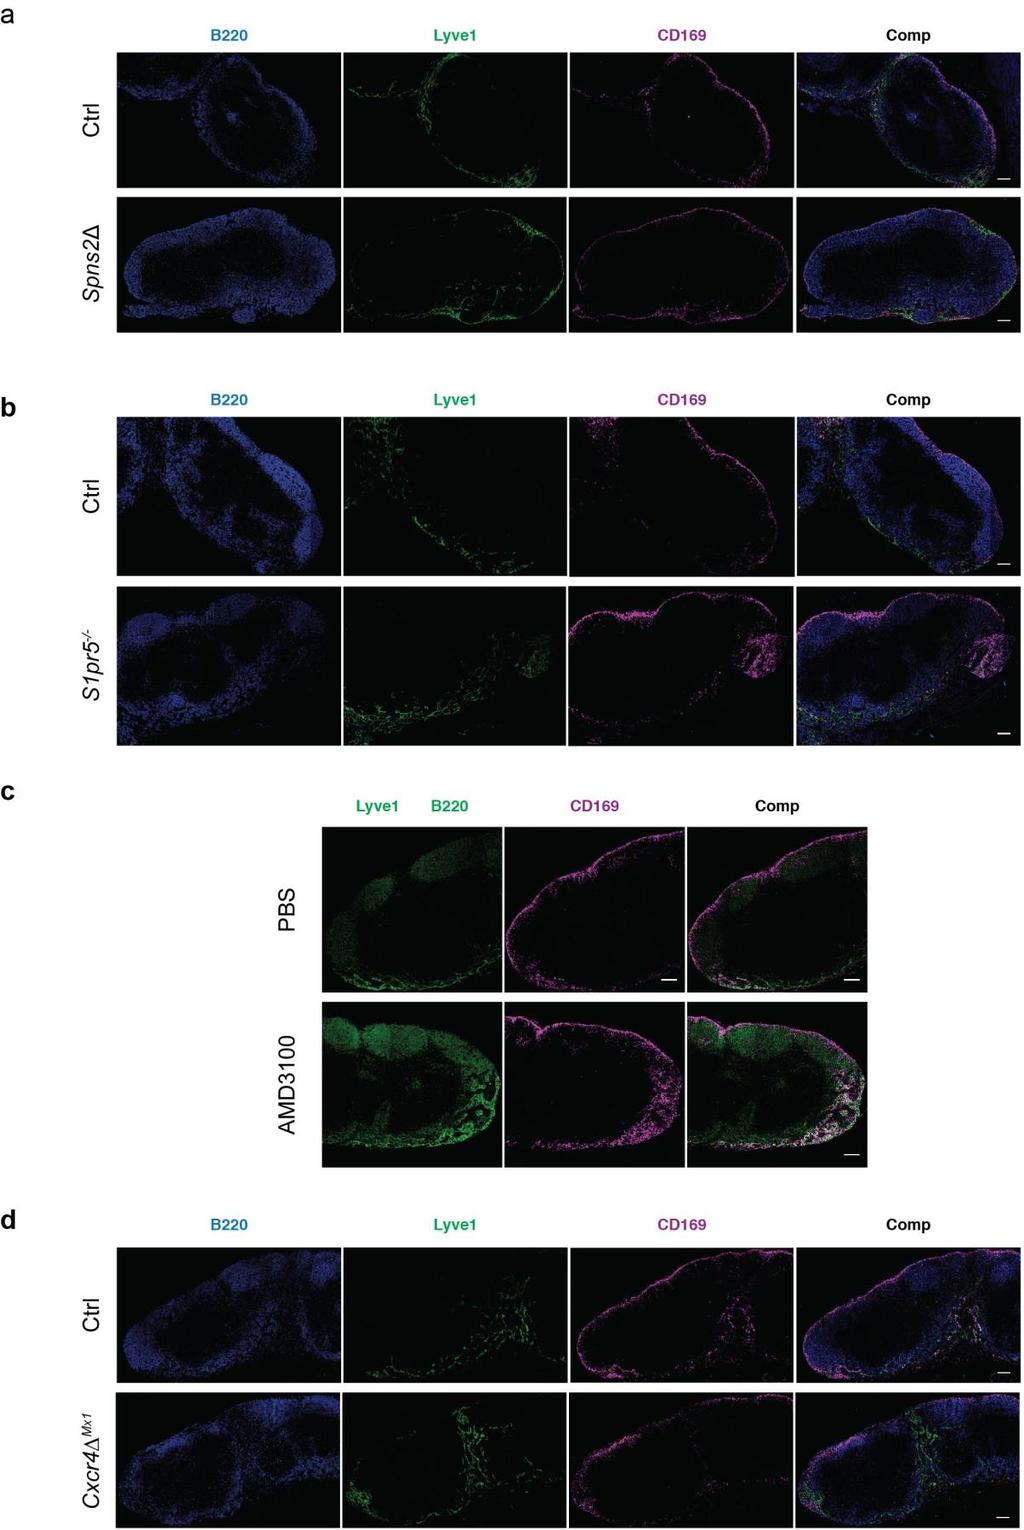
5 Supplementary Figure 3 NK cell defects are not accompanied by gross mislocalization of CD169 + macrophages. In WT mice, CD169 + macrophages line the SCS and medullary sinuses 32. Representative images of LN from the indicated animals showing localization of macrophages. B cells were stained with anti-b220, LEC and some sinus-lining macrophages with anti-lyve1, and a subset of macrophages with anti-cd169. Scale bars, 100 m. (a) LN sections from a Spns2 Lyve1 mouse (bottom) and littermate control (top). Representative of 2 pairs of mice in 2 experiments. (b) LN sections from an S1pr5 / mouse (bottom) and littermate control (top). Representative of 2 pairs of mice in 2 experiments. (c) LN sections from an AMD3100-treated mouse (bottom) and PBS-treated control (top). B cells (B220) and LEC (Lyve1) were stained with the same fluorophore but can be distinguished by morphology. Representative of 2 pairs of mice in 2 experiments. (d) LN sections from a Cxcr4 Mx1 mouse (bottom) and littermate control (top). Representative of 2 pairs of mice in 2 experiments.
 and absolute number (right) in peripheral LN (2 inguinal, 2 axillary, 2 brachial) of Spns2 Lyve1 mice and littermate controls.")
6 Supplementary Figure 4 Cell-intrinsic requirement for S1PR5 in NK cell localization. (a) NK cell frequency in LN of Spns2 Lyve1 mice. NK cell frequency (left) and absolute number (right) in peripheral LN (2 inguinal, 2 axillary, 2 brachial) of Spns2 Lyve1 mice and littermate controls. As previously reported 26, 44, SPNS2-deficient mice have small LN compared to controls. Lines indicate the mean. Graphs compile 6 pairs of mice analyzed in 3 experiments. *, p<0.05 (unpaired Student s 2-tailed t-test). (b) NK cell frequency in LN of S1pr5 / mice. NK cell frequency (left) and absolute number (right) in peripheral LN (2 inguinal, 2 axillary, 2 brachial) of S1pr5 / mice and littermate controls. Lines indicate the mean. Graphs compile 6 (left) or 5 (right) pairs of mice analyzed in 4 (left) or 3 (right) experiments. *, p<0.05 (paired Student s 2-tailed t-test).
7 (c) Original images for Fig. 4f. LN sections were stained with antibodies against NK1.1 (magenta), Lyve1 (blue), and B220 (blue) (although they were both stained with BV421-conjugated antibodies, Lyve1 + LEC and macrophages and B220 + B cells can be readily distinguished by morphology). Note: the occasional cells expressing very bright GFP did not co-stain with NK1.1. Scale bars, 200 m. Insets: Green arrows indicate GFP + NK cells. White arrows indicate GFP - NK cells. Single channel images of GFP are shown at the bottom. Scale bars, 20 m.
8 Supplementary Figure 5 NK cell localization during infection. (a) NK cell frequency in LN of AMD3100-treated mice. NK cell frequency (left) and absolute number (right) in peripheral LN (2 inguinal, 2 axillary, 2 brachial) of AMD3100- or PBS-treatedmice. LN were harvested 2h after treatment. Lines indicate the mean. Graphs compile 6 pairs of mice analyzed in 2 experiments. (b) A subset of LN NK cells expresses CXCR3 during homeostasis. Surface CXCR3 staining on LN NK cells (NK1.1 + CD3 ) and CD4 + T cells in a representative Spns2 Lyve1 mouse and littermate control. Representative of 4 pairs of mice in 2 experiments.
9 macro "LN Reporter Regions" { //Draw 4 sets of ROI's and place them in the same folder as the image. //set GFP and RFP thresholds by the negative image var thresholdgfp = 16; var thresholdrfp = 23; var thresholdpe = 4; var thresholdf480 = 32; //get image attributes name = getinfo("image.filename"); original = getimageid(); originaltitle = gettitle(); from"); //Set the directory where files will be pulled from and saved to OpenDir=getDirectory("Choose the folder where data will be pulled DataDir=getDirectory("Choose the folder where data will be saved"); //convert to 32 bit run("32-bit"); // split channels and threshold the GFP and RFP images. //If GFP=0, the ratio image will be 0, and will become NaN during background/nan step //If RFP=0, the ratio will be x/0, which should return NaN, due to Misc options run("duplicate...", "title=gfpimage duplicate channels=1"); GFPImage = getimageid(); GFPImageTitle = gettitle(); changevalues(0, thresholdgfp, 0) selectimage(original); run("duplicate...", "title=rfpimage duplicate channels=2"); RFPImage = getimageid(); RFPImageTitle = gettitle(); changevalues(0, thresholdrfp, 0) // divide GFPImage by RFPImage run("misc...", "divide=nan"); imagecalculator("divide create 32-bit", GFPImage, RFPImage); rename("ratioimage"); RatioImage = getimageid(); RatioImageTitle = gettitle(); // generation of membrane mask selectimage(original); run("duplicate...", "title=pe duplicate channels=3"); //run("median...", "radius=1.0"); setthreshold(thresholdpe, 255); run("convert to Mask", " black"); PEImage = getimageid(); rename("memmaskimage") //to make the mask values either 1 or 0. run("divide...", "value= "); MemMaskImage = getimageid();
10 MemMaskTitle = gettitle(); // calculate RFP to GFP ratio on membrane. imagecalculator("multiply create 32-bit", RatioImage, MemMaskImage); setthreshold(0.0001, ); run("nan Background"); rename(originaltitle + "MemRatio"); MemRatioImage = getimageid(); MemRatioTitle = gettitle(); run("fire"); saveas("tiff", DataDir+MemRatioTitle+".tif"); setminandmax(0.0000, 4.000); // cleanup and select results table //selectimage(original); close(); selectimage(rfpimage); close(); selectimage(gfpimage); close(); //selectimage(ratioimage); close(); //Ratio measurements run("set Measurements...", "area mean display redirect=none decimal=3"); roimanager("reset"); open(opendir + "RoiSetMed.zip"); ROICountMed=roiManager("Count");//=3 for (i=0; i<roicountmed; i++) { roimanager("select",i); roimanager("rename", "Med"); //roimanager("reset"); open(opendir + "RoiSetMedL.zip"); ROICountMedL=roiManager("Count"); for (i=roicountmed; i<roicountmedl; i++) { roimanager("select",i); roimanager("rename", "MedL"); //roimanager("measure"); //roimanager("reset"); open(opendir + "RoiSetT.zip"); ROICountT=roiManager("Count") for (i=roicountmedl; i<roicountt; i++) { roimanager("select",i); roimanager("rename", "T"); open(opendir + "RoiSetSCS.zip"); ROICountSCS=roiManager("Count") for (i=roicountt; i<roicountscs; i++) { roimanager("select",i); roimanager("rename", "SCS"); roimanager("deselect"); roimanager("measure"); // save the results table as an excel file //Adding the settings to the results table: i = nresults; // variable for counting, initialising with 0 setresult("image name", i, originaltitle);
11 setresult("thresholdgfp", i, thresholdgfp); // add a "Label" column to the results table and name the entry "point1" setresult("thresholdrfp", i, thresholdrfp); setresult("thresholdpe", i, thresholdpe); setresult("thresholdf480", i, thresholdf480); selectwindow("results"); saveas("results", DataDir + originaltitle + ".xls");!
12 macro "LN Reporter transduced primary T cells" { var thresholdgfp = 5; var thresholdrfp = 30; var thresholdpe = 12; from"); //get image attributes name = getinfo("image.filename"); original = getimageid(); originaltitle = gettitle(); shorttitle= substring(originaltitle, 0,11) CellROI="Cells " + substring(originaltitle, 0,11) + ".zip"; MedROI="MedROI.zip"; TROIs="TROI.zip"; TROI="TROI.zip"; //Set the directory where files will be pulled from and saved to OpenDir=getDirectory("Choose the folder where data will be pulled DataDir=getDirectory("Choose the folder where data will be saved"); //convert to 32 bit run("32-bit"); //split channels and threshold the GFP and RFP images. //If GFP=0, the ratio image will be 0, and will become NaN during background-->nan //If RFP=0, the ratio will be x/0, which should return NaN, as set in Misc options run("duplicate...", "title=gfpimage duplicate channels=1"); GFPImage = getimageid(); GFPImageTitle = gettitle(); changevalues(0, thresholdgfp, 0) selectimage(original); run("duplicate...", "title=rfpimage duplicate channels=2"); RFPImage = getimageid(); RFPImageTitle = gettitle(); changevalues(0, thresholdrfp, 0) // divide image1 by image2 run("misc...", "divide=nan"); imagecalculator("divide create 32-bit", GFPImage, RFPImage); rename("ratioimage"); RatioImage = getimageid(); RatioImageTitle = gettitle(); // generation of membrane mask //Mask the PE selectimage(original); run("duplicate...", "title=pe duplicate channels=3"); run("median...", "radius=.5"); setthreshold(thresholdpe, 255); run("convert to Mask", " black"); PEImage = getimageid(); rename("memmaskimage") //to make the mask values either 1 or 0.
13 run("divide...", "value= "); MemMaskImage = getimageid(); MemMaskTitle = gettitle(); // calculate RFP to GFP ratio on membrane. imagecalculator("multiply create 32-bit", RatioImage, MemMaskImage); //run("threshold..."); setthreshold(0.0001, ); run("nan Background"); rename(originaltitle + "MemRatio"); MemRatioImage = getimageid(); MemRatioTitle = gettitle(); run("fire"); setminandmax(0.0000, 1.000); saveas("tiff", DataDir+MemRatioTitle+".tif"); roimanager("reset"); if (File.exists(OpenDir + CellROI) == 1) x=x; else { settool("rectangle"); waitforuser("draw the T cell ROIs as small as possible"); roimanager("save", DataDir + CellROI); if (File.exists(OpenDir + MedROI) == 1) x = x; else { roimanager("reset"); settool("polygon"); waitforuser("draw the Medulla ROIs and add to manager"); ROICount=roiManager("Count");//=3 for (i=0; i<roicount; i++) { roimanager("select",i); roimanager("rename", "Med"); roimanager("save", DataDir + MedROI); //here, open all the ROIs, which are named properly now. Then open the T zone ROI. if (File.exists(OpenDir + TROIs) == 1 File.exists(OpenDir + TROI)) x = x; else { roimanager("reset"); settool("polygon"); waitforuser("draw the T zone ROIs and add to manager"); ROICount=roiManager("Count");//=3 for (i=0; i<roicount; i++) { roimanager("select",i); roimanager("rename", "T"); roimanager("save", DataDir + TROI); //generate a single ROI from all the TROIs roimanager("reset"); open(datadir + TROIs); ROICount=roiManager("Count"); roimanager("deselect"); roimanager("combine"); roimanager("add");
14 roimanager("select",roicount); roimanager("rename", "Whole T"); a1 = newarray(roicount); for (i=0; i<a1.length; i++) a1[i] = i; roimanager("select", a1); roimanager("delete"); //rename the cells that have a centroid inside the T zone open(datadir + CellROI); ROICount=roiManager("Count"); CellStart=1; CellEnd=ROICount-1; for (i=1; i<roicount; i++) { roimanager("select", i); Roi.getBounds(x, y, width, height); a= x+width/2; b= y+height/2; roimanager("select", 0); if (Roi.contains(a,b)==1) { roimanager("select", i); roimanager("rename", "T zone cell"); //open the medulla ROIs and generate a single ROI. ROICount1=roiManager("Count"); //9 open(datadir + MedROI); ROICount2=roiManager("Count"); //11 array = Array.getSequence(ROICount2); Selection=Array.slice(array,ROICount1,ROICount2); roimanager("select", Selection); roimanager("combine"); roimanager("add"); roimanager("select",roicount2); roimanager("rename", "Whole Med"); //rename the cells that have a centroid inside the medulla for (i=1; i<roicount; i++) { roimanager("select", i); Roi.getBounds(x, y, width, height); a= x+width/2; b= y+height/2; roimanager("select", ROICount2); if (Roi.contains(a,b)==1) { roimanager("select", i); roimanager("rename", "Med cell"); ROICountTotal=roiManager("Count"); //11 arraytotal = Array.getSequence(ROICountTotal); SelectionFinal=Array.slice(arrayTotal,ROICount,ROICountTotal); selectwindow(memratiotitle+".tif"); roimanager("select", SelectionFinal); roimanager("delete"); roimanager("select", 0); //deleting the T zone ROI roimanager("delete"); //Measure the cell ratios
15 run("set Measurements...", "area mean display redirect=none decimal=3"); roimanager("deselect"); roimanager("measure"); i = nresults; // variable for counting, initialising with 0 setresult("image name", i, originaltitle); setresult("thresholdgfp", i, thresholdgfp); // add a "Label" column to the results table and name the entry "point1" setresult("thresholdrfp", i, thresholdrfp); setresult("thresholdpe", i, thresholdpe); selectwindow("results"); saveas("results", DataDir + shorttitle + ".xls");
Supplementary Figure 1. Nature Neuroscience: doi: /nn.4547
 Supplementary Figure 1 Characterization of the Microfetti mouse model. (a) Gating strategy for 8-color flow analysis of peripheral Ly-6C + monocytes from Microfetti mice 5-7 days after TAM treatment. Living
SUPPLEMENTARY INFORMATION
 doi:1.138/nature1554 a TNF-α + in CD4 + cells [%] 1 GF SPF 6 b IL-1 + in CD4 + cells [%] 5 4 3 2 1 Supplementary Figure 1. Effect of microbiota on cytokine profiles of T cells in GALT. Frequencies of TNF-α
% of live splenocytes. STAT5 deletion. (open shapes) % ROSA + % floxed
 % ROSA + % floxed") Supp. Figure 1. a 14 1 1 8 6 spleen cells (x1 6 ) 16 % of live splenocytes 5 4 3 1 % of live splenocytes 8 6 4 b 1 1 c % of CD11c + splenocytes (closed shapes) 8 6 4 8 6 4 % ROSA + (open shapes) % floxed
Supp. Figure 1. a 14 1 1 8 6 spleen cells (x1 6 ) 16 % of live splenocytes 5 4 3 1 % of live splenocytes 8 6 4 b 1 1 c % of CD11c + splenocytes (closed shapes) 8 6 4 8 6 4 % ROSA + (open shapes) % floxed
Macrophages form functional vascular mimicry channels in vivo. SI Figures and Legend
 Macrophages form functional vascular mimicry channels in vivo Authors: *Faith H. Barnett, *Mauricio Rosenfeld, Malcolm Wood, William Kiosses, Yoshihiko Usui, Valentina Marchetti, Edith Aguilar, and Martin
Nature Immunology: doi: /ni Supplementary Figure 1
 Supplementary Figure 1 NLRP12 is downregulated in biopsy samples from patients with active ulcerative colitis (UC). (a-g) NLRP12 expression in 7 UC mrna profiling studies deposited in NCBI GEO database.
activation with anti-cd3/cd28 beads and 3d following transduction. Supplemental Figure 2 shows
 Supplemental Data Supplemental Figure 1 compares CXCR4 expression in untreated CD8 + T cells, following activation with anti-cd3/cd28 beads and 3d following transduction. Supplemental Figure 2 shows the
Specimen. Humeral Head. Femoral Head. Objective. Femoral Condyle (medial) Supplementary Figure 1
 Supplementary Figure 1") A B Specimen Humeral Head 2 1 µm 76 µm Femoral Head Objective Femoral Condyle (medial) Supplementary Figure 1 A Femoral Head Global Cell Density Superficial Cell Density Cell Number at 1 µm Nuclei /.1
A B Specimen Humeral Head 2 1 µm 76 µm Femoral Head Objective Femoral Condyle (medial) Supplementary Figure 1 A Femoral Head Global Cell Density Superficial Cell Density Cell Number at 1 µm Nuclei /.1
Endogenous TNFα orchestrates the trafficking of neutrophils into and within lymphatic vessels during acute inflammation
 SUPPLEMENTARY INFORMATION Endogenous TNFα orchestrates the trafficking of neutrophils into and within lymphatic vessels during acute inflammation Samantha Arokiasamy 1,2, Christian Zakian 1, Jessica Dilliway
(a) Significant biological processes (upper panel) and disease biomarkers (lower panel)
 Significant biological processes (upper panel) and disease biomarkers (lower panel)") Supplementary Figure 1. Functional enrichment analyses of secretomic proteins. (a) Significant biological processes (upper panel) and disease biomarkers (lower panel) 2 involved by hrab37-mediated secretory
Supplementary Figure 1. Functional enrichment analyses of secretomic proteins. (a) Significant biological processes (upper panel) and disease biomarkers (lower panel) 2 involved by hrab37-mediated secretory
Supplementary Figure 1
 Supplementary Figure 1 Genetic labeling of microglia Male and female 2-3 month-old CreERT2;R26-tdTomato mice or CreERT2;R26-tdTomato;Iba1-eGFP transgenic mice were treated with 1x, 2x (48 h apart), or
SUPPLEMENTARY INFORMATION
 doi:10.1038/nature10134 Supplementary Figure 1. Anti-inflammatory activity of sfc. a, Autoantibody immune complexes crosslink activating Fc receptors, promoting activation of macrophages, and WWW.NATURE.COM/NATURE
Supplemental Materials for. Effects of sphingosine-1-phosphate receptor 1 phosphorylation in response to. FTY720 during neuroinflammation
 Supplemental Materials for Effects of sphingosine-1-phosphate receptor 1 phosphorylation in response to FTY7 during neuroinflammation This file includes: Supplemental Table 1. EAE clinical parameters of
Supplementary Figure 1. Deletion of Smad3 prevents B16F10 melanoma invasion and metastasis in a mouse s.c. tumor model.
 A B16F1 s.c. Lung LN Distant lymph nodes Colon B B16F1 s.c. Supplementary Figure 1. Deletion of Smad3 prevents B16F1 melanoma invasion and metastasis in a mouse s.c. tumor model. Highly invasive growth
NKTR-255: Accessing IL-15 Therapeutic Potential through Robust and Sustained Engagement of Innate and Adaptive Immunity
 NKTR-255: Accessing IL-15 Therapeutic Potential through Robust and Sustained Engagement of Innate and Adaptive Immunity Peiwen Kuo Scientist, Research Biology Nektar Therapeutics August 31 st, 2018 Emerging
Supplementary Figure 1.
 Supplementary Figure 1. Female Pro-ins2 -/- mice at 5-6 weeks of age were either inoculated i.p. with a single dose of CVB4 (1x10 5 PFU/mouse) or PBS and treated with αgalcer or control vehicle. On day
Nature Neuroscience: doi: /nn Supplementary Figure 1. Splenic atrophy and leucopenia caused by T3 SCI.
 Supplementary Figure 1 Splenic atrophy and leucopenia caused by T3 SCI. (a) Gross anatomy of representative spleens from control and T3 SCI mice at 28 days post-injury. (b and c) Hematoxylin and eosin
SUPPLEMENTARY INFORMATION
 1. Supplementary Figures and Legends Supplementary Fig. 1. S1P-mediated transcriptional regulation of integrins expressed in OP/monocytoid cells. Real-time quantitative PCR analyses of mrna for two integrins,
Supplementary Figure 1.
 Supplementary Figure 1. Transduction of adipocytes after intra-ewat administration of AAV vectors. A: Immunostaining against GFP (green) in sections of ewat two weeks after the intra-ewat administration
Pathologic Stage. Lymph node Stage
 ASC ASC a c Patient ID BMI Age Gleason score Non-obese PBMC 1 22.1 81 6 (3+3) PBMC 2 21.9 6 6 (3+3) PBMC 3 22 84 8 (4+4) PBMC 4 24.6 68 7 (3+4) PBMC 24. 6 (3+3) PBMC 6 24.7 73 7 (3+4) PBMC 7 23. 67 7 (3+4)
Supplemental Figure S1. RANK expression on human lung cancer cells.
 Supplemental Figure S1. RANK expression on human lung cancer cells. (A) Incidence and H-Scores of RANK expression determined from IHC in the indicated primary lung cancer subgroups. The overall expression
Supplementary Figure 1. Repression of hepcidin expression in the liver of mice treated with
 Supplementary Figure 1. Repression of hepcidin expression in the liver of mice treated with DMN Immunohistochemistry for hepcidin and H&E staining (left). qrt-pcr assays for hepcidin in the liver (right).
Supplementary Information. Tissue-wide immunity against Leishmania. through collective production of nitric oxide
 Supplementary Information Tissue-wide immunity against Leishmania through collective production of nitric oxide Romain Olekhnovitch, Bernhard Ryffel, Andreas J. Müller and Philippe Bousso Supplementary
Supplemental Material
 Supplemental Material Supplementary Fig. 1. EETs stimulate primary tumor growth. a) Schematic presentation of genetic and pharmacological tools used to manipulate endogenous EET levels. b) Endothelial
Supplementary Figures
 Supplementary Figures Supplementary Figure 1 Characterization of stable expression of GlucB and sshbira in the CT26 cell line (a) Live cell imaging of stable CT26 cells expressing green fluorescent protein
Supplementary Figure S1 (a) (b)
 (b)") Supplementary Figure S1: IC87114 does not affect basal Ca 2+ level nor nicotineinduced Ca 2+ influx. (a) Bovine chromaffin cells were loaded with Fluo-4AM (1 μm) in buffer A containing 0.02% of pluronic
Supplementary Figure S1: IC87114 does not affect basal Ca 2+ level nor nicotineinduced Ca 2+ influx. (a) Bovine chromaffin cells were loaded with Fluo-4AM (1 μm) in buffer A containing 0.02% of pluronic
Afferent lymph-derived T cells and dendritic cells use different CCR7-dependent routes for lymph node entry and intranodal migration
 Braun et al. Supplementary Information 1 Supplementary Information Afferent lymph-derived T cells and dendritic cells use different CCR7-dependent routes for lymph node entry and intranodal migration Asolina
well for 2 h at rt. Each dot represents an individual mouse and bar is the mean ±
 Supplementary data: Control DC Blimp-1 ko DC 8 6 4 2-2 IL-1β p=.5 medium 8 6 4 2 IL-2 Medium p=.16 8 6 4 2 IL-6 medium p=.3 5 4 3 2 1-1 medium IL-1 n.s. 25 2 15 1 5 IL-12(p7) p=.15 5 IFNγ p=.65 4 3 2 1
Supplementary Figure 1 Chemokine and chemokine receptor expression during muscle regeneration (a) Analysis of CR3CR1 mrna expression by real time-pcr
 Analysis of CR3CR1 mrna expression by real time-pcr") Supplementary Figure 1 Chemokine and chemokine receptor expression during muscle regeneration (a) Analysis of CR3CR1 mrna expression by real time-pcr at day 0, 1, 4, 10 and 21 post- muscle injury. (b)
Supplementary Figure 1 Chemokine and chemokine receptor expression during muscle regeneration (a) Analysis of CR3CR1 mrna expression by real time-pcr at day 0, 1, 4, 10 and 21 post- muscle injury. (b)
Programmed necrosis, not apoptosis, is a key mediator of cell loss and DAMP-mediated inflammation in dsrna-induced retinal degeneration
 Programmed necrosis, not apoptosis, is a key mediator of cell loss and DAMP-mediated inflammation in dsrna-induced retinal degeneration The Harvard community has made this article openly available. Please
Nature Immunology: doi: /ni Supplementary Figure 1. Id2 and Id3 define polyclonal T H 1 and T FH cell subsets.
 Supplementary Figure 1 Id2 and Id3 define polyclonal T H 1 and T FH cell subsets. Id2 YFP/+ (a) or Id3 GFP/+ (b) mice were analyzed 7 days after LCMV infection. T H 1 (SLAM + CXCR5 or CXCR5 PD-1 ), T FH
McWilliams et al., http :// /cgi /content /full /jcb /DC1
 Supplemental material JCB McWilliams et al., http ://www.jcb.org /cgi /content /full /jcb.201603039 /DC1 THE JOURNAL OF CELL BIOLOGY Figure S1. In vitro characterization of mito-qc. (A and B) Analysis
a 10 4 Link et al. Supplementary Figure 1 Nature Immunology: doi: /ni.1842 Cells per mouse ( 10 5 ) TRPV2KO anti-gr1 anti-gr anti-f4/80
 TRPV2KO anti-gr1 anti-gr anti-f4/80") a 10 4 WT 10 4 TRPV2KO 10 3 10 3 anti-gr1 10 2 10 1 anti-gr1 10 2 10 1 10 0 10 0 10 1 10 2 10 3 10 4 anti-f4/80 42.3 45.2 10 0 10 0 10 1 10 2 10 3 10 4 anti-f4/80 10 4 10 4 40 42.5 anti-cd11b 10 3 10 2
a 10 4 WT 10 4 TRPV2KO 10 3 10 3 anti-gr1 10 2 10 1 anti-gr1 10 2 10 1 10 0 10 0 10 1 10 2 10 3 10 4 anti-f4/80 42.3 45.2 10 0 10 0 10 1 10 2 10 3 10 4 anti-f4/80 10 4 10 4 40 42.5 anti-cd11b 10 3 10 2
Supplementary Material
 Supplementary Material accompanying the manuscript Interleukin 37 is a fundamental inhibitor of innate immunity Marcel F Nold, Claudia A Nold-Petry, Jarod A Zepp, Brent E Palmer, Philip Bufler & Charles
Supplementary Figure 1: STAT3 suppresses Kras-induced lung tumorigenesis
 Supplementary Figure 1: STAT3 suppresses Kras-induced lung tumorigenesis (a) Immunohistochemical (IHC) analysis of tyrosine 705 phosphorylation status of STAT3 (P- STAT3) in tumors and stroma (all-time
IL-34 is a tissue-restricted ligand of CSF1R required for the development of Langerhans cells and microglia
 Supplementary Figures IL-34 is a tissue-restricted ligand of CSF1R required for the development of Langerhans cells and microglia Yaming Wang, Kristy J. Szretter, William Vermi, Susan Gilfillan, Cristina
ECM1 controls T H 2 cell egress from lymph nodes through re-expression of S1P 1
 ZH, Li et al, page 1 ECM1 controls T H 2 cell egress from lymph nodes through re-expression of S1P 1 Zhenhu Li 1,4,Yuan Zhang 1,4, Zhiduo Liu 1, Xiaodong Wu 1, Yuhan Zheng 1, Zhiyun Tao 1, Kairui Mao 1,
Supplemental Figure 1. Signature gene expression in in vitro differentiated Th0, Th1, Th2, Th17 and Treg cells. (A) Naïve CD4 + T cells were cultured
 Naïve CD4 + T cells were cultured") Supplemental Figure 1. Signature gene expression in in vitro differentiated Th0, Th1, Th2, Th17 and Treg cells. (A) Naïve CD4 + T cells were cultured under Th0, Th1, Th2, Th17, and Treg conditions. mrna
Supplemental Figure 1. Signature gene expression in in vitro differentiated Th0, Th1, Th2, Th17 and Treg cells. (A) Naïve CD4 + T cells were cultured under Th0, Th1, Th2, Th17, and Treg conditions. mrna
marker. DAPI labels nuclei. Flies were 20 days old. Scale bar is 5 µm. Ctrl is
 Supplementary Figure 1. (a) Nos is detected in glial cells in both control and GFAP R79H transgenic flies (arrows), but not in deletion mutant Nos Δ15 animals. Repo is a glial cell marker. DAPI labels
Supplemental Information. Checkpoint Blockade Immunotherapy. Induces Dynamic Changes. in PD-1 CD8 + Tumor-Infiltrating T Cells
 Immunity, Volume 50 Supplemental Information Checkpoint Blockade Immunotherapy Induces Dynamic Changes in PD-1 CD8 + Tumor-Infiltrating T Cells Sema Kurtulus, Asaf Madi, Giulia Escobar, Max Klapholz, Jackson
Supplementary Figure 1
 Supplementary Figure 1 AAV-GFP injection in the MEC of the mouse brain C57Bl/6 mice at 4 months of age were injected with AAV-GFP into the MEC and sacrificed at 7 days post injection (dpi). (a) Brains
Nature Immunology: doi: /ni Supplementary Figure 1. Gene expression profile of CD4 + T cells and CTL responses in Bcl6-deficient mice.
 Supplementary Figure 1 Gene expression profile of CD4 + T cells and CTL responses in Bcl6-deficient mice. (a) Gene expression profile in the resting CD4 + T cells were analyzed by an Affymetrix microarray
Title of file for HTML: Supplementary Information Description: Supplementary Figures and Supplementary Table
 Title of file for HTML: Supplementary Information Description: Supplementary Figures and Supplementary Table Title of file for HTML: Peer Review File Description: Innate Scavenger Receptor-A regulates
NKTR-255: Accessing The Immunotherapeutic Potential Of IL-15 for NK Cell Therapies
 NKTR-255: Accessing The Immunotherapeutic Potential Of IL-15 for NK Cell Therapies Saul Kivimäe Senior Scientist, Research Biology Nektar Therapeutics NK Cell-Based Cancer Immunotherapy, September 26-27,
fl/+ KRas;Atg5 fl/+ KRas;Atg5 fl/fl KRas;Atg5 fl/fl KRas;Atg5 Supplementary Figure 1. Gene set enrichment analyses. (a) (b)
 (b)") KRas;At KRas;At KRas;At KRas;At a b Supplementary Figure 1. Gene set enrichment analyses. (a) GO gene sets (MSigDB v3. c5) enriched in KRas;Atg5 fl/+ as compared to KRas;Atg5 fl/fl tumors using gene set
KRas;At KRas;At KRas;At KRas;At a b Supplementary Figure 1. Gene set enrichment analyses. (a) GO gene sets (MSigDB v3. c5) enriched in KRas;Atg5 fl/+ as compared to KRas;Atg5 fl/fl tumors using gene set
Supplementary Figure 1 Cytokine receptors on developing thymocytes that can potentially signal Runx3d expression.
 Supplementary Figure 1 Cytokine receptors on developing thymocytes that can potentially signal Runx3d expression. (a) Characterization of c-independent SP8 cells. Stainings for maturation markers (top)
Wenqin Hu, Cuiping Tian, Tun Li, Mingpo Yang, Han Hou & Yousheng Shu
 Distinct contributions of Na v 1.6 and Na v 1.2 in action potential initiation and backpropagation Wenqin Hu, Cuiping Tian, Tun Li, Mingpo Yang, Han Hou & Yousheng Shu Supplementary figure and legend Supplementary
Nature Immunology: doi: /ni Supplementary Figure 1. Transcriptional program of the TE and MP CD8 + T cell subsets.
 Supplementary Figure 1 Transcriptional program of the TE and MP CD8 + T cell subsets. (a) Comparison of gene expression of TE and MP CD8 + T cell subsets by microarray. Genes that are 1.5-fold upregulated
SUPPLEMENTARY FIGURES
 SUPPLEMENTARY FIGURES Supplementary Figure 1: Chemokine receptor expression profiles of CCR6 + and CCR6 - CD4 + IL-17A +/ex and Treg cells. Quantitative PCR analysis of chemokine receptor transcript abundance
Supplementary Figure 1. Characterization of basophils after reconstitution of SCID mice
 Supplementary figure legends Supplementary Figure 1. Characterization of after reconstitution of SCID mice with CD4 + CD62L + T cells. (A-C) SCID mice (n = 6 / group) were reconstituted with 2 x 1 6 CD4
Supplemental Figures:
 Supplemental Figures: Figure 1: Intracellular distribution of VWF by electron microscopy in human endothelial cells. a) Immunogold labeling of LC3 demonstrating an LC3-positive autophagosome (white arrow)
SUPPLEMENTARY FIGURES
 SUPPLEMENTARY FIGURES 1 Supplementary Figure 1, Adult hippocampal QNPs and TAPs uniformly express REST a-b) Confocal images of adult hippocampal mouse sections showing GFAP (green), Sox2 (red), and REST
Hormonal gain control of a medial preoptic area social reward circuit
 CORRECTION NOTICE Nat. Neurosci. 20, 449 458 (2017) Hormonal gain control of a medial preoptic area social reward circuit Jenna A McHenry, James M Otis, Mark A Rossi, J Elliott Robinson, Oksana Kosyk,
SUPPLEMENTARY INFORMATION
 a. Smo+/+ b. Smo+/+ 5.63 5.48 c. Lin- d. e. 6 5 4 3 Ter119 Mac B T Sca1 Smo+/+ 25 15 2 o BMT 2 1 5 * Supplementary Figure 1: Deletion of Smoothened does not alter the frequency of hematopoietic lineages
Supplementary Materials. for Garmy-Susini, et al, Integrin 4 1 signaling is required for lymphangiogenesis and tumor metastasis
 Supplementary Materials for Garmy-Susini, et al, Integrin 4 1 signaling is required for lymphangiogenesis and tumor metastasis 1 Supplementary Figure Legends Supplementary Figure 1: Integrin expression
Type of file: PDF Title of file for HTML: Supplementary Information Description: Supplementary Figures
 Type of file: PDF Title of file for HTML: Supplementary Information Description: Supplementary Figures Type of file: MOV Title of file for HTML: Supplementary Movie 1 Description: NLRP3 is moving along
Supplementary Figure 1) GABAergic enhancement by leptin hyperpolarizes POMC neurons A) Representative recording samples showing the membrane
 GABAergic enhancement by leptin hyperpolarizes POMC neurons A) Representative recording samples showing the membrane") Supplementary Figure 1) GABAergic enhancement by leptin hyperpolarizes POMC neurons A) Representative recording samples showing the membrane potential recorded from POMC neurons following treatment with
Supplementary Figure 1) GABAergic enhancement by leptin hyperpolarizes POMC neurons A) Representative recording samples showing the membrane potential recorded from POMC neurons following treatment with
Dep. Control Time (min)
") aa Control Dep. RP 1s 1 mv 2s 1 mv b % potentiation of IPSP 2 15 1 5 Dep. * 1 2 3 4 Time (min) Supplementary Figure 1. Rebound potentiation of IPSPs in PCs. a, IPSPs recorded with a K + gluconate pipette
aa Control Dep. RP 1s 1 mv 2s 1 mv b % potentiation of IPSP 2 15 1 5 Dep. * 1 2 3 4 Time (min) Supplementary Figure 1. Rebound potentiation of IPSPs in PCs. a, IPSPs recorded with a K + gluconate pipette
effect on the upregulation of these cell surface markers. The mean peak fluorescence intensity
 SUPPLEMENTARY FIGURE 1 Supplementary Figure 1 ASIC1 disruption or blockade does not effect in vitro and in vivo antigen-presenting cell activation. (a) Flow cytometric analysis of cell surface molecules
Supplementary Materials for
 www.sciencesignaling.org/cgi/content/full/8/381/ra59/dc1 Supplementary Materials for Analysis of single-cell cytokine secretion reveals a role for paracrine signaling in coordinating macrophage responses
Supplemental Table 1. Primer sequences for transcript analysis
 Supplemental Table 1. Primer sequences for transcript analysis Primer Sequence (5 3 ) Primer Sequence (5 3 ) Mmp2 Forward CCCGTGTGGCCCTC Mmp15 Forward CGGGGCTGGCT Reverse GCTCTCCCGGTTTC Reverse CCTGGTGTGCCTGCTC
Supplementary Figure 1
 Supplementary Figure 1 Miniature microdrive, spike sorting and sleep stage detection. a, A movable recording probe with 8-tetrodes (32-channels). It weighs ~1g. b, A mouse implanted with 8 tetrodes in
B220 CD4 CD8. Figure 1. Confocal Image of Sensitized HLN. Representative image of a sensitized HLN
 B220 CD4 CD8 Natarajan et al., unpublished data Figure 1. Confocal Image of Sensitized HLN. Representative image of a sensitized HLN showing B cell follicles and T cell areas. 20 µm thick. Image of magnification
Supplementary Figure S1: Tanycytes are restricted to the central/posterior hypothalamus
 Supplementary Figure S1: Tanycytes are restricted to the central/posterior hypothalamus a: Expression of Vimentin, GFAP, Sox2 and Nestin in anterior, central and posterior hypothalamus. In the anterior
SUPPLEMENTARY INFORMATION
 doi: 10.1038/nature06994 A phosphatase cascade by which rewarding stimuli control nucleosomal response A. Stipanovich*, E. Valjent*, M. Matamales*, A. Nishi, J.H. Ahn, M. Maroteaux, J. Bertran-Gonzalez,
File name: Supplementary Information Description: Supplementary Figures, Supplementary Table and Supplementary References
 File name: Supplementary Information Description: Supplementary Figures, Supplementary Table and Supplementary References File name: Supplementary Data 1 Description: Summary datasheets showing the spatial
Supplementary Figure 1: TSLP receptor skin expression in dcssc. A: Healthy control (HC) skin with TSLP receptor expression in brown (10x
 skin with TSLP receptor expression in brown (10x") Supplementary Figure 1: TSLP receptor skin expression in dcssc. A: Healthy control (HC) skin with TSLP receptor expression in brown (10x magnification). B: Second HC skin stained for TSLP receptor in brown
Supplementary Figure 1: TSLP receptor skin expression in dcssc. A: Healthy control (HC) skin with TSLP receptor expression in brown (10x magnification). B: Second HC skin stained for TSLP receptor in brown
Interleukin-2-Dependent Allergen-Specific Tissue-Resident Memory Cells Drive Asthma
 Immunity Supplemental Information Interleukin-2-Dependent Allergen-Specific Tissue-Resident Memory Cells Drive Asthma Brian D. Hondowicz, Dowon An, Jason M. Schenkel, Karen S. Kim, Holly R. Steach, Akshay
Supplementary Figure 1 Information on transgenic mouse models and their recording and optogenetic equipment. (a) 108 (b-c) (d) (e) (f) (g)
 108 (b-c) (d) (e) (f) (g)") Supplementary Figure 1 Information on transgenic mouse models and their recording and optogenetic equipment. (a) In four mice, cre-dependent expression of the hyperpolarizing opsin Arch in pyramidal cells
Supplementary Figure 1 Information on transgenic mouse models and their recording and optogenetic equipment. (a) In four mice, cre-dependent expression of the hyperpolarizing opsin Arch in pyramidal cells
ndln NK Cells (x10 3 ) Days post-infection (A/PR/8) *** *** *** Liver NK Cells (x10 4 ) Days post-infection (MCMV)
 Days post-infection (A/PR/8) *** *** *** Liver NK Cells (x10 4 ) Days post-infection (MCMV)") A mln NK Cells(x ) 6 1 * ndln NK Cells (x ) ns C Lung NK Cells(x ) 1 1 7 * D LN NK Cells (x ) 1 7 1 7 Days post-infection (A/PR/8) * * E Liver NK Cells (x ) 1 7 Days post-infection (A/PR/8) * * * 1 7 Days
A mln NK Cells(x ) 6 1 * ndln NK Cells (x ) ns C Lung NK Cells(x ) 1 1 7 * D LN NK Cells (x ) 1 7 1 7 Days post-infection (A/PR/8) * * E Liver NK Cells (x ) 1 7 Days post-infection (A/PR/8) * * * 1 7 Days
Supplemental Information. Tissue Myeloid Progenitors Differentiate. into Pericytes through TGF-b Signaling. in Developing Skin Vasculature
 Cell Reports, Volume 18 Supplemental Information Tissue Myeloid Progenitors Differentiate into Pericytes through TGF-b Signaling in Developing Skin Vasculature Tomoko Yamazaki, Ani Nalbandian, Yutaka Uchida,
Supplementary information
 Supplementary information Intrahepatic myeloid cell-aggregates enable local CD8 + T cell expansion and successful immunotherapy against chronic viral liver infection Li- Rung Huang, Dirk Wohlleber, Florian
Supplementary Materials for
 www.sciencetranslationalmedicine.org/cgi/content/full/4/117/117ra8/dc1 Supplementary Materials for Notch4 Normalization Reduces Blood Vessel Size in Arteriovenous Malformations Patrick A. Murphy, Tyson
pplementary Figur Supplementary Figure 1. a.
 pplementary Figur Supplementary Figure 1. a. Quantification by RT-qPCR of YFV-17D and YFV-17D pol- (+) RNA in the supernatant of cultured Huh7.5 cells following viral RNA electroporation of respective
Nature Biotechnology: doi: /nbt.3828
 Supplementary Figure 1 Development of a FRET-based MCS. (a) Linker and MA2 modification are indicated by single letter amino acid code. indicates deletion of amino acids and N or C indicate the terminus
In Vivo Imaging of Virological Synapses
 In Vivo Imaging of Virological Synapses Xaver Sewald 1, David G. Gonzalez 2, Ann M. Haberman 2, and Walther Mothes 1 * 1 Department of Microbial Pathogenesis, Yale University School of Medicine, New Haven,
Supplementary Figures
 Supplementary Figures Supplementary Figure 1. NKT ligand-loaded tumour antigen-presenting B cell- and monocyte-based vaccine induces NKT, NK and CD8 T cell responses. (A) The cytokine profiles of liver
Nature Immunology: doi: /ni Supplementary Figure 1. Cytokine pattern in skin in response to urushiol.
 Supplementary Figure 1 Cytokine pattern in skin in response to urushiol. Wild-type (WT) and CD1a-tg mice (n = 3 per group) were sensitized and challenged with urushiol (uru) or vehicle (veh). Quantitative
Supplementary Figure 1. Normal T lymphocyte populations in Dapk -/- mice. (a) Normal thymic development in Dapk -/- mice. Thymocytes from WT and Dapk
 Normal thymic development in Dapk -/- mice. Thymocytes from WT and Dapk") Supplementary Figure 1. Normal T lymphocyte populations in Dapk -/- mice. (a) Normal thymic development in Dapk -/- mice. Thymocytes from WT and Dapk -/- mice were stained for expression of CD4 and CD8.
Supplementary Figure 1. Normal T lymphocyte populations in Dapk -/- mice. (a) Normal thymic development in Dapk -/- mice. Thymocytes from WT and Dapk -/- mice were stained for expression of CD4 and CD8.
The encephalitogenicity of TH17 cells is dependent on IL-1- and IL-23- induced production of the cytokine GM-CSF
 CORRECTION NOTICE Nat.Immunol. 12, 568 575 (2011) The encephalitogenicity of TH17 cells is dependent on IL-1- and IL-23- induced production of the cytokine GM-CSF Mohamed El-Behi, Bogoljub Ciric, Hong
Supplementary Figures
 Supplementary Figures Supplementary Fig. 1. Galectin-3 is present within tumors. (A) mrna expression levels of Lgals3 (galectin-3) and Lgals8 (galectin-8) in the four classes of cell lines as determined
Supplementary Materials for
 www.sciencetranslationalmedicine.org/cgi/content/full/8/352/352ra110/dc1 Supplementary Materials for Spatially selective depletion of tumor-associated regulatory T cells with near-infrared photoimmunotherapy
mm Distance (mm)
") b a Magnet Illumination Coverslips MPs Objective 2575 µm 1875 µm 1575 µm 1075 µm 875 µm 545 µm 20µm 2 3 0.5 0.3mm 1 1000 100 10 1 0.1 1000 100 10 1 0.1 Field Induction (Gauss) 1.5 0 5 10 15 20 Distance
b a Magnet Illumination Coverslips MPs Objective 2575 µm 1875 µm 1575 µm 1075 µm 875 µm 545 µm 20µm 2 3 0.5 0.3mm 1 1000 100 10 1 0.1 1000 100 10 1 0.1 Field Induction (Gauss) 1.5 0 5 10 15 20 Distance
Nature Neuroscience: doi: /nn Supplementary Figure 1
 Supplementary Figure 1 Relative expression of K IR2.1 transcript to enos was reduced 29-fold in capillaries from knockout animals. Relative expression of K IR2.1 transcript to enos was reduced 29-fold
Supplementary Figure S1. Flow cytometric analysis of the expression of Thy1 in NH cells. Flow cytometric analysis of the expression of T1/ST2 and
 Supplementary Figure S1. Flow cytometric analysis of the expression of Thy1 in NH cells. Flow cytometric analysis of the expression of T1/ST2 and Thy1 in NH cells derived from the lungs of naïve mice.
SUPPLEMENTARY INFORMATION
 doi:10.1038/nature10188 Supplementary Figure 1. Embryonic epicardial genes are down-regulated from midgestation stages and barely detectable post-natally. Real time qrt-pcr revealed a significant down-regulation
Supplementary Materials for
 www.sciencemag.org/content/348/6241/aaa825/suppl/dc1 Supplementary Materials for A mucosal vaccine against Chlamydia trachomatis generates two waves of protective memory T cells Georg Stary,* Andrew Olive,
Postn MCM Smad2 fl/fl Postn MCM Smad3 fl/fl Postn MCM Smad2/3 fl/fl. Postn MCM. Tgfbr1/2 fl/fl TAC
 A Smad2 fl/fl Smad3 fl/fl Smad2/3 fl/fl Tgfbr1/2 fl/fl 1. mm B Tcf21 MCM Tcf21 MCM Smad3 fl/fl Tcf21 MCM Smad2/3 fl/fl Tcf21 MCM Tgfbr1/2 fl/fl αmhc MCM C 1. mm 1. mm D Smad2 fl/fl Smad3 fl/fl Smad2/3
Sequestration of T cells in bone marrow in the setting of glioblastoma and other intracranial tumors
 SUPPLEMENTARY INFORMATION Articles https://doi.org/1.138/s41591-18-135-2 In the format provided by the authors and unedited. Sequestration of T cells in bone marrow in the setting of glioblastoma and other
Supplementary Figure 1
 Supplementary Figure 1 YAP negatively regulates IFN- signaling. (a) Immunoblot analysis of Yap knockdown efficiency with sh-yap (#1 to #4 independent constructs) in Raw264.7 cells. (b) IFN- -Luc and PRDs
Supplementary Figure 1. Double-staining immunofluorescence analysis of invasive colon and breast cancers. Specimens from invasive ductal breast
 Supplementary Figure 1. Double-staining immunofluorescence analysis of invasive colon and breast cancers. Specimens from invasive ductal breast carcinoma (a) and colon adenocarcinoma (b) were staining
Supplementary Figure 1. mrna expression of chitinase and chitinase-like protein in splenic immune cells. Each splenic immune cell population was
 Supplementary Figure 1. mrna expression of chitinase and chitinase-like protein in splenic immune cells. Each splenic immune cell population was sorted by FACS. Surface markers for sorting were CD11c +
Expanded View Figures
 PEX13 functions in selective autophagy Ming Y Lee et al Expanded View Figures Figure EV1. PEX13 is required for Sindbis virophagy. A, B Quantification of mcherry-capsid puncta per cell (A) and GFP-LC3
Diabetic pdx1-mutant zebrafish show conserved responses to nutrient overload and anti-glycemic treatment
 Supplementary Information Diabetic pdx1-mutant zebrafish show conserved responses to nutrient overload and anti-glycemic treatment Robin A. Kimmel, Stefan Dobler, Nicole Schmitner, Tanja Walsen, Julia
Supplementary Figure 1
 Supplementary Figure 1 Identification of IFN-γ-producing CD8 + and CD4 + T cells with naive phenotype by alternative gating and sample-processing strategies. a. Contour 5% probability plots show definition
Astrocyte signaling controls spike timing-dependent depression at neocortical synapses
 Supplementary Information Astrocyte signaling controls spike timing-dependent depression at neocortical synapses Rogier Min and Thomas Nevian Department of Physiology, University of Berne, Bern, Switzerland
Supplementary Figure 1
 Supplementary Figure 1 The average sigmoid parametric curves of capillary dilation time courses and average time to 50% peak capillary diameter dilation computed from individual capillary responses averaged
Supplementary Figure 1. Generation of knockin mice expressing L-selectinN138G. (a) Schematics of the Sellg allele (top), the targeting vector, the
 Schematics of the Sellg allele (top), the targeting vector, the") Supplementary Figure 1. Generation of knockin mice expressing L-selectinN138G. (a) Schematics of the Sellg allele (top), the targeting vector, the targeted allele in ES cells, and the mutant allele in
Supplementary Figure 1. Generation of knockin mice expressing L-selectinN138G. (a) Schematics of the Sellg allele (top), the targeting vector, the targeted allele in ES cells, and the mutant allele in
293T cells were transfected with indicated expression vectors and the whole-cell extracts were subjected
 SUPPLEMENTARY INFORMATION Supplementary Figure 1. Formation of a complex between Slo1 and CRL4A CRBN E3 ligase. (a) HEK 293T cells were transfected with indicated expression vectors and the whole-cell
Supplementary Information
 Supplementary Information Title Degeneration and impaired regeneration of gray matter oligodendrocytes in amyotrophic lateral sclerosis Authors Shin H. Kang, Ying Li, Masahiro Fukaya, Ileana Lorenzini,
Human Innate Lymphoid Cells: crosstalk with CD4 + regulatory T cells and role in Type 1 Diabetes
 Joint Lab Meeting 03/03/2015 Human Innate Lymphoid Cells: crosstalk with CD4 + regulatory T cells and role in Type 1 Diabetes Caroline Raffin Bluestone Lab ILCs: Definition - Common lymphoid progenitor