Supplementary information. Nkx2.1 regulates the generation of telencephalic astrocytes during embryonic
|
|
|
- Gervais Lester
- 5 years ago
- Views:
Transcription
1 Supplementary information Nkx2.1 regulates the generation of telencephalic astrocytes during embryonic development Shilpi Minocha 1*, Delphine Valloton 1*, Yvan Arsenijevic 2, Jean-René Cardinaux 3, Raffaella Guidi 3, Jean-Pierre Hornung 1, and Cécile Lebrand 1,. 1 Department of Fundamental Neurosciences, University of Lausanne, Rue du Bugnon 9, CH-1005 Lausanne, Switzerland. 2 Department of Ophthalmology, University of Lausanne, Hôpital ophtalmique Jules- Gonin, Av. de France 15, CH-1004 Lausanne, Switzerland. 3 Department of Psychiatry, Center for Psychiatric Neuroscience, Lausanne University Hospital, Prilly, CH-1008 Lausanne, Switzerland. : Correspondence to Dr. Cécile Lebrand, Department of Fundamental Neurosciences, University of Lausanne, Rue du Bugnon 9, 1005 Lausanne, Switzerland. Telephone: Fax: cecile.lebrand@unil.ch.
2
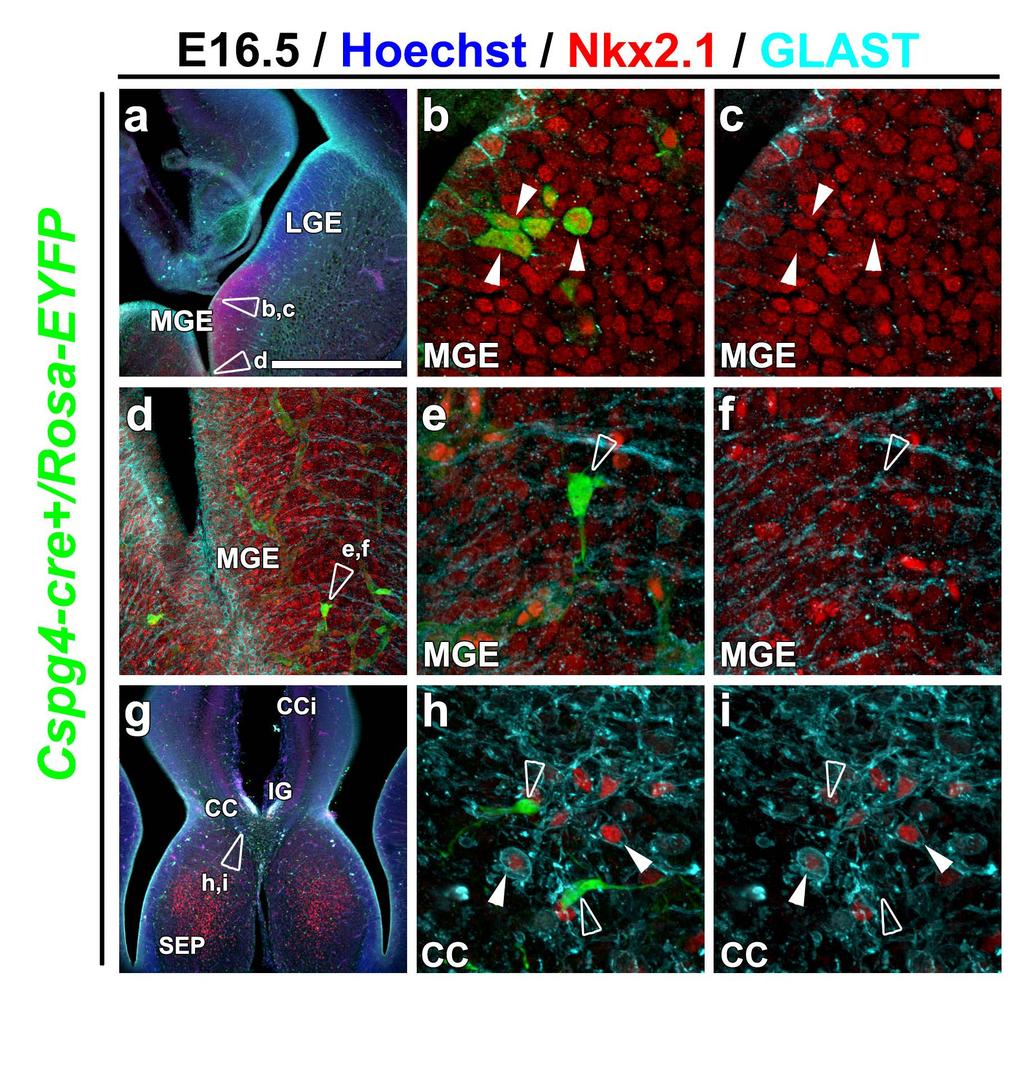
3 1 2 Supplementary Figure S1. Fate-mapping study of Nkx2.1-regulated NG2 + glia using the Cspg4-Cre + /Rosa-EYFP reporter mice (a-i) Triple immunohistochemistry for the EYFP, Nkx2.1 and GLAST on coronal sections from Cspg4-Cre + /Rosa-EYFP mice (n=3) at E16.5. Cell nuclei were counterstained in blue with Hoechst (a and g). b, c, e, f, h and i are higher power views of the regions shown in a, d and g, respectively. At E16.5, NG2 + (or Cspg4 + ) glia visualized by the EYFP signal were found to originate from Nkx2.1 + subpallial sites such as the MGE (a-c and d-f). The colocalization between Nkx2.1 (in red) and the EYFP signal (in green) is observed in few cells in the SVZ of the MGE (solid arrowheads in b and c) but as soon as the NG2 + cells start to differentiate and migrate, Nkx2.1 is down-regulated and is no anymore more visible (open arrowheads in e-f and h-i). By contrast, Nkx2.1 is still expressed in GLAST + astroglial cells within the CC midline (solid arrowheads in h-i) (CC) corpus callosum; (CCi) cingulate cortex; (CI) cingulate bundle; (IG) induseum griseum; (MGE) medial ganglionic eminence; (SEP) septum. 16 Bar = 675 µm in a and g; 160 µm in d, 40 µm in b, c, e, f, h and i. 2
4
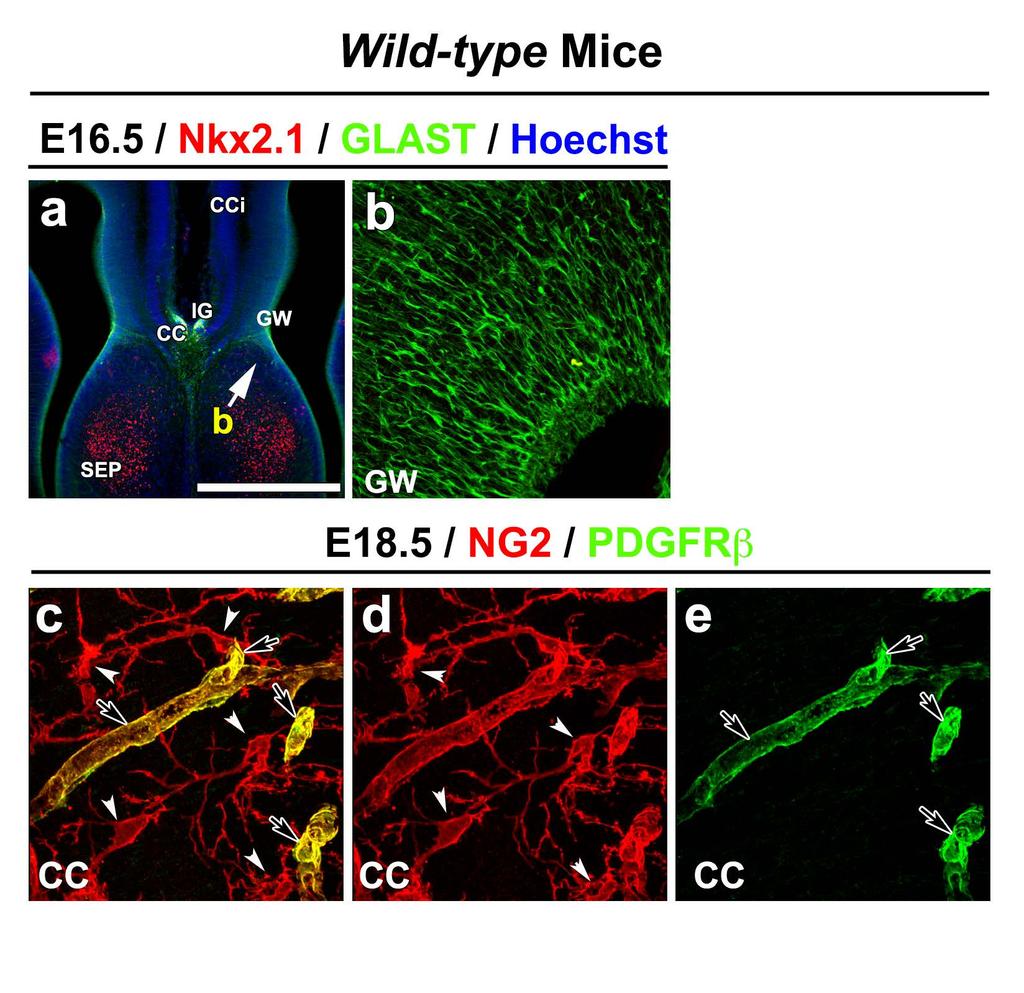
5 Supplementary Figure S2. Radial glial cells within glial wedge region are Nkx2.1-negative and NG2 immunostaining can be used to clearly identify the NG2 glia (a-b) Double immunostaining for Nkx2.1 and GLAST on coronal sections from WT mice (n=3) at E16.5. Cell nuclei were counterstained in blue with Hoechst (a). b is higher power view of the regions shown in a. The GLAST + radial glial cells within glial wedge (GW) do not express Nkx (c-e) Double immunostaining for NG2 and PDGFRβ on coronal sections from WT mice (n=3) at E18.5. Though PDGFRβ + pericytes adjacent to the vessels are NG2 + (arrows), they can be clearly differentiated from NG2 glia (white arrowhead) due to substantial difference in morphology (CC) corpus callosum; (CCi) cingulate cortex; (GW) glial wedge; (IG) induseum griseum; (SEP) septum. 30 Bar = 675 µm in a and 40 µm in b, c-e. 3
6
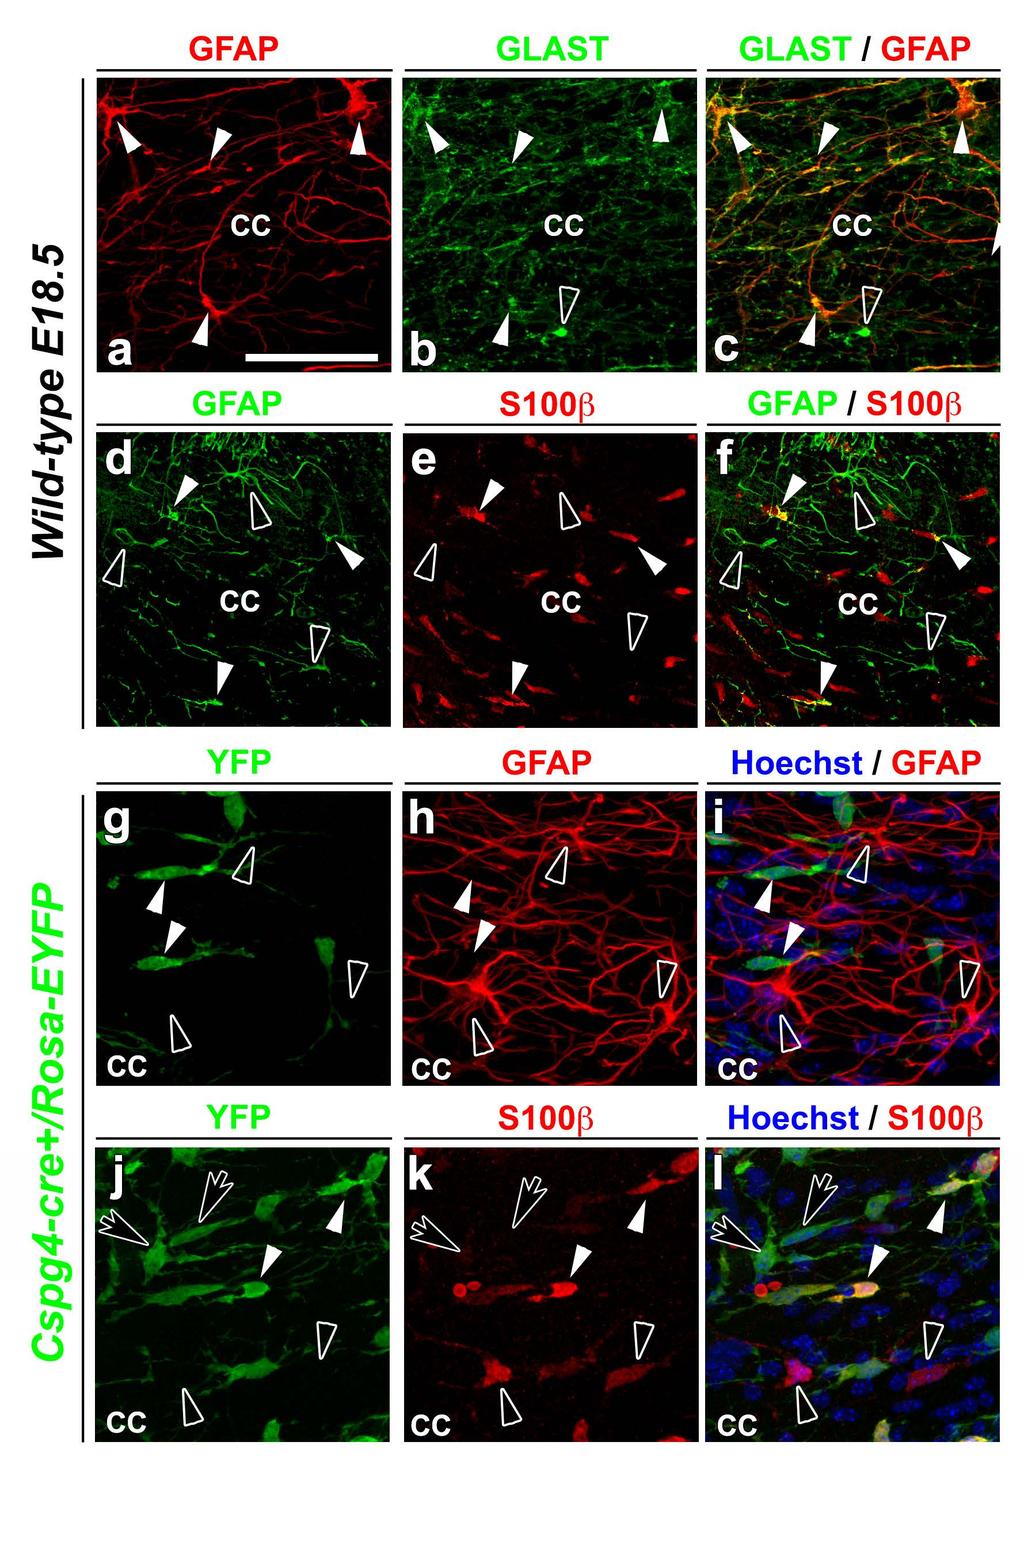
7 31 32 Supplementary Figure S3. Characterization of glial subtypes in mouse embryonic brain (a-f) Double immunostaining for GFAP and GLAST (a-c) (n=3) and GFAP and S100β (d-f) (n=3) on coronal sections from WT mice (n=3) at E18.5. (a-c) The GFAP + glia co-express GLAST (closed arrowheads) whereas some glia are positive 36 for GLAST alone (open arrowhead). (d-f) Some GFAP + glia co-express S100β (closed arrowheads) while several others do not express S100β (open arrowheads). Also, several S100β + cells do not express GFAP (g-l) Double immunostaining for YFP and GFAP (g-i) (n=3) and YFP and S100β (jl) (n=3) on coronal sections of Cspg4-cre + /Rosa-EYFP mice (n=3) at E18.5. (g-i) The NG2-derived glia, depicted by YFP staining (white arrowheads), do not express GFAP. The GFAP + glia (open arrowheads) and NG2 + glia (closed arrowheads) are two distinct mutually exclusive populations. (j-l) Some NG2-derived glia co-express S100β (closed arrowheads) while several others do not express S100β (open arrows) Also, several S100β + arrowheads). cells are not part of the NG2-derived population (open 47 (CC) corpus callosum. 48 Bar = 40 µm. 49 4
8
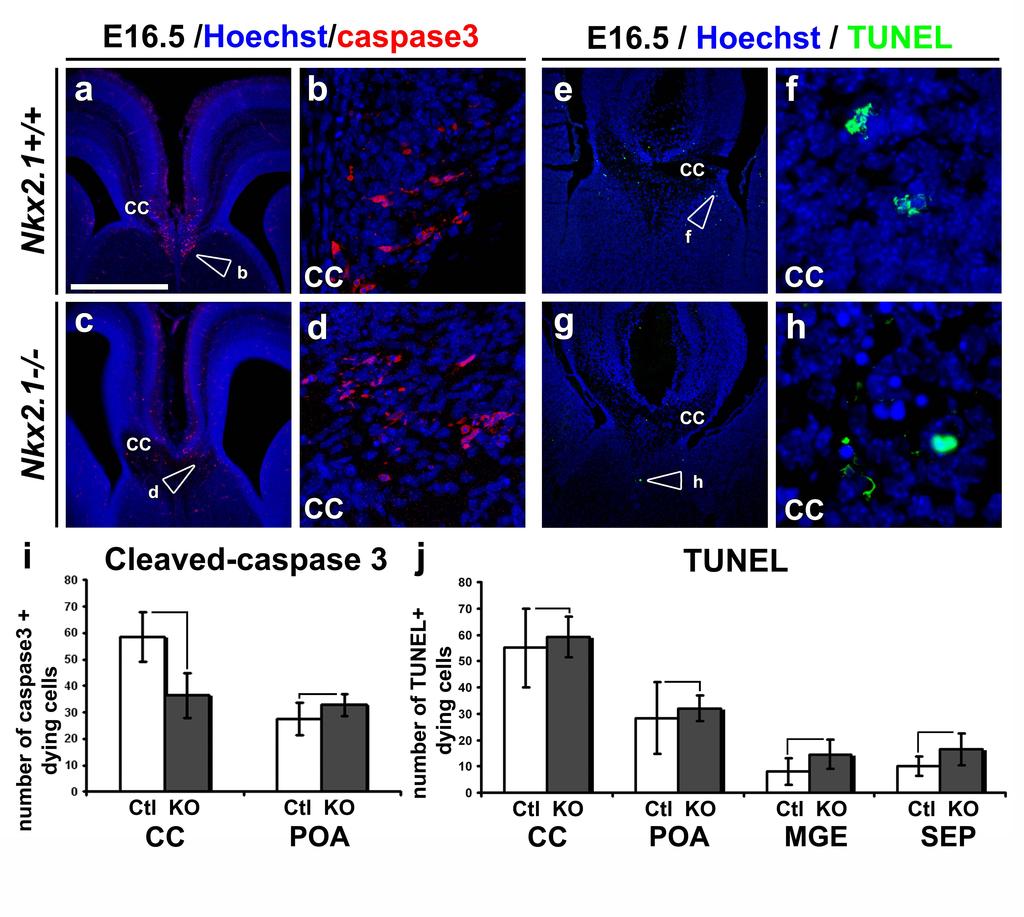
9 50 51 Supplementary Figure S4. Nkx2.1 -/- mice brains do not show any increase in cell death at E (a-d) Single immunohistochemical staining for the cleaved-caspase 3 (n=4 for CC region and n= 5 for POA region in Nkx2.1 +/+ or Nkx2.1 +/- controls (Ctl); n=6 for CC region and n=10 for POA region in Nkx2.1 -/- mice) and (e-h) TUNEL staining (n=16 for CC in Ctl mice, n=22 for CC in Nkx2.1 -/- mice; n=6 for POA in Ctl mice, n=5 for POA in Nkx2.1 -/- mice; n=10 for MGE in Ctl mice, n= 11 for MGE in Nkx2.1 -/- mice; n=7 for SEP in Ctl mice, n=14 for SEP in Nkx2.1 -/- mice) on CC coronal sections from Ctl (a-b and e-f) and Nkx2.1 -/- mice (c-d and g-h) at E16.5. Cell nuclei were counterstained in blue with Hoechst. b, d, f and h are higher magnified views of the CC region seen in a, c, e and g, respectively. (i and j) Bars (mean ± SEM from a 61 sample of n=4-16 sections in the Ctl and n=5-22 sections in Nkx2.1 -/- mice depending on the region studied) represent the number of dying cells labelled by the cleaved-caspase 3 or by the TUNEL staining and displaying pyknotic nuclei per section (surface area/section= mm 2 ), in the CC, POA, MGE and SEP of 65 Nkx2.1 -/- (KO) compared to Nkx2.1 +/+ or Nkx2.1 +/- controls (Ctl). No significant differences were observed in the number of dying cells in Nkx2.1 -/- mice brains compared to the Ctl. p-value= for CC and for POA with cleaved caspase 3 staining. p-value= for CC, for POA, for MGE, and for SEP with TUNEL staining (CC) corpus callosum; (MGE) medial ganglionic eminence; (POA) preoptic area; (SEP) septum. 72 Bar = 675 µm in a, c, e and g; 60 µm in b and d; 40 µm in f and h. 73 5
10 A. ataaaagcagcccacggggctgcccttgccatatgcctcactggcggcag agaacaaggctctattcagcgagtaccctggagtagacaccagaagccca agcatgggcagaggaaggcaggggttggggggagcagagctgtctgtgtt ccagaagcccaaggacacagatggctaaggcgcctgggagagggacctga gtggaagagatagatgggcctgaagtctcaagcagcaacagcctcctccc cgccattggtgagggtggggtttggtttcccggacctacatatccctcag aggcctggtgtgtaggaatttaaagggggtaaatctcctgagagaatgag gggtacccaggaagacggggtgttacagaaagaaagactccagcatgcac agccaactcattcaaaactactctgtcaggggctgccaggggccaggctc ggggtggggggtggggggcaacgagaagctggatcagggagaaatggccc actaggctggataagaggccacagaggggctcaggaatgaagcctgctgt cttaccctattaggatctgcgtgcataccttctgccgtgcactctaaaca cacagccagaggctcaagttgaccctggagtcacagagagggctccaacc ttagccctccactcctgaactccaggaatgagaagatagagttggagaga ttcaggggagaggactctgttgagaatgggggtcacaggaaactgtaata taggttgatcccggaggaagggaataggttcttcaagttcctagcatctc acaggcccccagagaaggacagagttggggtggtcctggcttacaggctc taagaactggaagctgattaccccaccgagctgtgcactctctgtctctg tctctgtgtgtgcgctcgtgcacacttatcacacaaatgttcatgtgtgt gcacatacatgtgttgagaccagaggtcaacctcaggcactgttgccttg gttttctgagagagcatttctctctggatctggaactcgccaattagtga gagccaggaagtctgctgattttcactgcccagcactggagtttacaagt atgcactgtcaacccaggccttttgtattcattctgcagctagaacttgg gtgggtcttcatgcttgacaggcaagcaatttatggactaagctgttccc tcggccctctcttgacccatttaccagaaagggggttccttgatcaatgg cgaagccaggctggtgttcccaagaaagccttgactctgggtacagtgac ctcagtggggtgagaggagttctccccctagctgggctggggcccagctc caccccctcaggctattcaatgggggtgcttccaggaagtcaggggcaga tttagtccaacccgttcctccataaaggccctgacatcccaggagccagc ATGGAGCGGAGACGCA
11 B. gtctgtaagctgaagacctggcagtgctgagctggtcagcccccaggacctccttttgtgcccacgagtgaatca ccttggcatagacataatggtcaggggtgggcacgcagcctgcttcccgctgtgctccaggcctccttcgatgct ttccgagaagtctattgagctgggagcttgtactgcacccggggctgacatcctggcatcctgggataaaagcag cccacggggctgcccttgccatatgcctcactggcggcagagaacaaggctctattcagcgagtaccctggagta gacaccagaagcccaagcatgggcagaggaaggcaggggttggggggagcagagctgtctgtgttccagaagccc aaggacacagatggctaaggcgcctgggagagggacctgagtggaagagatagatgggcctgaagtctcaagcag caacagcctcctccccgccattggtgagggtggggtttggtttcccggacctacatatccctcagaggcctggtg tgtaggaatttaaagggggtaaatctcctgagagaatgaggggtacccaggaagacggggtgttacagaaagaaa gactccagcatgcacagccaactcattcaaaactactctgtcaggggctgccaggggccaggctcggggtggggg gtggggggcaacgagaagctggatcagggagaaatggcccactaggctggataagaggccacagaggggctcagg aatgaagcctgctgtcttaccctattaggatctgcgtgcataccttctgccgtgcactctaaacacacagccaga ggctcaagttgaccctggagtcacagagagggctccaaccttagccctccactcctgaactccaggaatgagaag atagagttggagagattcaggggagaggactctgttgagaatgggggtcacaggaaactgtaatataggttgatc ccggaggaagggaataggttcttcaagttcctagcatctcacaggcccccagagaaggacagagttggggtggtc ctggcttacaggctctaagaactggaagctgattaccccaccgagctgtgcactctctgtctctgtctctgtgtg tgcgctcgtgcacacttatcacacaaatgttcatgtgtgtgcacatacatgtgttgagaccagaggtcaacctca ggcactgttgccttggttttctgagagagcatttctctctggatctggaactcgccaattagtgagagccaggaa gtctgctgattttcactgcccagcactggagtttacaagtatgcactgtcaacccaggccttttgtattcattct gcagctagaacttgggtgggtcttcatgcttgacaggcaagcaatttatggactaagctgttccctcggccctct cttgacccatttaccagaaagggggttccttgatcaatggcgaagccaggctggtgttcccaagaaagccttgac tctgggtacagtgacctcagtggggtgagaggagttctccccctagctgggctggggcccagctccaccccctca ggctattcaatgggggtgcttccaggaagtcaggggcagatttagtccaacccgttcctccataaaggccctgac atcccaggagccagcagaggcagggcacc
12 74 75 Supplementary Figure S5. The scheme of GFAP promoter with putative Nkx2.1 binding site and primers used for ChIP assay A. GFAP promoter sequence is shown with putative Nkx2.1 binding site in bold red font at position 838 bp relative to the putative transcriptional start site (shown in uppercase). The forward and reverse primers 5 - tggataagaggccacagagg and 5 - cctctcccctgaatctctcc that were used for ChIP assay are underlined B. GFAP promoter sequence from the pdrive-mgfap-lacz plasmid used for transfection experiments shown in Figure 9d-i. The putative Nkx2.1 binding site is shown in bold red font. 6
label the basement membrane). Different fixation methods of EB-perfused P8 mice to optimize the combination
. Different fixation methods of EB-perfused P8 mice to optimize the combination") Supplementary Figure 1 Optimization of the tissue fixation protocol to combine EB perfusion and IB4 endothelial tip cell staining in the postnatal mouse brain. a-l Labeling of EB-perfused P8 mice with
Supplementary Figure 1 Optimization of the tissue fixation protocol to combine EB perfusion and IB4 endothelial tip cell staining in the postnatal mouse brain. a-l Labeling of EB-perfused P8 mice with
Neocortex Zbtb20 / NFIA / Sox9
 Neocortex / NFIA / Sox9 Supplementary Figure 1. Expression of, NFIA, and Sox9 in the mouse neocortex at. The lower panels are higher magnification views of the oxed area. Arrowheads indicate triple-positive
marker. DAPI labels nuclei. Flies were 20 days old. Scale bar is 5 µm. Ctrl is
 Supplementary Figure 1. (a) Nos is detected in glial cells in both control and GFAP R79H transgenic flies (arrows), but not in deletion mutant Nos Δ15 animals. Repo is a glial cell marker. DAPI labels
Supplementary Table 1. List of primers used in this study
 Supplementary Table 1. List of primers used in this study Gene Forward primer Reverse primer Rat Met 5 -aggtcgcttcatgcaggt-3 5 -tccggagacacaggatgg-3 Rat Runx1 5 -cctccttgaaccactccact-3 5 -ctggatctgcctggcatc-3
Primary Mouse Cerebral Cortex Neurons V: 80% TE: 70%
 Primary Mouse Cerebral Cortex Neurons V: 80% TE: 70% Pictures: 9 days after electroporation Red: MAP2 Blue: GFAP Green: GFP The cells were from Embryonic Day 14 Mouse Cerebral Cortex Primary Mouse Hippocampal
Nature Neuroscience: doi: /nn Supplementary Figure 1. MADM labeling of thalamic clones.
 Supplementary Figure 1 MADM labeling of thalamic clones. (a) Confocal images of an E12 Nestin-CreERT2;Ai9-tdTomato brain treated with TM at E10 and stained for BLBP (green), a radial glial progenitor-specific
Supplementary Information
 Supplementary Information Title Degeneration and impaired regeneration of gray matter oligodendrocytes in amyotrophic lateral sclerosis Authors Shin H. Kang, Ying Li, Masahiro Fukaya, Ileana Lorenzini,
Transient neuronal populations are required to guide callosal axons: a role for semaphorin 3C.
 Transient neuronal populations are required to guide callosal axons: a role for semaphorin 3C. Mathieu Niquille, Sonia Garel, Fanny Mann, Jean-Pierre Hornung, Belkacem Otsmane, Sébastien Chevalley, Carlos
Supplementary Figure S1: Tanycytes are restricted to the central/posterior hypothalamus
 Supplementary Figure S1: Tanycytes are restricted to the central/posterior hypothalamus a: Expression of Vimentin, GFAP, Sox2 and Nestin in anterior, central and posterior hypothalamus. In the anterior
SUPPLEMENTARY FIG. S2. Representative counting fields used in quantification of the in vitro neural differentiation of pattern of dnscs.
 Supplementary Data SUPPLEMENTARY FIG. S1. Representative counting fields used in quantification of the in vitro neural differentiation of pattern of anpcs. A panel of lineage-specific markers were used
Prss56, a novel marker of adult neurogenesis in the mouse brain. - Supplemental Figures 1 to 5- Brain Structure and Function
 Prss56, a novel marker of adult neurogenesis in the mouse brain - Supplemental Figures 1 to 5- Brain Structure and Function Alexandre Jourdon 1,2, Aurélie Gresset 1, Nathalie Spassky 1, Patrick Charnay
Figure S1. (A) Schematic diagram of dnrar transgene allele. (B) X-Gal staining of testis from
 Schematic diagram of dnrar transgene allele. (B) X-Gal staining of testis from") Figure S1. (A) Schematic diagram of dnrar transgene allele. (B) X-Gal staining of testis from germ cell mutants (dnrar flox/flox, Stra8-Cre +, RARElacZ) (A ), controls (dnrar flox/flox, RARElacZ) (B ),
Figure S1. (A) Schematic diagram of dnrar transgene allele. (B) X-Gal staining of testis from germ cell mutants (dnrar flox/flox, Stra8-Cre +, RARElacZ) (A ), controls (dnrar flox/flox, RARElacZ) (B ),
Supplementary Figure 1. EC-specific Deletion of Snail1 Does Not Affect EC Apoptosis. (a,b) Cryo-sections of WT (a) and Snail1 LOF (b) embryos at
 Cryo-sections of WT (a) and Snail1 LOF (b) embryos at") Supplementary Figure 1. EC-specific Deletion of Snail1 Does Not Affect EC Apoptosis. (a,b) Cryo-sections of WT (a) and Snail1 LOF (b) embryos at E10.5 were double-stained for TUNEL (red) and PECAM-1 (green).
Supplementary Figure 1. EC-specific Deletion of Snail1 Does Not Affect EC Apoptosis. (a,b) Cryo-sections of WT (a) and Snail1 LOF (b) embryos at E10.5 were double-stained for TUNEL (red) and PECAM-1 (green).
Nature Neuroscience: doi: /nn.2275
 Supplementary Figure S1. The presence of MeCP2 in enriched primary glial cultures from rat or mouse brains is not neuronal. Western blot analysis of protein extracts from (a) rat glial and neuronal cultures.
Supplemental Information. Otic Mesenchyme Cells Regulate. Spiral Ganglion Axon Fasciculation. through a Pou3f4/EphA4 Signaling Pathway
 Neuron, Volume 73 Supplemental Information Otic Mesenchyme Cells Regulate Spiral Ganglion Axon Fasciculation through a Pou3f4/EphA4 Signaling Pathway Thomas M. Coate, Steven Raft, Xiumei Zhao, Aimee K.
GFP/Iba1/GFAP. Brain. Liver. Kidney. Lung. Hoechst/Iba1/TLR9!
 Supplementary information a +KA Relative expression d! Tlr9 5!! 5! NSC Neuron Astrocyte Microglia! 5! Tlr7!!!! NSC Neuron Astrocyte! GFP/Sβ/! Iba/Hoechst Microglia e Hoechst/Iba/TLR9! GFP/Iba/GFAP f Brain
SUPPLEMENTARY INFORMATION
 DOI: 10.1038/ncb2607 Figure S1 Elf5 loss promotes EMT in mammary epithelium while Elf5 overexpression inhibits TGFβ induced EMT. (a, c) Different confocal slices through the Z stack image. (b, d) 3D rendering
Supplementary Figure 1
 Supplementary Figure 1 Kif1a RNAi effect on basal progenitor differentiation Related to Figure 2. Representative confocal images of the VZ and SVZ of rat cortices transfected at E16 with scrambled or Kif1a
a) Primary cultures derived from the pancreas of an 11-week-old Pdx1-Cre; K-MADM-p53
 Primary cultures derived from the pancreas of an 11-week-old Pdx1-Cre; K-MADM-p53") 1 2 3 4 5 6 7 8 9 10 Supplementary Figure 1. Induction of p53 LOH by MADM. a) Primary cultures derived from the pancreas of an 11-week-old Pdx1-Cre; K-MADM-p53 mouse revealed increased p53 KO/KO (green,
1 2 3 4 5 6 7 8 9 10 Supplementary Figure 1. Induction of p53 LOH by MADM. a) Primary cultures derived from the pancreas of an 11-week-old Pdx1-Cre; K-MADM-p53 mouse revealed increased p53 KO/KO (green,
Cell Migration II: CNS Cell Migration. Steven McLoon Department of Neuroscience University of Minnesota
 Cell Migration II: CNS Cell Migration Steven McLoon Department of Neuroscience University of Minnesota 1 Course News Coffee Hour Wednesday (Oct 18) 9:00-10:00am Surdyk s Café in Northrop Auditorium Stop
Supplementary Figure 1. Chimeric analysis of inner ears. (A-H) Chimeric inner ears with fluorescent ES cells and (I,J) Rainbow inner ears.
 Chimeric inner ears with fluorescent ES cells and (I,J) Rainbow inner ears.") Supplementary Figure 1. himeric analysis of inner ears. (A-H) himeric inner ears with fluorescent ES cells and (I,J) Rainbow inner ears. (A,B) omposite images showing three colors in different vestibular
Supplementary Figure 1. himeric analysis of inner ears. (A-H) himeric inner ears with fluorescent ES cells and (I,J) Rainbow inner ears. (A,B) omposite images showing three colors in different vestibular
Supplementary Figure 1. Nature Neuroscience: doi: /nn.4547
 Supplementary Figure 1 Characterization of the Microfetti mouse model. (a) Gating strategy for 8-color flow analysis of peripheral Ly-6C + monocytes from Microfetti mice 5-7 days after TAM treatment. Living
Nature Protocols: doi: /nprot Supplementary Figure 1. Effect of different enzymes on CD13 and CD31 populations.
 Supplementary Figure 1 Effect of different enzymes on CD13 and CD31 populations. Comparison of cortex dissociated for 30 minutes with collagenase/dispase digestion (a) or papain (b). Papain degrades the
Supplemental Figure 1. Intracranial transduction of a modified ptomo lentiviral vector in the mouse
 Supplemental figure legends Supplemental Figure 1. Intracranial transduction of a modified ptomo lentiviral vector in the mouse hippocampus targets GFAP-positive but not NeuN-positive cells. (A) Stereotaxic
Ophthalmology, Radiation Oncology,
 Supporting Online Material Journal: Nature Neuroscience Article Title: Corresponding Author: All Authors: Affiliations: Tanycytes of the Hypothalamic Median Eminence Form a Diet- Responsive Neurogenic
Supplementary Materials for
 www.advances.sciencemag.org/cgi/content/full/1/3/e1400244/dc1 Supplementary Materials for PlGF-induced VEGFR1-dependent vascular remodeling determines opposing antitumor effects and drug resistance to
Cell Migration II: CNS Cell Migration. Steven McLoon Department of Neuroscience University of Minnesota
 Cell Migration II: CNS Cell Migration Steven McLoon Department of Neuroscience University of Minnesota 1 Hey! The major concepts discussed relative to neural crest cell migration apply to cell migration
Supplementary Figure S1: Pial and periventricular vascular networks and the dual GABA neuron streams of the early embryonic mouse telencephalon
 Supplementary Figure S1: Pial and periventricular vascular networks and the dual GABA neuron streams of the early embryonic mouse telencephalon a) The profile of GABA neurons arriving at the pallial-subpallial
Supplementary Figure 1
 Combination index (CI) Supplementary Figure 1 2. 1.5 1. Ishikawa AN3CA Nou-1 Hec-18.5...2.4.6.8 1. Fraction affected (Fa) Supplementary Figure 1. The synergistic effect of PARP inhibitor and PI3K inhibitor
SOPten flox/flox (KO) Pten flox/flox (WT) flox allele 6.0 kb. Pten. Actin. ! allele 2.3 kb. Supplementary Figure S1. Yanagi, et al.
 Pten flox/flox (WT) flox allele 6.0 kb. Pten. Actin. ! allele 2.3 kb. Supplementary Figure S1. Yanagi, et al.") s1 A Pten flox/flox () SOPten flox/flox () flox allele 6. kb B Pten flox/flox () SOPten flox/flox () Pten Actin! allele 2.3 kb Supplementary Figure S1. Yanagi, et al. A B BrdU BrdU positive cells ( ) 3
s1 A Pten flox/flox () SOPten flox/flox () flox allele 6. kb B Pten flox/flox () SOPten flox/flox () Pten Actin! allele 2.3 kb Supplementary Figure S1. Yanagi, et al. A B BrdU BrdU positive cells ( ) 3
Genesis of cerebellar interneurons and the prevention of neural DNA damage require XRCC1.
 Genesis of cerebellar interneurons and the prevention of neural DNA damage require XRCC1. Youngsoo Lee, Sachin Katyal, Yang Li, Sherif F. El-Khamisy, Helen R. Russell, Keith W. Caldecott and Peter J. McKinnon.
Supplementary Materials for
 www.sciencetranslationalmedicine.org/cgi/content/full/4/117/117ra8/dc1 Supplementary Materials for Notch4 Normalization Reduces Blood Vessel Size in Arteriovenous Malformations Patrick A. Murphy, Tyson
SOM Husse et al. Supplementary online material. Synaptotagmin10-Cre, a driver to disrupt clock genes in the SCN
 SOM Husse et al. Supplementary online material Synaptotagmin10-Cre, a driver to disrupt clock genes in the SCN Jana Husse, Xunlei Zhou, Anton Shostak, Henrik Oster and Gregor Eichele SOM Husse et al.,
ErbB4 migrazione II parte
 ErbB4 migrazione II parte Control SVZ cells prefer to migrate on the NRG1 type III substrate the substrate preference of the neuroblasts migrating out of the SVZ explant was evaluated SVZ cells had a strong
M2 microglia/ macrophages drive oligodendrocyte differentiation during CNS remyelination
 Supplemental Information Title: M2 microglia/ macrophages drive oligodendrocyte differentiation during CNS remyelination Authors: Veronique E. Miron, Amanda Boyd, Jing-Wei Zhao, Tracy J. Yuen, Julia M.
Supplementary Figure 1. Validation of astrocytes. Primary astrocytes were
 Supplementary Figure 1. Validation of astrocytes. Primary astrocytes were separated from the glial cultures using a mild trypsinization protocol. Anti-glial fibrillary acidic protein (GFAP) immunofluorescent
Lack of cadherins Celsr2 and Celsr3 impairs ependymal ciliogenesis, leading to fatal
 Lack of cadherins Celsr2 and Celsr3 impairs ependymal ciliogenesis, leading to fatal hydrocephalus Fadel TISSIR, Yibo QU, Mireille MONTCOUQUIOL, Libing ZHOU, Kouji KOMATSU, Dongbo SHI, Toshihiko FUJIMORI,
Supplemental Figure 1. (A) The localization of Cre DNA recombinase in the testis of Cyp19a1-Cre mice was detected by immunohistchemical analyses
 The localization of Cre DNA recombinase in the testis of Cyp19a1-Cre mice was detected by immunohistchemical analyses") Supplemental Figure 1. (A) The localization of Cre DNA recombinase in the testis of Cyp19a1-Cre mice was detected by immunohistchemical analyses using an anti-cre antibody; testes at 1 week (left panel),
Supplemental Figure 1. (A) The localization of Cre DNA recombinase in the testis of Cyp19a1-Cre mice was detected by immunohistchemical analyses using an anti-cre antibody; testes at 1 week (left panel),
Supplementary Figure S1 Enlarged coronary artery branches in Edn1-knockout mice. a-d, Coronary angiography by ink injection in wild-type (a, b) and
 and") Supplementary Figure S1 Enlarged coronary artery branches in Edn1-knockout mice. a-d, Coronary angiography by ink injection in wild-type (a, b) and Edn1-knockout (Edn1-KO) (c, d) hearts. The boxed areas
Supplementary Figure S1 Enlarged coronary artery branches in Edn1-knockout mice. a-d, Coronary angiography by ink injection in wild-type (a, b) and Edn1-knockout (Edn1-KO) (c, d) hearts. The boxed areas
mm Distance (mm)
") b a Magnet Illumination Coverslips MPs Objective 2575 µm 1875 µm 1575 µm 1075 µm 875 µm 545 µm 20µm 2 3 0.5 0.3mm 1 1000 100 10 1 0.1 1000 100 10 1 0.1 Field Induction (Gauss) 1.5 0 5 10 15 20 Distance
b a Magnet Illumination Coverslips MPs Objective 2575 µm 1875 µm 1575 µm 1075 µm 875 µm 545 µm 20µm 2 3 0.5 0.3mm 1 1000 100 10 1 0.1 1000 100 10 1 0.1 Field Induction (Gauss) 1.5 0 5 10 15 20 Distance
SUPPLEMENTARY INFORMATION
 doi:10.1038/nature10188 Supplementary Figure 1. Embryonic epicardial genes are down-regulated from midgestation stages and barely detectable post-natally. Real time qrt-pcr revealed a significant down-regulation
Supplemental Information. Tissue Myeloid Progenitors Differentiate. into Pericytes through TGF-b Signaling. in Developing Skin Vasculature
 Cell Reports, Volume 18 Supplemental Information Tissue Myeloid Progenitors Differentiate into Pericytes through TGF-b Signaling in Developing Skin Vasculature Tomoko Yamazaki, Ani Nalbandian, Yutaka Uchida,
SUPPLEMENTARY INFORMATION
 SUPPLEMENTARY INFORMATION Supplementary Figure 1. The expression of ephrin-b2 H2BGFP persists in the post-hearingonset organ of Corti and is specifically restricted to supporting cells. Sox2 immunolabeling
Supplemental Figure 1: Leydig cells are reduced at multiple stages in both male sterile mutants
 SUPPLEMENTAL FIGURE LEGENDS: Supplemental Figure 1: Leydig cells are reduced at multiple stages in both male sterile mutants (Sgpl1 -/- and Plekha1 -/- ). Using an antibody against CYP11a1 to label Leydig
SUPPLEMENTARY FIGURE LEGENDS. atypical adenomatous hyperplasias (AAH); Grade II: adenomas; Grade III: adenocarcinomas;
; Grade II: adenomas; Grade III: adenocarcinomas;") SUPPLEMENTARY FIGURE LEGENDS Supplementary Figure S1: Tumor grades in Ras G12D ; p53 / lung tumors. Representative histology (H&E) of K-Ras G12D ; p53 / lung tumors 13 weeks after tumor initiation. Grade
SUPPLEMENTARY FIGURE LEGENDS Supplementary Figure S1: Tumor grades in Ras G12D ; p53 / lung tumors. Representative histology (H&E) of K-Ras G12D ; p53 / lung tumors 13 weeks after tumor initiation. Grade
Supplementary Fig. 1 Blocking shh function at the protein level confirms its role as a guidance cue for postcommissural axons.
 Supplementary Fig. 1 Blocking shh function at the protein level confirms its role as a guidance cue for postcommissural axons. As an alternative method to demonstrate the role of shh as a guidance cue
PHENOTYPIC DYNAMICS OF MICROGLIAL AND MONOCYTE-DERIVED CELLS IN GLIOBLASTOMA-BEARING MICE.
 SUPPLEMENTARY FIGURES, TABLES AND VIDEOS PHENOTYPIC DYNAMICS OF MICROGLIAL AND MONOCYTE-DERIVED CELLS IN GLIOBLASTOMA-BEARING MICE. Clément Ricard 1,2,3,4, Aurélie Tchoghandjian 2,4, Hervé Luche 5, Pierre
Doxorubicin up-regulates CXCR4 via mir200c/zeb1-dependent mechanism in human cardiac mesenchymal progenitor cells
 Cell Death and Disease Doxorubicin up-regulates CXCR4 via mir200c/zeb1-dependent mechanism in human cardiac mesenchymal progenitor cells Sara Beji 1 *, Giuseppina Milano 2,3 *, Alessandro Scopece 2, Lucia
Supplementary Figure 1
 Supplementary Figure 1 3 3 3 1 1 Bregma -1.6mm 3 : Bregma Ref) Http://www.mbl.org/atlas165/atlas165_start.html Bregma -.18mm Supplementary Figure 1 Schematic representation of the utilized brain slice
The neuron. Biocytin labeled pyramidal neuron recorded in piriform cortex
 The neuron Biocytin labeled pyramidal neuron recorded in piriform cortex Discovery of the neuron (A) Reticularist Doctrine (B) Neuron Doctrine Exception.GAP JUNCTIONS between neurons Neuronal shape Dendrites
mir-7a regulation of Pax6 in neural stem cells controls the spatial origin of forebrain dopaminergic neurons
 Supplemental Material mir-7a regulation of Pax6 in neural stem cells controls the spatial origin of forebrain dopaminergic neurons Antoine de Chevigny, Nathalie Coré, Philipp Follert, Marion Gaudin, Pascal
SUPPLEMENTARY INFORMATION
 SUPPLEMENTARY INFORMATION doi:10.1038/nature11306 Supplementary Figures Supplementary Figure 1. Basic characterization of GFP+ RGLs in the dentate gyrus of adult nestin-gfp mice. a, Sample confocal images
SUPPLEMENTARY INFORMATION
 doi:10.1038/nature12652 Supplementary Figure 1. PRDM16 interacts with endogenous EHMT1 in brown adipocytes. Immunoprecipitation of PRDM16 complex by flag antibody (M2) followed by Western blot analysis
Supplemental Information. Metabolic Maturation during Muscle Stem Cell. Differentiation Is Achieved by mir-1/133a-mediated
 Cell Metabolism, Volume 27 Supplemental Information Metabolic Maturation during Muscle Stem Cell Differentiation Is Achieved by mir-1/133a-mediated Inhibition of the Dlk1-Dio3 Mega Gene Cluster Stas Wüst,
Control of CNS Cell-Fate Decisions by SHP-2 and Its Dysregulation in Noonan Syndrome
 Article Control of CNS Cell-Fate Decisions by SHP-2 and Its Dysregulation in Noonan Syndrome Andrée S. Gauthier, 1,2,3 Olivia Furstoss, 1,2 Toshiyuki Araki, 5 Richard Chan, 5 Benjamin G. Neel, 5 David
ErbB4 migrazione I parte. 3- ErbB4- NRG1
 ErbB4 migrazione I parte 3- ErbB4- NRG1 1 In rodent brains postnatal neuronal migration is evident in three main areas: the cerebellum (CB), the hippocampus (Hipp) and the rostral migratory stream (RMS).
islets scored 1 week month months
 Supplementary Table 1. Sampling parameters for the morphometrical analyses Time (post- DT) Control mice (age-matched) α-cells mice pancreatic surface (mm 2 ) scored DT-treated mice islets scored mice pancreatic
Zhu et al, page 1. Supplementary Figures
 Zhu et al, page 1 Supplementary Figures Supplementary Figure 1: Visual behavior and avoidance behavioral response in EPM trials. (a) Measures of visual behavior that performed the light avoidance behavior
SUPPLEMENTARY INFORMATION
 Suppl. Fig. 1 in vivo expression of ISL1 in the human fetal heart. a, Hematoxylin eosin staining showing structures of left atrium and left atrium appendage (*) of a human fetal heart at 11 weeks of gestation.
In vivo reprogramming reactive glia into ipscs to produce new neurons in the
 In vivo reprogramming reactive glia into ipscs to produce new neurons in the cortex following traumatic brain injury Xiang Gao 1, Xiaoting Wang 1, Wenhui Xiong 1, Jinhui Chen 1, * 1 Spinal Cord and Brain
Structural basis for the role of inhibition in facilitating adult brain plasticity
 Structural basis for the role of inhibition in facilitating adult brain plasticity Jerry L. Chen, Walter C. Lin, Jae Won Cha, Peter T. So, Yoshiyuki Kubota & Elly Nedivi SUPPLEMENTARY FIGURES 1-6 a b M
Supplementary Figure 1. Spatial distribution of LRP5 and β-catenin in intact cardiomyocytes. (a) and (b) Immunofluorescence staining of endogenous
 and (b) Immunofluorescence staining of endogenous") Supplementary Figure 1. Spatial distribution of LRP5 and β-catenin in intact cardiomyocytes. (a) and (b) Immunofluorescence staining of endogenous LRP5 in intact adult mouse ventricular myocytes (AMVMs)
Supplementary Figure 1. Spatial distribution of LRP5 and β-catenin in intact cardiomyocytes. (a) and (b) Immunofluorescence staining of endogenous LRP5 in intact adult mouse ventricular myocytes (AMVMs)
Supplementary Information and Figure legends
 Supplementary Information and Figure legends Table S1. Primers for quantitative RT-PCR Target Sequence (5 -> 3 ) Target Sequence (5 -> 3 ) DAB2IP F:TGGACGATGTGCTCTATGCC R:GGATGGTGATGGTTTGGTAG Snail F:CCTCCCTGTCAGATGAGGAC
Supplementary Materials. for Garmy-Susini, et al, Integrin 4 1 signaling is required for lymphangiogenesis and tumor metastasis
 Supplementary Materials for Garmy-Susini, et al, Integrin 4 1 signaling is required for lymphangiogenesis and tumor metastasis 1 Supplementary Figure Legends Supplementary Figure 1: Integrin expression
SUPPLEMENTARY FIGURES AND TABLE
 SUPPLEMENTARY FIGURES AND TABLE Supplementary Figure S1: Characterization of IRE1α mutants. A. U87-LUC cells were transduced with the lentiviral vector containing the GFP sequence (U87-LUC Tet-ON GFP).
Supplementary Table 1. The primers used for quantitative RT-PCR. Gene name Forward (5 > 3 ) Reverse (5 > 3 )
 Reverse (5 > 3 )") 770 771 Supplementary Table 1. The primers used for quantitative RT-PCR. Gene name Forward (5 > 3 ) Reverse (5 > 3 ) Human CXCL1 GCGCCCAAACCGAAGTCATA ATGGGGGATGCAGGATTGAG PF4 CCCCACTGCCCAACTGATAG TTCTTGTACAGCGGGGCTTG
770 771 Supplementary Table 1. The primers used for quantitative RT-PCR. Gene name Forward (5 > 3 ) Reverse (5 > 3 ) Human CXCL1 GCGCCCAAACCGAAGTCATA ATGGGGGATGCAGGATTGAG PF4 CCCCACTGCCCAACTGATAG TTCTTGTACAGCGGGGCTTG
Nature Neuroscience: doi: /nn Supplementary Figure 1. Distribution of starter cells for RV-mediated retrograde tracing.
 Supplementary Figure 1 Distribution of starter cells for RV-mediated retrograde tracing. Parcellation of cortical areas is based on Allen Mouse Brain Atlas and drawn to scale. Thick white curves, outlines
Supplementary Figure 1: Expression of Gli1-lacZ in E17.5 ovary and mesonephros. a,
 Supplementary Figure 1: Expression of Gli1-lacZ in E17.5 ovary and mesonephros. a, Transverse sections of E17.5 ovary and mesonephros from Gli1-LacZ reporter embryos (n=3) after LacZ staining (blue). The
Nature Neuroscience: doi: /nn Supplementary Figure 1. Visualization of AT1a-positive cells using AT1a lacz/+ mouse.
 Supplementary Figure 1 Visualization of AT1a-positive cells using AT1a lacz/+ mouse. (a f) Immunohistochemical detection of β-gal in the mouse brain. Coronal sections at the respective anteroposterior
Supplementary Figure S1. Monolayer differentiation of mouse ESCs into telencephalic neural precursors. (a) Schematic representation of the protocols
 Schematic representation of the protocols") Supplementary Figure S1. Monolayer differentiation of mouse ESCs into telencephalic neural precursors. (a) Schematic representation of the protocols used to differentiate mouse ESCs. (b) Representative
Supplementary Figure S1. Monolayer differentiation of mouse ESCs into telencephalic neural precursors. (a) Schematic representation of the protocols used to differentiate mouse ESCs. (b) Representative
Breeding scheme, transgenes, histological analysis and site distribution of SB-mutagenized osteosarcoma.
 Supplementary Figure 1 Breeding scheme, transgenes, histological analysis and site distribution of SB-mutagenized osteosarcoma. (a) Breeding scheme. R26-LSL-SB11 homozygous mice were bred to Trp53 LSL-R270H/+
Supplemental Information. Menin Deficiency Leads to Depressive-like. Behaviors in Mice by Modulating. Astrocyte-Mediated Neuroinflammation
 Neuron, Volume 100 Supplemental Information Menin Deficiency Leads to Depressive-like Behaviors in Mice by Modulating Astrocyte-Mediated Neuroinflammation Lige Leng, Kai Zhuang, Zeyue Liu, Changquan Huang,
Name Animal source Vendor Cat # Dilutions
 Supplementary data Table S1. Primary and Secondary antibody sources Devi et al, TXNIP in mitophagy A. Primary Antibodies Name Animal source Vendor Cat # Dilutions 1. TXNIP mouse MBL KO205-2 1:2000 (WB)
Supplementary Materials
 Supplementary Materials Fig. S1. Weights of full-dose treatment groups comparing 1 st, 2 nd, and 3 rd generation gene replacement therapy. Mice were treated at p1 with 4x10 11 GC of the three different
Supplementary Information
 Supplementary Information Astrocytes regulate adult hippocampal neurogenesis through ephrin-b signaling Randolph S. Ashton, Anthony Conway, Chinmay Pangarkar, Jamie Bergen, Kwang-Il Lim, Priya Shah, Mina
Supplementary Fig. S1. Schematic diagram of minigenome segments.
 open reading frame 1565 (segment 5) 47 (-) 3 5 (+) 76 101 125 149 173 197 221 246 287 open reading frame 890 (segment 8) 60 (-) 3 5 (+) 172 Supplementary Fig. S1. Schematic diagram of minigenome segments.
Transcription factor Foxp3 and its protein partners form a complex regulatory network
 Supplementary figures Resource Paper Transcription factor Foxp3 and its protein partners form a complex regulatory network Dipayan Rudra 1, Paul deroos 1, Ashutosh Chaudhry 1, Rachel Niec 1, Aaron Arvey
Supplementary Figure 1
 Supplementary Figure 1 Genetic labeling of microglia Male and female 2-3 month-old CreERT2;R26-tdTomato mice or CreERT2;R26-tdTomato;Iba1-eGFP transgenic mice were treated with 1x, 2x (48 h apart), or
NG2 + CNS Glial Progenitors Remain Committed to the Oligodendrocyte Lineage in Postnatal Life and following Neurodegeneration
 Article NG2 + CNS Glial Progenitors Remain Committed to the Oligodendrocyte Lineage in Postnatal Life and following Neurodegeneration Shin H. Kang, 1 Masahiro Fukaya, 2,4 Jason K. Yang, 1 Jeffrey D. Rothstein,
Supplementary Materials for
 www.sciencesignaling.org/cgi/content/full/8/375/ra41/dc1 Supplementary Materials for Actin cytoskeletal remodeling with protrusion formation is essential for heart regeneration in Hippo-deficient mice
Ghrelin Facilitates GLUT2-, SGLT1- and SGLT2-mediated Intestinal. Glucose Transport in Goldfish (Carassius auratus)
") Ghrelin Facilitates GLUT2-, SGLT1- and SGLT2-mediated Intestinal Glucose Transport in Goldfish (Carassius auratus) Ayelén Melisa Blanco 1,2, Juan Ignacio Bertucci 2,3, Naresh Ramesh 2, María Jesús Delgado
Ghrelin Facilitates GLUT2-, SGLT1- and SGLT2-mediated Intestinal Glucose Transport in Goldfish (Carassius auratus) Ayelén Melisa Blanco 1,2, Juan Ignacio Bertucci 2,3, Naresh Ramesh 2, María Jesús Delgado
Supplementary Materials for. c-abl Activation Plays a Role in α-synucleinopathy Induced Neurodegeneration
 Supplementary Materials for c-abl Activation Plays a Role in α-synucleinopathy Induced Neurodegeneration Saurav Brahmachari, Preston Ge, Su Hyun Lee, Donghoon Kim, Senthilkumar S. Karuppagounder, Manoj
Supplemental Figure 1. Western blot analysis indicated that MIF was detected in the fractions of
 Supplemental Figure Legends Supplemental Figure 1. Western blot analysis indicated that was detected in the fractions of plasma membrane and cytosol but not in nuclear fraction isolated from Pkd1 null
The Zinc Finger Transcription Factor Sp8 Regulates the Generation and Diversity of Olfactory Bulb Interneurons
 Neuron 49, 503 516, February 16, 2006 ª2006 Elsevier Inc. DOI 10.1016/j.neuron.2006.01.018 The Zinc Finger Transcription Factor Sp8 Regulates the Generation and Diversity of Olfactory Bulb Interneurons
Supplementary Information
 Supplementary Information Figure S1: Follicular melanocytes in the wound peripheral area migrate to the epidermis in response to wounding stimuli. Dorsal skin of Trp2-LacZ mice stained with X-gal and analyzed
Supplementary Figures
 Supplementary Figures Supplementary Figure 1. nrg1 bns101/bns101 embryos develop a functional heart and survive to adulthood (a-b) Cartoon of Talen-induced nrg1 mutation with a 14-base-pair deletion in
Supplementary Figure 1. Properties of various IZUMO1 monoclonal antibodies and behavior of SPACA6. (a) (b) (c) (d) (e) (f) (g) .
 (b) (c) (d) (e) (f) (g) .") Supplementary Figure 1. Properties of various IZUMO1 monoclonal antibodies and behavior of SPACA6. (a) The inhibitory effects of new antibodies (Mab17 and Mab18). They were investigated in in vitro fertilization
Supplementary Figure 1. Properties of various IZUMO1 monoclonal antibodies and behavior of SPACA6. (a) The inhibitory effects of new antibodies (Mab17 and Mab18). They were investigated in in vitro fertilization
Conserved properties of dentate gyrus neurogenesis across postnatal development revealed by single-cell RNA sequencing
 SUPPLEMENTARY INFORMATION Resource https://doi.org/10.1038/s41593-017-0056-2 In the format provided by the authors and unedited. Conserved properties of dentate gyrus neurogenesis across postnatal development
Nature Neuroscience: doi: /nn Supplementary Figure 1. Large-scale calcium imaging in vivo.
 Supplementary Figure 1 Large-scale calcium imaging in vivo. (a) Schematic illustration of the in vivo camera imaging set-up for large-scale calcium imaging. (b) High-magnification two-photon image from
SHREE ET AL, SUPPLEMENTAL MATERIALS. (A) Workflow for tumor cell line derivation and orthotopic implantation.
 Workflow for tumor cell line derivation and orthotopic implantation.") SHREE ET AL, SUPPLEMENTAL MATERIALS SUPPLEMENTAL FIGURE AND TABLE LEGENDS Supplemental Figure 1. Derivation and characterization of TS1-TGL and TS2-TGL PyMT cell lines and development of an orthotopic
SHREE ET AL, SUPPLEMENTAL MATERIALS SUPPLEMENTAL FIGURE AND TABLE LEGENDS Supplemental Figure 1. Derivation and characterization of TS1-TGL and TS2-TGL PyMT cell lines and development of an orthotopic
Supplementary Information
 Supplementary Information Lymphatic endothelial cells support tumor growth in breast cancer Esak Lee a, Niranjan B. Pandey a, and Aleksander S. Popel a,b a Department of Biomedical Engineering, Johns Hopkins
SUPPLEMENTARY FIGURES
 SUPPLEMENTARY FIGURES 1 Supplementary Figure 1, Adult hippocampal QNPs and TAPs uniformly express REST a-b) Confocal images of adult hippocampal mouse sections showing GFAP (green), Sox2 (red), and REST
Supplementary Figure 1 Expression of Crb3 in mouse sciatic nerve: biochemical analysis (a) Schematic of Crb3 isoforms, ERLI and CLPI, indicating the
 Schematic of Crb3 isoforms, ERLI and CLPI, indicating the") Supplementary Figure 1 Expression of Crb3 in mouse sciatic nerve: biochemical analysis (a) Schematic of Crb3 isoforms, ERLI and CLPI, indicating the location of the transmembrane (TM), FRM binding (FB)
Supplementary Figure 1 Expression of Crb3 in mouse sciatic nerve: biochemical analysis (a) Schematic of Crb3 isoforms, ERLI and CLPI, indicating the location of the transmembrane (TM), FRM binding (FB)
Supplementary Figure S I: Effects of D4F on body weight and serum lipids in apoe -/- mice.
 Supplementary Figures: Supplementary Figure S I: Effects of D4F on body weight and serum lipids in apoe -/- mice. Male apoe -/- mice were fed a high-fat diet for 8 weeks, and given PBS (model group) or
Phosphoinositides Regulate Ciliary Protein Trafficking to Modulate Hedgehog Signaling
 Developmental Cell Supplemental Information Phosphoinositides Regulate Ciliary Protein Trafficking to Modulate Hedgehog Signaling Francesc R. Garcia-Gonzalo, Siew Cheng Phua, Elle C. Roberson, Galo Garcia
During Brain Development Final Destinations for Neurons and Glia Get Separated from Germinal Niches
 During Brain Development Final Destinations for Neurons and Glia Get Separated from Germinal Niches Progenitors are Contained within Unique Domains and Tangentially Fixed. EMBRYO ADULT Migratory Behavior
TGF-β Signaling Regulates Neuronal C1q Expression and Developmental Synaptic Refinement
 Supplementary Information Title: TGF-β Signaling Regulates Neuronal C1q Expression and Developmental Synaptic Refinement Authors: Allison R. Bialas and Beth Stevens Supplemental Figure 1. In vitro characterization
Supplementary Materials for
 www.sciencesignaling.org/cgi/content/full/10/487/eaag2476/dc1 Supplementary Materials for Gene expression profiles of brain endothelial cells during embryonic development at bulk and single-cell levels
Supplementary Figure 1
 Supplementary Figure 1 AAV-GFP injection in the MEC of the mouse brain C57Bl/6 mice at 4 months of age were injected with AAV-GFP into the MEC and sacrificed at 7 days post injection (dpi). (a) Brains
Supplementary Figure 1
 Supplementary Figure 1 The average sigmoid parametric curves of capillary dilation time courses and average time to 50% peak capillary diameter dilation computed from individual capillary responses averaged