Tcf21 MCM ; R26 mtmg Sham GFP Col 1/3 TAC 8W TAC 2W. Postn MCM ; R26 mtmg Sham GFP Col 1/3 TAC 8W TAC 2W
|
|
|
- Jasmine Banks
- 6 years ago
- Views:
Transcription


 and")
 and Postn MCM ;R26 mtmg (B) hearts 2")

1 A Tcf21 MCM ; R26 mtmg Sham GFP Col 1/3 Tcf21 MCM ; R26 mtmg TAC 2W Tcf21 MCM ; R26 mtmg TAC 8W B Postn MCM ; R26 mtmg Sham GFP Col 1/3 Postn MCM ; R26 mtmg TAC 2W Postn MCM ; R26 mtmg TAC 8W Supplementary Figure 1. Co-localization of Tcf21 and Postn lineage CFs with Collagen 1/3 in mouse hearts subjected to TAC. Representative images of GFP (Green) and Collagen 1/3 (Red) co-staining in Tcf21 MCM ;R26 mtmg (A) and Postn MCM ;R26 mtmg (B) hearts 2 weeks (W) or 8W after sham or TAC surgeries are shown. GFP + cells are present in areas of Col1/3 deposition (arrows). Scale bar=50µm.

 Littermate control group: Tcf21 MCM ;Ctnnb1 fl/+ ;")

2 A Ctnnb1 (β-catenin) loxp Exon 2 Exon 3 Exon 4 Exon 5 Exon 6 loxp B Experimental group: Littermate control group: Tcf21 MCM ;Ctnnb1 fl/fl Postn MCM ;Ctnnb1 fl/fl TAM food Ctnnb1 fl/fl 8 week C TAC Sham Age: 2M Experimental group: Tcf21 MCM ;Ctnnb1 fl/fl ; R26 mtmg (β-catenin LOF) Littermate control group: Tcf21 MCM ;Ctnnb1 fl/+ ; R26 mtmg (Ctrl) Echo; HWT/BWT; Fibrosis; Hypertrophy TAM food TAC Age: 2M 4 week Frozen section; Isolate GFP cells D Ctrl TAC 4W β-catenin LOF TAC 4W E Total βcatenin 100 kd GAPDH 37 kd
3 Supplementary Figure 2. Experimental design for conditional β-catenin loss-of-function (LOF) in adult Tcf21 and Postn lineages after cardiac pressure overload (TAC). A) Illustration of the β- catenin LOF locus with loxp sites flanking Exons 2 and 6 of the Ctnnb1 gene. B) Tcf21 MCM ;Ctnnb1 fl/fl and Postn MCM ;Ctnnb1 fl/fl mice were used for CF-specific β-catenin LOF. Cre-negative Ctnnb1 fl/fl littermate mice were used as control groups. At the age of 2 months, both groups were randomly subjected to either sham or TAC surgery. CF-specific β-catenin LOF was induced after surgery via tamoxifen food ( 40 mg/body weight/day). Mice were maintained on tamoxifen food until termination. Eight weeks post-surgery, echocardiography was performed and mice were sacrificed. Heart samples were harvested for further experiments. C) Tcf21 MCM ;R26 mtmg ;Ctnnb1 fl/fl (β-catenin LOF) mice were used to label and trace Tcf21 lineage CFs with β-catenin LOF. Tcf21 MCM ;R26 mtmg ; Ctnnb1 fl/+ (control) mice were used as controls. At 2 months, both groups were randomly subjected to TAC or sham surgery. CF-specific β-catenin LOF was induced right after surgery via tamoxifen food ( 40 mg/body weight/day). Mice were maintained on tamoxifen food for 4 weeks. Four weeks post-surgery, hearts were collected for immunostaining or isolation of GFP-labeled CFs. D) Loss of β-catenin in GFP + cells from Tcf21 MCM ;R26 mtmg ;Ctnnb1 fl/fl (β-catenin LOF) hearts was confirmed by Western blot analysis in N=2 experiments of 3 hearts each. E) Expression of Axin2 mrna was also significantly reduced in GFP + cells from Tcf21 MCM ;R26 mtmg ;Ctnnb1 fl/ β-catenin LOF hearts compared to controls. N=6 hearts/group. Data points are shown with median and interquartile ranges indicated. Statistical significance was determined using unpaired Mann-Whitney U tests: *P<0.05 versus control.


 N=5-7 hearts/group.")

4 A Ctrl Sham Tcf21 MCM ;Ctnnb1 fl/fl Sham B Ctrl TAC Tcf21 MCM ;Ctnnb1 fl/fl TAC C Ctrl Sham Postn MCM ;Ctnnb1 fl/fl Sham D Ctrl TAC Postn MCM ;Ctnnb1 fl/fl TAC Supplementary Figure 3. Capillary density 8 weeks after TAC. A,C) Representative images of Lectin1 staining in Ctrl and β-catenin LOF hearts 8 weeks after TAC are shown. Myocardial capillary density significantly decreased 8 weeks after TAC but no difference was observed between Ctrl and Tcf21 MCM ;Ctnnb1 fl/fl (B) and Postn MCM ;Ctnnb1 fl/fl mice (D) N=5-7 hearts/group. Data points are shown with median and interquartile ranges indicated. Statistical significance was determined using unpaired Mann-Whitney U tests: *P<0.05 vs Ctrl. Scale bar=100µm.


5 A Ctrl TAC 4W phh3 GFP β-catenin LOF TAC 4W B Ctrl TAC 4W TUNEL GFP β-catenin LOF TAC 4W Supplementary Figure 4. Proliferation and apoptosis were barely detected in GFP + Tcf21 lineage CFs 4 weeks after TAC. A) Representative images of GFP (Green) and phh3 (Red) co-staining in Tcf21 MCM β-catenin LOF and control hearts 4 weeks after TAC are shown. B) Representative images of GFP (Green) and TUNEL (Red) co-staining in β-catenin LOF and control hearts 4 weeks after TAC are shown. Very few phh3 + /GFP + and TUNEL + /GFP + cells (white arrows) were found in myocardium. Scale bar=100µm.


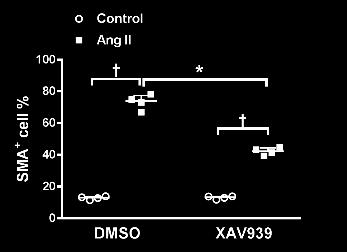
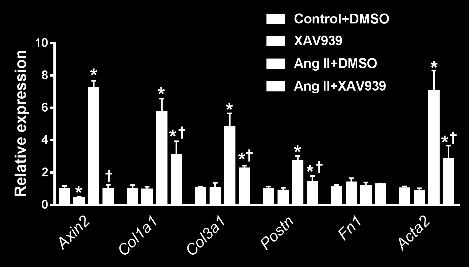
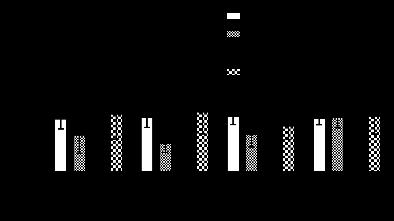
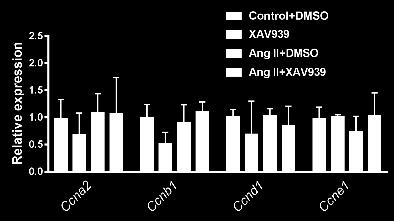
6 A Control Ang II B XAV939 Ang II+XAV939 C αsma D Control XAV939 Ang II Ang II+XAV939 phh3 E F
7 Supplementary Figure 5. Wnt/β-catenin signaling contributes to Angiotensin II (Ang II) induced cardiomyocyte CF activation. A) Representative images of αsma (Green) staining in cultured P60 CFs under indicated conditions are shown. Scale bar=100µm. B) Ang II (100nM) induces significantly more αsma+ CFs relative to DMSO controls in cultured P60 CFs. Inhibition of Wnt/β-catenin signaling by XAV939 (5µM) partially abrogated Ang II-induced αsma expression in CF. *P<0.05 vs DMSO groups, P<0.05 vs. Control. C) mrna expression of the Wnt target gene Axin2, and ECM genes Col1a1, Col3a1, Postn and Acta2 in P60 CFs with indicated treatments was measured by qpcr. *P<0.05 vs control, P<0.05 vs. DMSO. D) Representative images of phh3 (Red) staining in cultured P60 CFs under indicated conditions are shown. Scale bar=100µm. No difference in proliferating CF percentage (E) and cell-cycle genes (F) Ccna2, Ccnb1, Ccnd1 and Ccne1 expression was observed among groups. N=4 independent cultures/group. Statistical significance was determined by Kruskal-Wallis tests followed Mann-Whitney U tests for pairwise comparisons using Bonferonni adjustments to control for multiple testing. Data points are shown with median and interquartile ranges indicated.


 TGFβ1 induces β-catenin activation in cultured P60 CFs as determined by Western analysis.")
8 A Wnt1 100ng/mL 100kD 100kD hours Active βcatenin Total βcatenin B TGFβ1 10ng/mL 100kD hours Active βcatenin 100kD Total βcatenin Supplementary Figure 6. Wnt1 and TGFβ1 induce β-catenin activation in cultured P60 CFs. A) Wnt1 induces β-catenin activation in cultured P60 CFs as determined by Western analysis. B) TGFβ1 induces β-catenin activation in cultured P60 CFs as determined by Western analysis. Data points are shown with median and interquartile ranges indicated. Statistical significance was determined using unpaired Mann-Whitney U tests: *P<0.05 versus 0 h. N=4 independent cultures.

 for Col3a1 (A) and Postn (B) that were amplified in β-catenin ChIP assays.")
9 A ChIP sequence tracks for Col3a1 B ChIP sequence tracks for Postn Supplementary Figure 7. Genomic sequences containing LEF binding domains for Col3a1 and Postn loci amplified in β-catenin ChIP assays. Screen shots of UCSC genome browser21 (UCSC Genome Browser on Mouse Dec 2011 (GRCm38/mm10)) show LEF binding domains (red arrow) for Col3a1 (A) and Postn (B) that were amplified in β-catenin ChIP assays. These sequences have high conservation among species.
10 Quiescent CF TAC Cardiomyocyte TGFβ β-catenin β-catenin Activated CF Col1/3 Postn Fibrosis Hypertrophy Supplementary Figure 8. Model for Wnt/β-catenin signaling in CFs after pressure-overload injury induced by TAC. In TAC-induced pressure overload injury, Wnt/β-catenin is required for the synthetic phenotype in CFs as indicated by fibrotic gene expression, including Col1a1, Col3a1 and Postn. With loss of β-catenin in Tcf21or Postn lineage cells, reduced fibrotic ECM gene expression and cardiomyocyte hypertrophy is the primary outcome after TAC-induced pressure overload injury in mice. Moreover, Wnt/β-catenin may also act downstream in TGFβ induced CF activation. Therefore, Wnt/β-catenin in CFs plays an important and integral role for fibrosis and hypertrophy development.

11 A Tcf21 MCM ;R26 mtmg Sham TAC Sham TAC Tcf21 MCM ;R26 mtmg Sham TAC Sham TAC 100kD Total β-catenin Active β-catenin 100kD B Ctrl TAC 4W β-catenin LOF TAC 4W Total β-catenin 100 kd GAPDH 37 kd C 100 kd hours D Active β-catenin hours 100 kd Total βcatenin
12 Supplementary Figure 9. Original Western blot images. Original Western blot images are shown for Figure 1C (A), Supplementary Figure 2D (B), Supplementary Figure 6A (C), and Supplementary Figure 6B (D).
13 Supplementary Table 1: Cardiac function measured by echocardiography 8 weeks post-tac or sham surgery: Control Tcf21 MCM ;Ctnnb1 fl/fl Control Tcf21 MCM ;Ctnnb1 fl/fl sham N=5 sham N=5 MI N=6 MI N=6 IVSd (mm) 0.78± ± ±0.07* 1.09±0.07* IVSs (mm) 1.17± ± ± ±0.08 LVIDd (mm) 3.67± ± ±0.15* 4.22±0.08* LVIDs (mm) 2.51± ± ±0.17* 3.38±0.10* LVPWd (mm) 0.89± ± ± ±0.03 LVPWs (mm) 1.10± ± ± ±0.03 EF (%) 60.61± ± ±2.35* 41.16±2.01* FS (%) 31.78± ± ±1.19* 19.95±1.14* LV mass ± ± ±17.41* ±11.35* LV mass corrected 88.34± ± ±13.93* ±9.08* LV Vol d (µl) 57.89± ± ±8.38* 79.54±3.59* LV Vol s (µl) 22.90± ± ±8.49* 47.01±3.34* HR (bpm) ± ± ± ±10.51 Pressure gradient (mmhg) 51.17± ±2.17
14 Control sham N=5 Postn MCM ;Ctnnb1 fl/fl sham N=5 Control MI N=6 Postn MCM ;Ctnnb1 fl/fl MI N=6 IVSd (mm) 0.95± ± ± ±0.08 IVSs (mm) 1.21± ± ± ±0.09 LVIDd (mm) 4.02± ± ±0.06* 4.33±0.14* LVIDs (mm) 2.83± ± ±0.07* 3.50±0.15* LVPWd (mm) 0.62± ± ±0.12* 1.05±0.10 LVPWs (mm) 1.01± ± ± ±0.12 EF (%) 57.44± ± ±1.62* 39.90±2.47* FS (%) 29.88± ± ±0.76* 19.32±1.35* LV mass ± ± ±17.26* ±18.56* LV mass corrected 92.27± ± ±13.81* ±14.85* LV Vol d (µl) 71.57± ± ±3.23* 85.26±6.44* LV Vol s (µl) 30.82± ± ±3.86* 51.82±5.28* HR (bpm) ± ± ± ±11.77 Pressure gradient (mmhg) 52.57± ±2.89 Data are mean ± SEM. Significance was determined using Kruskal-Wallis test followed by Bonferroni corrections. *P<0.05 vs. sham; P<0.05 vs. STG MI. IVSd: interventricular septum thickness in diastole; IVSs: interventricular septum thickness in systole; LVIDd: left ventricular end-diastolic diameter; LVIDs: left ventricular end-systolic diameter; LVPWd: left ventricle posterior wall thickness in diastole/systole; LVPWs: left ventricle posterior wall thickness in diastole/systole; EF: ejection fraction; FS: fractional shortening; LV Vol d: left ventricular enddiastolic volume; LV Vol s: left ventricular end-systolic volume; HR: heart rate.
15 Supplementary Table 2: Cardiac function measured by echocardiography after tamoxifen treatment for 8 weeks: Tcf21 MCM+/- Tcf21 MCM-/- Postn MCM+/- Postn MCM-/- Ctnnb1 fl/fl Ctnnb1 fl/fl N=6 N=6 N=6 N=6 IVSd (mm) 0.78± ± ± ±0.02 IVSs (mm) 1.15± ± ± ±0.09 LVIDd (mm) 3.53± ± ± ±0.07 LVIDs (mm) 2.35± ± ± ±0.08 LVPWd (mm) 0.79± ± ± ±0.05 LVPWs (mm) 1.00± ± ± ±0.08 EF (%) 63.35± ± ± ±1.37 FS (%) 33.67± ± ± ±0.94 LV mass 93.67± ± ± ±5.58 LV mass corrected 75.53± ± ± ±4.46 LV Vol d (µl) 52.60± ± ± ±3.02 LV Vol s (µl) 19.48± ± ± ±1.99 HR (bpm) ± ± ± ±8.70 Data are mean ± SEM.
16 Supplementary Table 3: Primers for qrt-pcr and ChIP Genotyping primers Gene Forward Sequence Reverse Sequence Cre GCGGTCTGGCAGTAAAAACTATC GTGAAACAGCATTGCTGTCACTT Ctnnb1 fl/fl AAGGTAGAGTGATGAAAGTTGTT CACCATGTCCTCTGTCTATTC ROSA mtmg CTCTGCTGCCTCCTGGCTTCT TCAATGGGCGGGGGTCGTT qrt-pcr primers Gene Forward Sequence Reverse Sequence L7 AAGACGAAGGAGCTGCAGAAC GAAGCTCATCTATGAGAAGGC Axin2 GAGTAGCGCCGTGTTAGTGACT CCAGGAAAGTCCGGAAGAGGTATG Col1a1 TCCTGACGCATGGCCAAGAAGACA TCCGGGCAGAAAGCACAGCACTC Col3a1 GCACAGCAGTCCACCGTAGA TCTCCAAATGGGATCTCTGG Postn CGAAGGGGACAGTATCTCCA AGGTCGGTGAAAGTGGTTTG Fn1 ATGTGGACCCCTCCTGATAGT GCCCAGTGATTTCAGCAAAGG Acta2 GTCCCAGACATCAGGGAGTAA TCGGATACTTCAGCGTCAGGA Myh7 ATGTGCCGGACCTTGGAAG CCTCGGGTTAGCTGAGAGATCA ChIP primers Gene Forward Sequence Reverse Sequence Axin2 P+1828: TCCCGTGTCACTGTTTCT P+1944: AGGTGCTCGTCTCAAGTAT Col3a1 P-4700: ACCAACAGATTGGGAAAGG P-4566: CTCGGGTGAGAATTCTTTGT Postn P-3585: GGAAGAGACTGCTAATTCCTAC P-3458: GAGACATCTAGTGGAGAAAGTG negative ATGGTTGCCACTGGGGATCT TGCCAAAGCCTAGGGGAAGA
c Ischemia (30 min) Reperfusion (8 w) Supplementary Figure bp 300 bp Ischemia (30 min) Reperfusion (4 h) Dox 20 mg/kg i.p.
 Reperfusion (8 w) Supplementary Figure bp 300 bp Ischemia (30 min) Reperfusion (4 h) Dox 20 mg/kg i.p.") a Marker Ripk3 +/ 5 bp 3 bp b Ischemia (3 min) Reperfusion (4 h) d 2 mg/kg i.p. 1 w 5 w Sacrifice for IF size A subset for echocardiography and morphological analysis c Ischemia (3 min) Reperfusion (8
a Marker Ripk3 +/ 5 bp 3 bp b Ischemia (3 min) Reperfusion (4 h) d 2 mg/kg i.p. 1 w 5 w Sacrifice for IF size A subset for echocardiography and morphological analysis c Ischemia (3 min) Reperfusion (8
Postn MCM Smad2 fl/fl Postn MCM Smad3 fl/fl Postn MCM Smad2/3 fl/fl. Postn MCM. Tgfbr1/2 fl/fl TAC
 A Smad2 fl/fl Smad3 fl/fl Smad2/3 fl/fl Tgfbr1/2 fl/fl 1. mm B Tcf21 MCM Tcf21 MCM Smad3 fl/fl Tcf21 MCM Smad2/3 fl/fl Tcf21 MCM Tgfbr1/2 fl/fl αmhc MCM C 1. mm 1. mm D Smad2 fl/fl Smad3 fl/fl Smad2/3
E10.5 E18.5 P2 10w 83w NF1 HF1. Sham ISO. Bmi1. H3K9me3. Lung weight (g)
") Myociyte cross-sectional Relative mrna levels Relative levels Relative mrna levels Supplementary Figures and Legends a 8 6 4 2 Ezh2 E1.5 E18.5 P2 1w 83w b Ezh2 p16 amhc b-actin P2 43w kd 37 86 16 wt mouse
Myociyte cross-sectional Relative mrna levels Relative levels Relative mrna levels Supplementary Figures and Legends a 8 6 4 2 Ezh2 E1.5 E18.5 P2 1w 83w b Ezh2 p16 amhc b-actin P2 43w kd 37 86 16 wt mouse
doi: /nature14508 Rappsilber et al.
 SUPPLEMENTARY INFORMATION doi:1.138/nature1458 Grosso et al. Barbosa et al. 74 72 45 33 47 7 51 Rappsilber et al. Supplementary Figure 1 a, Venn-Diagram of identified splice factors in the work of Barbossa
Control. csarnt -/- Cre, f/f
 ody weight (g) A re,f/f re x f/f f/+ re, f/+ re,f/+ f/f x f/f f/+ cs -/- re, f/f re f/f re, f/f Normal chow Tamoxifen Tamoxifen Tamoxifen W 4W re f/f re, re/ff f/f re f/f re, re/ff f/f Normal chow Tamoxifen
Supplementary Figure 1. Spatial distribution of LRP5 and β-catenin in intact cardiomyocytes. (a) and (b) Immunofluorescence staining of endogenous
 and (b) Immunofluorescence staining of endogenous") Supplementary Figure 1. Spatial distribution of LRP5 and β-catenin in intact cardiomyocytes. (a) and (b) Immunofluorescence staining of endogenous LRP5 in intact adult mouse ventricular myocytes (AMVMs)
Supplementary Figure 1. Spatial distribution of LRP5 and β-catenin in intact cardiomyocytes. (a) and (b) Immunofluorescence staining of endogenous LRP5 in intact adult mouse ventricular myocytes (AMVMs)
Supplementary Figure 1. Confocal immunofluorescence showing mitochondrial translocation of Drp1. Cardiomyocytes treated with H 2 O 2 were prestained
 Supplementary Figure 1. Confocal immunofluorescence showing mitochondrial translocation of Drp1. Cardiomyocytes treated with H 2 O 2 were prestained with MitoTracker (red), then were immunostained with
hemodynamic stress. A. Echocardiographic quantification of cardiac dimensions and function in
 SUPPLEMENTAL FIGURE LEGENDS Supplemental Figure 1. Fbn1 C1039G/+ hearts display normal cardiac function in the absence of hemodynamic stress. A. Echocardiographic quantification of cardiac dimensions and
Supplemental Table 1. Echocardiography Control (n=4)
") Supplemental Table 1. Echocardiography (n=4) Mlc2v cre/+ ; DNMAML (n=4) LVIDd, mm 3.9±0.3 4.3±0.3 LVIDs, mm 2.6±0.4 2.9±0.2 d, mm 0.72±0.06 0.75±0.1 LVPWd, mm 0.72±0.06 0.77±0.11 FS, % 33±6 33±1 EF, %
Supplemental Table 1. Echocardiography (n=4) Mlc2v cre/+ ; DNMAML (n=4) LVIDd, mm 3.9±0.3 4.3±0.3 LVIDs, mm 2.6±0.4 2.9±0.2 d, mm 0.72±0.06 0.75±0.1 LVPWd, mm 0.72±0.06 0.77±0.11 FS, % 33±6 33±1 EF, %
Probe. Hind III Q,!?R'!! /0!!!!D1"?R'! vector. Homologous recombination
 Supple-Zhang Page 1 Wild-type locus Targeting construct Targeted allele Exon Exon3 Exon Probe P1 P P3 FRT FRT loxp loxp neo vector amh I Homologous recombination neo P1 P P3 FLPe recombination Q,!?R'!!
Protection against doxorubicin-induced myocardial dysfunction in mice by cardiac-specific expression of carboxyl terminus of hsp70-interacting protein
 Protection against doxorubicin-induced myocardial dysfunction in mice by cardiac-specific expression of carboxyl terminus of hsp70-interacting protein Lei Wang 1, Tian-Peng Zhang 1, Yuan Zhang 2, Hai-Lian
SUPPLEMENTARY INFORMATION
 a c e doi:10.1038/nature10407 b d f Supplementary Figure 1. SERCA2a complex analysis. (a) Two-dimensional SDS-PAGE gels of SERCA2a complexes. A silver-stained SDSPAGE gel is shown, which reveals a 12 kda
In vivo bromodeoxyuridine (BrdU) incorporation was performed to analyze cell
 incorporation was performed to analyze cell") Supplementary Methods BrdU incorporation in vivo In vivo bromodeoxyuridine (BrdU) incorporation was performed to analyze cell proliferation in the heart. Mice were subjected to LI-TAC, and 5 days later
Supplementary Methods BrdU incorporation in vivo In vivo bromodeoxyuridine (BrdU) incorporation was performed to analyze cell proliferation in the heart. Mice were subjected to LI-TAC, and 5 days later
SUPPLEMENTARY INFORMATION
 doi:10.1038/nature10188 Supplementary Figure 1. Embryonic epicardial genes are down-regulated from midgestation stages and barely detectable post-natally. Real time qrt-pcr revealed a significant down-regulation
BNP mrna expression in DR and DS rat left ventricles (n = 5). (C) Plasma norepinephrine
. (C) Plasma norepinephrine") Kanazawa, et al. Supplementary figure legends Supplementary Figure 1 DS rats had congestive heart failure. (A) DR and DS rat hearts. (B) QRT-PCR analysis of BNP mrna expression in DR and DS rat left ventricles
Kanazawa, et al. Supplementary figure legends Supplementary Figure 1 DS rats had congestive heart failure. (A) DR and DS rat hearts. (B) QRT-PCR analysis of BNP mrna expression in DR and DS rat left ventricles
Moore-Morris et al. Supplemental Table 1.
 Moore-Morris et al. Supplemental Table. In vivo echocardiographic assessment of cardiac size and function following transaortic constriction (T) at 7d and 8d. SHM 7d N=6 T 7d N=5 SHM 8d N= T 8d N=6 W,
Gallic acid prevents isoproterenol-induced cardiac hypertrophy and fibrosis through regulation of JNK2 signaling and Smad3 binding activity
 Gallic acid prevents isoproterenol-induced cardiac hypertrophy and fibrosis through regulation of JNK2 signaling and Smad3 binding activity Yuhee Ryu 1,+, Li Jin 1,2+, Hae Jin Kee 1,, Zhe Hao Piao 3, Jae
Supplementary Materials for
 www.sciencesignaling.org/cgi/content/full/8/375/ra41/dc1 Supplementary Materials for Actin cytoskeletal remodeling with protrusion formation is essential for heart regeneration in Hippo-deficient mice
Serum cytokine levels in control and tumor-bearing male and female mice at day 15.
 Supplementary Table 1. Serum cytokine levels in control and tumor-bearing male and female mice at day 15. Male Female Cytokine Control C-26 Control C-26 IL-1β 2.0 ± 0.8 9.6 ± 1.5* 1.8 ± 0.2 6.8 ± 1.4*
Fetal gene upregulation by 1-wk TAC is significantly increased in mice lacking RGS2.
 3562-RG-1 Supplementary Figure 1 Fetal gene upregulation by 1-wk is significantly increased in mice lacking RGS2. ANP(Nppa) /BNP(Nppb) A-type and B-type natriuretic peptide; β-mhc (Myh7) beta myosin heavy
Supplementary Figure 1 ITGB1 and ITGA11 increase with evidence for heterodimers following HSC activation. (a) Time course of rat HSC activation
 Time course of rat HSC activation") Supplementary Figure 1 ITGB1 and ITGA11 increase with evidence for heterodimers following HSC activation. (a) Time course of rat HSC activation indicated by the detection of -SMA and COL1 (log scale).
Supplementary Figure 1 ITGB1 and ITGA11 increase with evidence for heterodimers following HSC activation. (a) Time course of rat HSC activation indicated by the detection of -SMA and COL1 (log scale).
Prospect Cardiac Packages. S-Sharp
 Prospect Cardiac Packages S-Sharp B mode: Teichholz: Teichholz formula LV Volume 2D: modified Simpson's rule method ALM: area length method LV Volume (Intg.): integral method M mode: Long axis: Teichholz
Supplementary Figure 1. Repression of hepcidin expression in the liver of mice treated with
 Supplementary Figure 1. Repression of hepcidin expression in the liver of mice treated with DMN Immunohistochemistry for hepcidin and H&E staining (left). qrt-pcr assays for hepcidin in the liver (right).
Nature Genetics: doi: /ng Supplementary Figure 1. Parameters and consequences of mononuclear cardiomyocyte frequency.
 Supplementary Figure 1 Parameters and consequences of mononuclear cardiomyocyte frequency. (a) Correlation of the frequency of mononuclear cardiomyocytes to the frequency of cardiomyocytes with three or
Supplementary Figure 1. Expression of CUGBP1 in non-parenchymal liver cells treated with TGF-β
 Supplementary Figures Supplementary Figure 1. Expression of CUGBP1 in non-parenchymal liver cells treated with TGF-β and LPS. Non-parenchymal liver cells were isolated and treated with or without TGF-β
Supplementary Figure 1: Hsp60 / IEC mice are embryonically lethal (A) Light microscopic pictures show mouse embryos at developmental stage E12.
 Light microscopic pictures show mouse embryos at developmental stage E12.") Supplementary Figure 1: Hsp60 / IEC mice are embryonically lethal (A) Light microscopic pictures show mouse embryos at developmental stage E12.5 and E13.5 prepared from uteri of dams and subsequently genotyped.
Supplementary Figure 1: Hsp60 / IEC mice are embryonically lethal (A) Light microscopic pictures show mouse embryos at developmental stage E12.5 and E13.5 prepared from uteri of dams and subsequently genotyped.
Supplementary Information
 Supplementary Information mediates STAT3 activation at retromer-positive structures to promote colitis and colitis-associated carcinogenesis Zhang et al. a b d e g h Rel. Luc. Act. Rel. mrna Rel. mrna
Supplementary Figures Supplementary Figure 1. Development of the camp biosensor targeted to the SERCA2a microdomain.
 Supplementary Figures Supplementary Figure 1. Development of the camp biosensor targeted to the SERCA2a microdomain. A B C (A) Schematic representation of the new constructs designed for local camp imaging.
Title: Smooth muscle cell-specific Tgfbr1 deficiency promotes aortic aneurysm formation by stimulating multiple signaling events
 Title: Smooth muscle cell-specific Tgfbr1 deficiency promotes aortic aneurysm formation by stimulating multiple signaling events Pu Yang 1, 3, radley M. Schmit 1, Chunhua Fu 1, Kenneth DeSart 1, S. Paul
Supplementary Figure 1. Efficiency of Mll4 deletion and its effect on T cell populations in the periphery. Nature Immunology: doi: /ni.
 Supplementary Figure 1 Efficiency of Mll4 deletion and its effect on T cell populations in the periphery. Expression of Mll4 floxed alleles (16-19) in naive CD4 + T cells isolated from lymph nodes and
Alterations in sarcomere function modify the hyperplastic to hypertrophic transition phase of mammalian cardiomyocyte development
 Alterations in sarcomere function modify the hyperplastic to hypertrophic transition phase of mammalian cardiomyocyte development Benjamin R. Nixon, 1 Alexandra F. Williams, 1 Michael S. Glennon, 1 Alejandro
Alternatively Activated Macrophages Determine the Repair of the Infarcted
 Alternatively Activated Macrophages Determine the Repair of the Infarcted Adult Murine Heart (Shiraishi et al.) List of Supplemental Materials Supplemental Methods Supplemental Figure 1. Cardiac CD206
Kidney. Heart. Lung. Sirt1. Gapdh. Mouse IgG DAPI. Rabbit IgG DAPI
 a e Na V 1.5 Ad-LacZ Ad- 110KD b Scn5a/ (relative to Ad-LacZ) f 150 100 50 0 p = 0.65 Ad-LacZ Ad- c Heart Lung Kidney Spleen 110KD d fl/fl c -/- DAPI 20 µm Na v 1.5 250KD fl/fl Rabbit IgG DAPI fl/fl Mouse
Inflammatory responses mediate brain heart interaction after ischemic stroke in adult mice
 Original Article Inflammatory responses mediate brain heart interaction after ischemic stroke in adult mice Journal of Cerebral Blood Flow & Metabolism 0(0) 1 17! Author(s) 2018 Article reuse guidelines:
(Stratagene, La Jolla, CA) (Supplemental Fig. 1A). A 5.4-kb EcoRI fragment
 (Supplemental Fig. 1A). A 5.4-kb EcoRI fragment") SUPPLEMENTAL INFORMATION Supplemental Methods Generation of RyR2-S2808D Mice Murine genomic RyR2 clones were isolated from a 129/SvEvTacfBR λ-phage library (Stratagene, La Jolla, CA) (Supplemental Fig.
SUPPLEMENTAL INFORMATION Supplemental Methods Generation of RyR2-S2808D Mice Murine genomic RyR2 clones were isolated from a 129/SvEvTacfBR λ-phage library (Stratagene, La Jolla, CA) (Supplemental Fig.
Supplementary Figure 1.TRIM33 binds β-catenin in the nucleus. a & b, Co-IP of endogenous TRIM33 with β-catenin in HT-29 cells (a) and HEK 293T cells
 and HEK 293T cells") Supplementary Figure 1.TRIM33 binds β-catenin in the nucleus. a & b, Co-IP of endogenous TRIM33 with β-catenin in HT-29 cells (a) and HEK 293T cells (b). TRIM33 was immunoprecipitated, and the amount of
Supplementary Figure 1.TRIM33 binds β-catenin in the nucleus. a & b, Co-IP of endogenous TRIM33 with β-catenin in HT-29 cells (a) and HEK 293T cells (b). TRIM33 was immunoprecipitated, and the amount of
Dr. Dermot Phelan MB BCh BAO PhD European Society of Cardiology 2012
 Relative Apical Sparing of Longitudinal Strain Using 2- Dimensional Speckle-Tracking Echocardiography is Both Sensitive and Specific for the Diagnosis of Cardiac Amyloidosis. Dr. Dermot Phelan MB BCh BAO
Supplementary Figures and Figure Legends
 1 Supplementary Figures and Figure Legends 2 3 4 5 6 7 8 9 10 11 12 13 14 15 16 17 Supplementary Figure 1: camp levels in myocytes confirm studies in perfused hearts. (a) Time-resolved camp dynamics (presented
Supporting Information
 Supporting Information Kuroda et al. 10.1073/pnas.1002178107 SI Methods Monoclonal Antibodies Against Nox4. Generation of the anti-nox4 mouse monoclonal antibody (3D2), which detects Nox4 and does not
Supplemental Information. Myocardial Polyploidization Creates a Barrier. to Heart Regeneration in Zebrafish
 Developmental Cell, Volume 44 Supplemental Information Myocardial Polyploidization Creates a Barrier to Heart Regeneration in Zebrafish Juan Manuel González-Rosa, Michka Sharpe, Dorothy Field, Mark H.
Supplementary Figure 1. Baf60c and baf180 are induced during cardiac regeneration in zebrafish. RNA in situ hybridization was performed on paraffin
 Supplementary Figure 1. Baf60c and baf180 are induced during cardiac regeneration in zebrafish. RNA in situ hybridization was performed on paraffin sections from sham-operated adult hearts (a and i) and
Supplementary Figure 1. Expression of phospho-sik3 in normal and osteoarthritic articular cartilage in the knee. (a) Semiserial histological sections
 Semiserial histological sections") Supplementary Figure 1. Expression of phospho-sik3 in normal and osteoarthritic articular cartilage in the knee. (a) Semiserial histological sections of normal cartilage were stained with safranin O-fast
Supplementary Figure 1. Expression of phospho-sik3 in normal and osteoarthritic articular cartilage in the knee. (a) Semiserial histological sections of normal cartilage were stained with safranin O-fast
SUPPLEMENTARY INFORMATION
 1 SUPPLEMENTARY INFORMATION Mutations in the NOTCH pathway regulator MIB1 cause left ventricular noncompaction cardiomyopathy Guillermo Luxán, Jesús C. Casanova, Beatriz Martínez-Poveda, Belén Prados,
Supplementary Figures
 Supplementary Figures Supplementary Figure 1. Confirmation of Dnmt1 conditional knockout out mice. a, Representative images of sorted stem (Lin - CD49f high CD24 + ), luminal (Lin - CD49f low CD24 + )
Supplementary Figures
 Supplementary Figures Supplementary Figure 1 Correlation between LKB1 and YAP expression in human lung cancer samples. (a) Representative photos showing LKB1 and YAP immunohistochemical staining in human
Supplementary Material
 Supplementary Material Induction of myocardial infarction Mice were anesthetized by intraperitoneal injection of pentobarbital (7 mg/kg). In the supine position, endotracheal intubation was performed.
Small Molecule Inhibitor of the Wnt Pathway (SM04755) as a Potential Topical Scleroderma Treatment
 as a Potential Topical Scleroderma Treatment") Small Molecule Inhibitor of the Wnt Pathway (SM755) as a Potential Topical Scleroderma Treatment Vishal Deshmukh, PhD, Allison Hood, Yusuf Yazici, MD Disclosures Vishal Deshmukh, Ph.D. o Financial disclosure:
Small Molecule Inhibitor of the Wnt Pathway (SM755) as a Potential Topical Scleroderma Treatment Vishal Deshmukh, PhD, Allison Hood, Yusuf Yazici, MD Disclosures Vishal Deshmukh, Ph.D. o Financial disclosure:
7SK ChIRP-seq is specifically RNA dependent and conserved between mice and humans.
 Supplementary Figure 1 7SK ChIRP-seq is specifically RNA dependent and conserved between mice and humans. Regions targeted by the Even and Odd ChIRP probes mapped to a secondary structure model 56 of the
fl/+ KRas;Atg5 fl/+ KRas;Atg5 fl/fl KRas;Atg5 fl/fl KRas;Atg5 Supplementary Figure 1. Gene set enrichment analyses. (a) (b)
 (b)") KRas;At KRas;At KRas;At KRas;At a b Supplementary Figure 1. Gene set enrichment analyses. (a) GO gene sets (MSigDB v3. c5) enriched in KRas;Atg5 fl/+ as compared to KRas;Atg5 fl/fl tumors using gene set
KRas;At KRas;At KRas;At KRas;At a b Supplementary Figure 1. Gene set enrichment analyses. (a) GO gene sets (MSigDB v3. c5) enriched in KRas;Atg5 fl/+ as compared to KRas;Atg5 fl/fl tumors using gene set
SUPPLEMENTARY INFORMATION
 DOI: 10.1038/ncb2607 Figure S1 Elf5 loss promotes EMT in mammary epithelium while Elf5 overexpression inhibits TGFβ induced EMT. (a, c) Different confocal slices through the Z stack image. (b, d) 3D rendering
Supplemental Figure I
 Supplemental Figure I Kl ( mmol/l)-induced Force orta M (mn) 1 (mn) 1 Supplemental Figure I. Kl-induced contractions. and, Kl ( mmol/l)-induced contractions of the aorta () and those of mesenteric arteries
Genetic ablation of Acp1 (Lmptp) in mice prevents heart failure
 in mice prevents heart failure") Genetic ablation of Acp1 (Lmptp) in mice prevents heart failure Coralie Poizat, Ph.D. Director, Cardiovascular Research Program KFSHRC-Riyadh Saudi Heart Failure Working Group Jeddah, 5 December 2015 Cardiovascular
Genetic ablation of Acp1 (Lmptp) in mice prevents heart failure Coralie Poizat, Ph.D. Director, Cardiovascular Research Program KFSHRC-Riyadh Saudi Heart Failure Working Group Jeddah, 5 December 2015 Cardiovascular
SUPPLEMENTARY FIGURES
 SUPPLEMENTARY FIGURES 1 Supplementary Figure 1, Adult hippocampal QNPs and TAPs uniformly express REST a-b) Confocal images of adult hippocampal mouse sections showing GFAP (green), Sox2 (red), and REST
Angiotensin type 1a receptor-deficient mice develop diabetes-induced cardiac dysfunction, which is prevented by renin-angiotensin system inhibitors
 Yong et al. Cardiovascular Diabetology 2013, 12:169 CARDIO VASCULAR DIABETOLOGY ORIGINAL INVESTIGATION Open Access Angiotensin type 1a receptor-deficient mice develop diabetes-induced cardiac dysfunction,
Cardiomyocyte-enriched protein CIP protects against pathophysiological stresses and regulates cardiac homeostasis
 Cardiomyocyte-enriched protein CIP protects against pathophysiological stresses and regulates cardiac homeostasis Zhan-Peng Huang,, William T. Pu, Da-Zhi Wang J Clin Invest. 2015;125(11):4122-4134. https://doi.org/10.1172/jci82423.
Pretargeting and Bioorthogonal Click Chemistry-Mediated Endogenous Stem Cell Homing for Heart Repair
 Pretargeting and Bioorthogonal Click Chemistry-Mediated Endogenous Stem Cell Homing for Heart Repair Mouse Model of Myocardial Infarction (MI) All animal work was compliant with the Institutional Animal
Supplementary Information and Figure legends
 Supplementary Information and Figure legends Table S1. Primers for quantitative RT-PCR Target Sequence (5 -> 3 ) Target Sequence (5 -> 3 ) DAB2IP F:TGGACGATGTGCTCTATGCC R:GGATGGTGATGGTTTGGTAG Snail F:CCTCCCTGTCAGATGAGGAC
1.5 ASK1KO fed. fasted 16 hrs w/o water. Fed. 4th. 4th WT ASK1KO N=29, 11(WT), ,5(ASK1KO) ASK1KO ASK1KO **** Time [h]
![1.5 ASK1KO fed. fasted 16 hrs w/o water. Fed. 4th. 4th WT ASK1KO N=29, 11(WT), ,5(ASK1KO) ASK1KO ASK1KO **** Time [h]](/thumbs/87/97258189.jpg "1.5 ASK1KO fed. fasted 16 hrs w/o water. Fed. 4th. 4th WT ASK1KO N=29, 11(WT), ,5(ASK1KO) ASK1KO ASK1KO **** Time [h]") 7: 13: 19: 1: 7: 151117 a 151117 4th 4th b c RQ.95 KO.9.85.8.75.7 light dark light dark.65 7: 19: 7: 19: 7: Means ± SEM, N=6 RQ 1..9.8.7.6.6 KO CL (-) CL (+) ibat weight ratio (/body weight) [%].5.4.3.2.1
7: 13: 19: 1: 7: 151117 a 151117 4th 4th b c RQ.95 KO.9.85.8.75.7 light dark light dark.65 7: 19: 7: 19: 7: Means ± SEM, N=6 RQ 1..9.8.7.6.6 KO CL (-) CL (+) ibat weight ratio (/body weight) [%].5.4.3.2.1
Direct Renin Inhibitor Attenuates Left Ventricular Remodeling in Post-Myocardial Infarction Heart Failure Mice
 Original Article Acta Cardiol Sin 2013;29:160 167 Heart Failure Direct Renin Inhibitor Attenuates Left Ventricular Remodeling in Post-Myocardial Infarction Heart Failure Mice Ning-I Yang, Chia-Chi Liao,
Supplementary Information
 Supplementary Information TABLE S1. SUBJECT CHARACTERISTICS* Normal Control Subjects Subjects with Asthma p Value Number 23 48 Age (years) 35±10 35±10 0.75 Sex, M:F (% F) 9:12 (57) 17:26 (60) 0.76 FEV1
SOPten flox/flox (KO) Pten flox/flox (WT) flox allele 6.0 kb. Pten. Actin. ! allele 2.3 kb. Supplementary Figure S1. Yanagi, et al.
 Pten flox/flox (WT) flox allele 6.0 kb. Pten. Actin. ! allele 2.3 kb. Supplementary Figure S1. Yanagi, et al.") s1 A Pten flox/flox () SOPten flox/flox () flox allele 6. kb B Pten flox/flox () SOPten flox/flox () Pten Actin! allele 2.3 kb Supplementary Figure S1. Yanagi, et al. A B BrdU BrdU positive cells ( ) 3
s1 A Pten flox/flox () SOPten flox/flox () flox allele 6. kb B Pten flox/flox () SOPten flox/flox () Pten Actin! allele 2.3 kb Supplementary Figure S1. Yanagi, et al. A B BrdU BrdU positive cells ( ) 3
Supplementary information. The proton-sensing G protein-coupled receptor T-cell death-associated gene 8
 1 Supplementary information 2 3 The proton-sensing G protein-coupled receptor T-cell death-associated gene 8 4 (TDAG8) shows cardioprotective effects against myocardial infarction 5 Akiomi Nagasaka 1+,
Supplemental Figure 1. Western blot analysis indicated that MIF was detected in the fractions of
 Supplemental Figure Legends Supplemental Figure 1. Western blot analysis indicated that was detected in the fractions of plasma membrane and cytosol but not in nuclear fraction isolated from Pkd1 null
Research Article The Relationship between Reactive Oxygen Species and Cardiac Fibrosis in the Dahl Salt-Sensitive Rat under ACEI Administration
 Hindawi Publishing Corporation Veterinary Medicine International Volume, Article ID 6, 6 pages doi:.//6 Research Article The Relationship between Reactive Oxygen Species and Cardiac Fibrosis in the Dahl
a b c periosteum parietal bone bone marrow dura periosteum suture mesenchyme osteogenic front suture mesenchyme 1
 coronary suture sagittal suture DOI: 10.1038/ncb3139 a b c e parietal bone suture mesenchyme parietal bone bone marrow ura ura ura f parietal bone ura suture mesenchyme bone g ura osteogenic front suture
SUPPLEMENTARY INFORMATION
 SUPPLEMENTARY INFORMATION Supplementary Figure 1. Generation of a conditional allele of the Kindlin-2 gene. (A) A restriction map of the relevant genomic region of Kindlin-2 (top), the targeting construct
stability and tumor suppression
 Supplementary information The stress kinase MKK7 couples oncogenic stress to p53 stability and tumor suppression Daniel Schramek 1, Athanassios Kotsinas 2, Arabella Meixner 1, Teiji Wada 1, Ulrich Elling
Cardiac Magnetic Resonance in pregnant women
 Cardiac Magnetic Resonance in pregnant women Chen SSM, Leeton L, Dennis AT Royal Women s Hospital and The University of Melbourne, Parkville, Australia alicia.dennis@thewomens.org.au Quantification of
Supplementary Figure 1. Lkb1-deficient lung ADC progressively transdifferentiates into SCC. (a) A scheme showing the progression pattern of atypical
 A scheme showing the progression pattern of atypical") Supplementary Figure 1. Lkb1-deficient lung ADC progressively transdifferentiates into SCC. (a) A scheme showing the progression pattern of atypical adenomatous hyperplasia/epithelial hyperplasia (AAH/EH),
Supplementary Figure 1. Lkb1-deficient lung ADC progressively transdifferentiates into SCC. (a) A scheme showing the progression pattern of atypical adenomatous hyperplasia/epithelial hyperplasia (AAH/EH),
Title: Epigenetic mechanisms underlying maternal diabetes-associated risk of congenital heart disease
 1 Supplemental Materials 2 3 Title: Epigenetic mechanisms underlying maternal diabetes-associated risk of congenital heart disease 4 5 6 Authors: Madhumita Basu, 1 Jun-Yi Zhu, 2 Stephanie LaHaye 1,3, Uddalak
Patterns of Left Ventricular Remodeling in Chronic Heart Failure: The Role of Inadequate Ventricular Hypertrophy
 Abstract ESC 82445 Patterns of Left Ventricular Remodeling in Chronic Heart Failure: The Role of Inadequate Ventricular Hypertrophy FL. Dini 1, P. Capozza 1, P. Fontanive 2, MG. Delle Donne 1, V. Santonato
Polycomb protein Ezh2 regulates pancreatic β-cell Ink4a/Arf expression and regeneration in streptozotocin-induced diabetes mellitus
 Chen et al. 1 Polycomb protein Ezh2 regulates pancreatic β-cell Ink4a/Arf expression and regeneration in streptozotocin-induced diabetes mellitus Hainan Chen 1, Xueying Gu 1, I-hsin Su 2, Rita Bottino
SUPPLEMENTARY INFORMATION
 DOI: 10.1038/ncb2610 Figure S1 FSMCs derived from MSLN CLN transgenic mice express smooth muscle-specific proteins. Beta-galactosidase is ubiquitously expressed within cultured FSMCs derived from MSLN
SUPPLEMENTARY FIGURES AND TABLE
 SUPPLEMENTARY FIGURES AND TABLE Supplementary Figure S1: Characterization of IRE1α mutants. A. U87-LUC cells were transduced with the lentiviral vector containing the GFP sequence (U87-LUC Tet-ON GFP).
PRELIMINARY STUDIES OF LEFT VENTRICULAR WALL THICKNESS AND MASS OF NORMOTENSIVE AND HYPERTENSIVE SUBJECTS USING M-MODE ECHOCARDIOGRAPHY
 Malaysian Journal of Medical Sciences, Vol. 9, No. 1, January 22 (28-33) ORIGINAL ARTICLE PRELIMINARY STUDIES OF LEFT VENTRICULAR WALL THICKNESS AND MASS OF NORMOTENSIVE AND HYPERTENSIVE SUBJECTS USING
Exercise in Adverse Cardiac Remodeling: of Mice and Men
 Exercise in Adverse Cardiac Remodeling: of Mice and Men 17-01-2013 Dirk J Duncker Experimental Cardiology, Cardiology, Thoraxcenter Cardiovascular Research Institute COEUR Erasmus MC, University Medical
Supplementary Information. Induction of human pancreatic beta cell replication by inhibitors of dual specificity tyrosine regulated kinase
 Journal: Nature Medicine Supplementary Information Induction of human pancreatic beta cell replication by inhibitors of dual specificity tyrosine regulated kinase 1,2 Peng Wang PhD, 1,2 Juan-Carlos Alvarez-Perez
Nature Immunology: doi: /ni Supplementary Figure 1. Gene expression profile of CD4 + T cells and CTL responses in Bcl6-deficient mice.
 Supplementary Figure 1 Gene expression profile of CD4 + T cells and CTL responses in Bcl6-deficient mice. (a) Gene expression profile in the resting CD4 + T cells were analyzed by an Affymetrix microarray
Supplementary Methods. Animals and TAC surgery. Transgenic C57BL/6J mice expressing p115-rgs were
 Supplementary Methods Animals and TAC surgery. Transgenic C57BL/6J mice expressing p5-rgs were tried to generate three times. We obtained only one line that was used in the present study. Low success rate
B lymphocytes trigger monocyte mobilization and impair heart function after acute myocardial infarction
 Supplementary Figures to 3 B lymphocytes trigger monocyte moilization and impair heart function after acute myocardial infarction Yasmine Zouggari, Hafid Ait-Oufella, Philippe Bonnin, Taassome Simon, Andrew
Supplementary Information
 Supplementary Information Astrocytes regulate adult hippocampal neurogenesis through ephrin-b signaling Randolph S. Ashton, Anthony Conway, Chinmay Pangarkar, Jamie Bergen, Kwang-Il Lim, Priya Shah, Mina
B-Mode measurements protocols:
 Application Note How to Perform the Most Commonly Used Measurements from the Cardiac Measurements Package associated with Calculations of Cardiac Function using the Vevo Lab Objective The Vevo LAB offline
Supplementary Figure S I: Effects of D4F on body weight and serum lipids in apoe -/- mice.
 Supplementary Figures: Supplementary Figure S I: Effects of D4F on body weight and serum lipids in apoe -/- mice. Male apoe -/- mice were fed a high-fat diet for 8 weeks, and given PBS (model group) or
Supplemental Figure 1. Egr1 expression in adult Achilles tendons. (A,B) Achilles tendons were isolated from 2 month-old Egr1 +/- mice and stained for
 Achilles tendons were isolated from 2 month-old Egr1 +/- mice and stained for") Supplemental Figure 1. Egr1 expression in adult Achilles tendons. (A,B) Achilles tendons were isolated from 2 month-old Egr1 +/- mice and stained for LacZ activity, which reflects Egr1 expression. (A)
Supplemental Figure 1. Egr1 expression in adult Achilles tendons. (A,B) Achilles tendons were isolated from 2 month-old Egr1 +/- mice and stained for LacZ activity, which reflects Egr1 expression. (A)
Supplementary Information Titles Journal: Nature Medicine
 Supplementary Information Titles Journal: Nature Medicine Article Title: Corresponding Author: Supplementary Item & Number Supplementary Fig.1 Fig.2 Fig.3 Fig.4 Fig.5 Fig.6 Fig.7 Fig.8 Fig.9 Fig. Fig.11
M2 microglia/ macrophages drive oligodendrocyte differentiation during CNS remyelination
 Supplemental Information Title: M2 microglia/ macrophages drive oligodendrocyte differentiation during CNS remyelination Authors: Veronique E. Miron, Amanda Boyd, Jing-Wei Zhao, Tracy J. Yuen, Julia M.
3/27/2014. Introduction.
 Introduction. Myocardial perfusion & contractility becomes abnormal immediately after the onset of ischaemia, even before the development of the symptoms & ST segment changes. 1 Myocardial Wall Motion
Adipocyte-specific loss of PPARg attenuates cardiac hypertrophy
 Adipocyte-specific loss of PPARg attenuates cardiac hypertrophy Xi Fang,, Ju Chen, Nanping Wang JCI Insight. 2016;1(16):e89908. https://doi.org/10.1172/jci.insight.89908. Research Article Cardiology Cell
Supplementary Figure 1:
 Supplementary Figure 1: (A) Whole aortic cross-sections stained with Hematoxylin and Eosin (H&E), 7 days after porcine-pancreatic-elastase (PPE)-induced AAA compared to untreated, healthy control aortas
Supplementary Figure 1 IL-27 IL
 Tim-3 Supplementary Figure 1 Tc0 49.5 0.6 Tc1 63.5 0.84 Un 49.8 0.16 35.5 0.16 10 4 61.2 5.53 10 3 64.5 5.66 10 2 10 1 10 0 31 2.22 10 0 10 1 10 2 10 3 10 4 IL-10 28.2 1.69 IL-27 Supplementary Figure 1.
Mouse model of human Barth syndrome
 Mouse model of human Barth syndrome Zaza Khuchua, PhD Cincinnati Children s Research Foundation Cincinnati, OH, USA Barry J. Byrne, MD, PhD University of Florida Department of Pediatrics Gainesville, FL,
SUPPLEMENTARY FIGURES AND TABLES
 SUPPLEMENTARY FIGURES AND TABLES Supplementary Figure S1: CaSR expression in neuroblastoma models. A. Proteins were isolated from three neuroblastoma cell lines and from the liver metastasis of a MYCN-non
Supplementary Figures
 Supplementary Figures Supplementary Figure 1 Characterization of stable expression of GlucB and sshbira in the CT26 cell line (a) Live cell imaging of stable CT26 cells expressing green fluorescent protein
SUPPLEMENTARY RESULTS
 SUPPLEMENTARY RESULTS Supplementary Table 1. hfpr1- Flpln-CHO hfpr2-flpln-cho pec 50 E max (%) Log( /K A) Log( /K A) N pec 50 E max (%) Log( /K A) Log( /K A) n ERK1/2 phosphorylation fmlp 9.0±0.6 80±7
Supplementary Figure 1. Electroporation of a stable form of β-catenin causes masses protruding into the IV ventricle. HH12 chicken embryos were
 Supplementary Figure 1. Electroporation of a stable form of β-catenin causes masses protruding into the IV ventricle. HH12 chicken embryos were electroporated with β- Catenin S33Y in PiggyBac expression
Nature Medicine: doi: /nm.4324
 1 2 3 4 5 6 7 8 9 10 11 12 13 14 15 16 17 18 19 20 21 22 23 24 25 Supplementary Figure 1. Kinetics of SnCs development in surgically-induced OA and effect of GCV-induced SnC clearance on OA disease progression
A. One to three months of age. Anterior Lens (Mean ± SEM) Posterior Lens (Mean ± SEM) Mid Lens (Mean ± SEM) Cornea (Mean ± SEM) Genotype
 Posterior Lens (Mean ± SEM) Mid Lens (Mean ± SEM) Cornea (Mean ± SEM) Genotype") Supplementary Table 1. Location of lens opacification in Aldh1a1(-/-), Aldh3a1(-/-) single and Aldh1a1(-/-)/Aldh3a1(-/-) double knockout mice (DKO) at different ages. A. One to three months of age Genotype
Supplementary Table 1. Location of lens opacification in Aldh1a1(-/-), Aldh3a1(-/-) single and Aldh1a1(-/-)/Aldh3a1(-/-) double knockout mice (DKO) at different ages. A. One to three months of age Genotype
Supplementary material page 1/10
 Supplementary Figure 1. Metoprolol administration during ongoing AMI reduces MVO in STEMI patients (a, b) Complete representative CMR exams (short-axis covering the entire left ventricle (LV) from base