Supplementary Data. Supplementary Methods:
|
|
|
- Darlene Weaver
- 5 years ago
- Views:
Transcription
1 Supplementary Data Supplementary Methods: Cell viability assay. Cells were seeded overnight at a density of 2,000 cells per well in 96-well plates in RPMI with 10% FBS and then treated with the relevant reagents for 3 days. For MP08 and MP41 cells, the primary cells were first established in conditioned media (The American Journal of Pathology, 180, 2, 599, 2012) and then transferred to 10% FBS RPMI for viability studies. Viable cell numbers were determined using MTS assay kit according to the manufacturer s protocols (Promega). Each assay consisted of three replicates and was repeated at least twice. Data were expressed as percentages of control cells, calculated from the absorbance corrected for background. Caspase 3/7 assay. Caspase activity was detected by using Caspase-Glo 3/7 assay kit (Promega). Briefly, cells (2X10 4 cells/well) were seeded in a luminometer white 96 plate (Thermo scientific) and incubated for 24 hr at 37 C. Cells were treated with vehicle or with Erlotinib for 5 hrs. One hundred microlitre of caspase 3/7 reagents were added to each well and incubated for 1 hr on rotary shaker at room temperature. Luminescence for each well was recorded using GLOMAX+ instrument (Promega). Cell cycle analysis by Flow cytometry. Cells were exposed to Erlotinib for 24 hr. Approximately 1.5 X 10 5 cells were collected and centrifuged at 1,000 rpm for 5 min. DNA staining was performed by adding 500 µl propidium iodide (200 µg/ml in Triton X-100, 0.2% v/v saline, Final concentration: 100 µg/ml) and 50 µl RNAase (final concentration: 40 µg/ml) to 1.5 X 10 5 cells. Cellular DNA content was measured by Becton Dickinson FACStar Plus dual laser system and a FACSort system. Approximately 10,000 cells were analyzed for each DNA content histogram. The samples were excited at nm and the resulting fluorescence measured at wavelengths >550 nm. Analysis of the percentage of
2 cells in G1, S and G2 /M phases of the cell cycle was made by the ModFit LT program (Verify Software Home). Western blot analysis. Cell lysates were prepared using a RIPA buffer (Sigma) according to the manufacturer s instruction. Protein samples were applied to the wells of NuPAGE 4-20% Tris-Gly gel, electrophoresed in SDS running buffer (Invitrogen), and transferred to Nitrocellurose membranes using the iblot transfer apparatus (Invitrogen). Membranes were blocked in Tris-buffered saline containing 0.5% Tween 20 (TBS-T) and 5% BSA for 1 hr at room temperature followed by incubation with primary antibody overnight at 4 C. After membranes were washed three times for 10 min each in TBS-T, HRP-conjugated secondary antibody (Bio-Rad) in TBS-T containing 2% BSA was applied for 1 hour at room temperature. Proteins were visualized using G-box Chemi Systems (SynGene). Quantitative RT-PCR. Quantitative RT-PCR was performed on RNA isolated from NSCLC cells and patient samples. Total RNA was extracted using RNeasy mini kit (Qiagen), RNeasy FFPE kit (Qiagen) and RNAlater RNA stabilization reagent (Qiagen), according to the manufacturer s instructions. cdna was synthesized with High Capacity cdna Reverse transcription Kit (Applied Biosystems) and Taqman microrna Reverse Transcription Kit (Applied Biosystems). RT-PCR was performed on a LightCycler with SYBR Green system (Roche) using 7900HT Fast Real-Time PCR system (Applied Biosystems). GAPDH expression was used as an internal reference to normalize input cdna. Primer sequences used for real-time RT-PCR and quantitative RT-PCR of Cripto- 1, Cripto-3 and GAPDH are: (1) Cripto-1: Forward 5 -TCCAGTTTCCCCTGGAC G-3 and Reverse 5'-TTTAAGAAGAAAATGAGAAATTCGTT-3 ; (2) Cripto-3: Forward 5 -TGTAAAACGACGGCCAGTTCTACCCGGCTGTGATGGCC-3 and Reverse 5 -CAGGAAACAGCTATGACCGAGGTAAGAAGTAGTTAGTTCTGT-3 ; (3) GAPDH: Forward 5'-TGATGACATCAAGAAGGTGG-3' and Reverse 5'-TTTC TTACTCCTTGGAGGCC-3'. The specificities of Cripto-1 and -3 specific primers were validated in Cripto-1-positive/Cripto-3-negative (H727) and Cripto-3-
3 positive/cripto-1-negative (H69) cells (Biochem Biophys Res Commun. 377(1):215-20, 2008) (See Figure 1C). Taqman gene expression assays (Src: Hs _m1; GAPDH: Hs _g1; mir-205: has-mir-205-5p) were purchased from Invitrogen. sirna- and shrna-mediated knockdown. Transfection of a small interfering RNA (sirna) duplex targeting human Cripto-1 (Invitrogen, Stealth TDGF1- HSS144243), human SRC (Thermo, ON-TARGET Human SRC) and mir-205 inhibitor (Ambion, AM11015) were carried out using PepMutTM sirna transfection reagent (SignaGen), according to the manufacturer s instructions. Briefly, cells were seeded at a density of 6x10 5 cells/well in a 6-well tissue culture dish and incubated overnight. Cells were then transfected with the sirna- PepMute mixture (200 pmol sirna and 2.4 µl PepMute reagent) for 3 days. As a negative control, we used Stealth Negative control sirna (Invitrogen). In the shrna experiments, cells were infected with ZEB1 shrna (Open Biosystems shrna Library) retrovirus in the presence of 1 µg/ml polybrene, and were selected for 48 hrs with 1 µg/ml of puromycin 48 hrs after infection. Expression was measured by western blot h later. Cripto-1 and mir-205 overexpression studies. To establish stable cell lines, the pci-neo-hcripto-1 (Normanno et al., 2004) or mir-205 (HmiR0026-MR04, GeneCopoeiaTM) expression vectors were transfected using lipofectamintm 2000 plus (Invitrogen) following the manufacturer s instruction. All vectors were linearized by AhdI (NEB) enzyme to increase efficiency of plasmid integration. Cells (70-80% confluence) were washed with Opti-MEM (Invitrogen), and incubated with a DNA-lipofectamine mixture (2 µg DNA and 3 µl lipofectamine reagent). For stable transfection, the transfected cells were selected with 500 µg/ml of the antibiotic G418 (Gibco). The parental cells transfected with empty vectors were generated as controls. Cripto-1 over-expression was detected using an anti-human Cripto-1 rabbit monoclonal antibody (Epitomics) by western blot and mir-205 expression was measured by RT-PCR.
4 Migration and invasion assay. CytoSelect 24-Well Cell Invasion and migration Assay kits were purchased from Cell Biolabs. According to the manufacturer s instructions, cells were serum-starved overnight and 5x10 5 cells in 300 µl of medium without FBS were placed in the upper chamber of transwell plates and the lower chamber was filled with 0.5 ml of medium supplemented with 10% FBS. To quantify the migrated and invaded cells, crystal violet-stained cells were extracted by extraction buffer followed by spectrophotometer measurement at 560 nm.
5 Supplementary Figures:
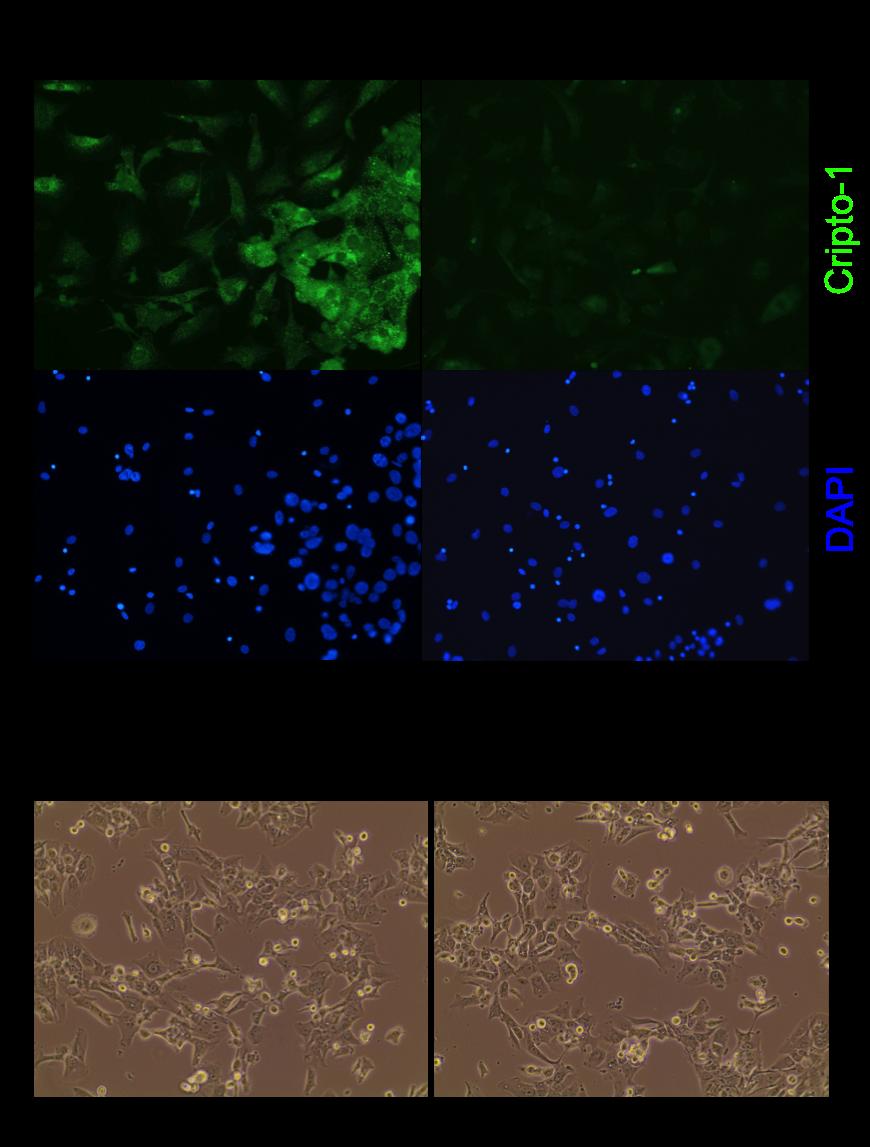
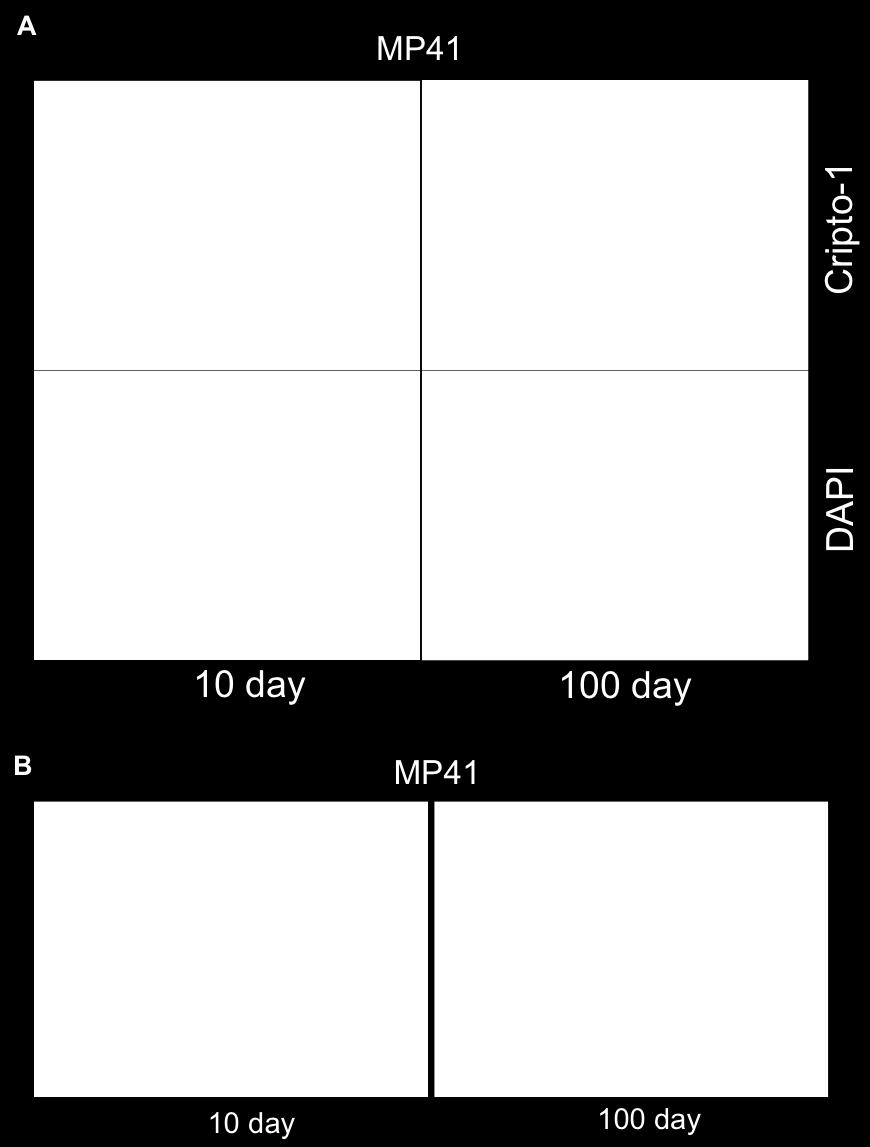
6 Supplementary Figure 1 (A) Cripto-1 immunochemistry of MP41 cells. Cripto-1 is expressed in the early passaged cells (day 10) and loss of Cripto-1 expression occurs in all cells, not just a subpopulation of the late passaged (day 100) MP41 cells. Cripto-1 was stained with Cripto-1 antibody (Rockland) and DNA by DAPI. Magnification: x200 (B) Cell morphology (phase contrast images) of early (10 day) and late (100 day) passaged MP41 cells. Magnification: x200


7 Supplementary Figure 2. Cripto-1 does not affect sensitivity of EGFR WT NSCLC cells to EGFR-TKIs. (A) Western blot analysis of Cripto-1 expression in Cripto-1 and Cripto-1 sirna transfected NSCLC cells. WT, wild-type. (B) Cripto-1 does not affect erlotinib and dacomitinib sensitivity of NSCLC cells harboring wild-type EGFR.
 Caspase 3/7 activity was measured in HCC827/Mock and HCC827/Cripto-1 cells in the presence or absence of erlotinib as indicated. RLU, Relative Luciferas e Unit.")
8 Supplementary Figure 3. Cripto-1 attenuates EGFR inhibitor-induced apoptosis. (A) Caspase 3/7 activity was measured in HCC827/Mock and HCC827/Cripto-1 cells in the presence or absence of erlotinib as indicated. RLU, Relative Luciferas e Unit. (B) Cell cycle analysis in erlotinib-treated HCC827/Mock and HCC827/ Cripto-1 cells by FACS.
9 Supplementary Figure 4. MTS assay on the effect of Cisplatin (A) and Taxol (B) in HCC827/Cripto-1 and H4006/Cripto-1 cells.
10
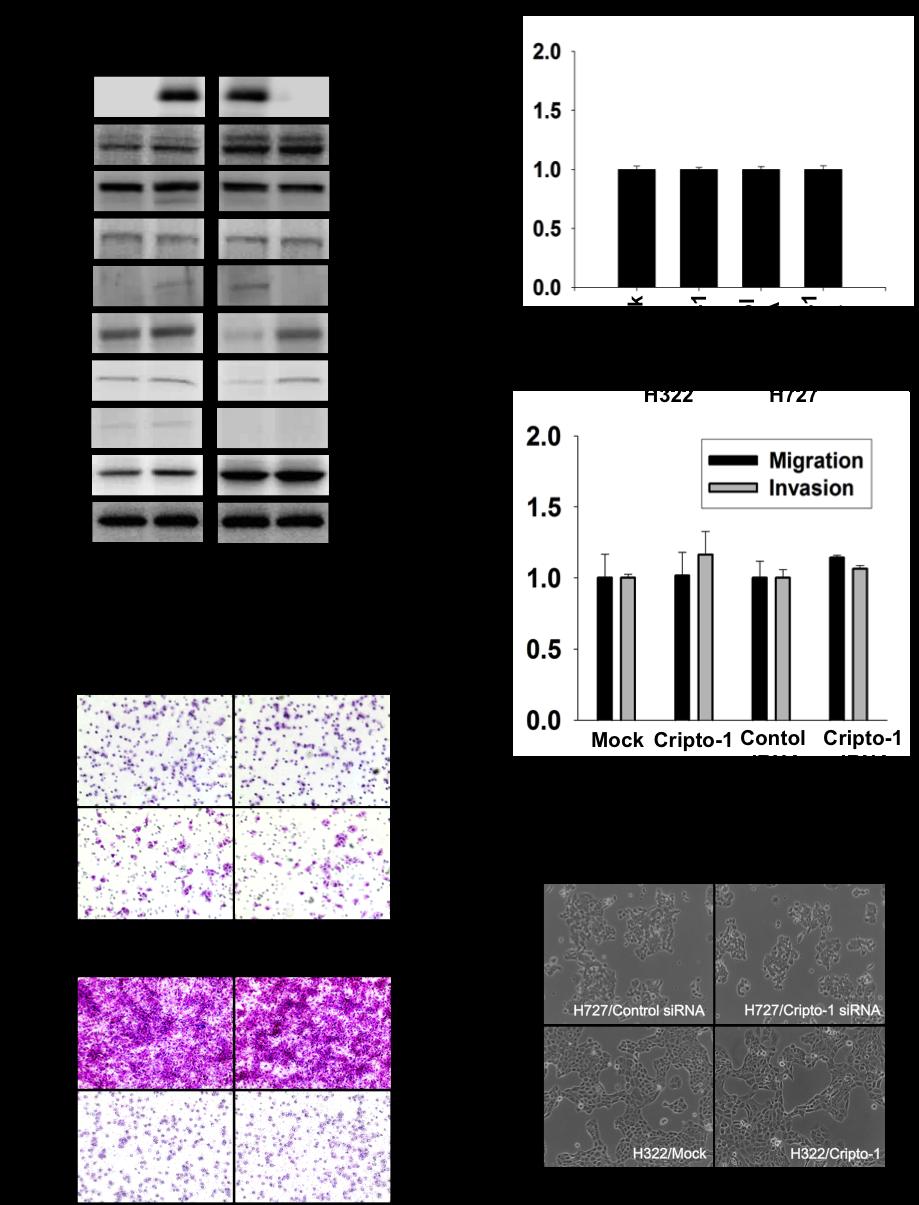
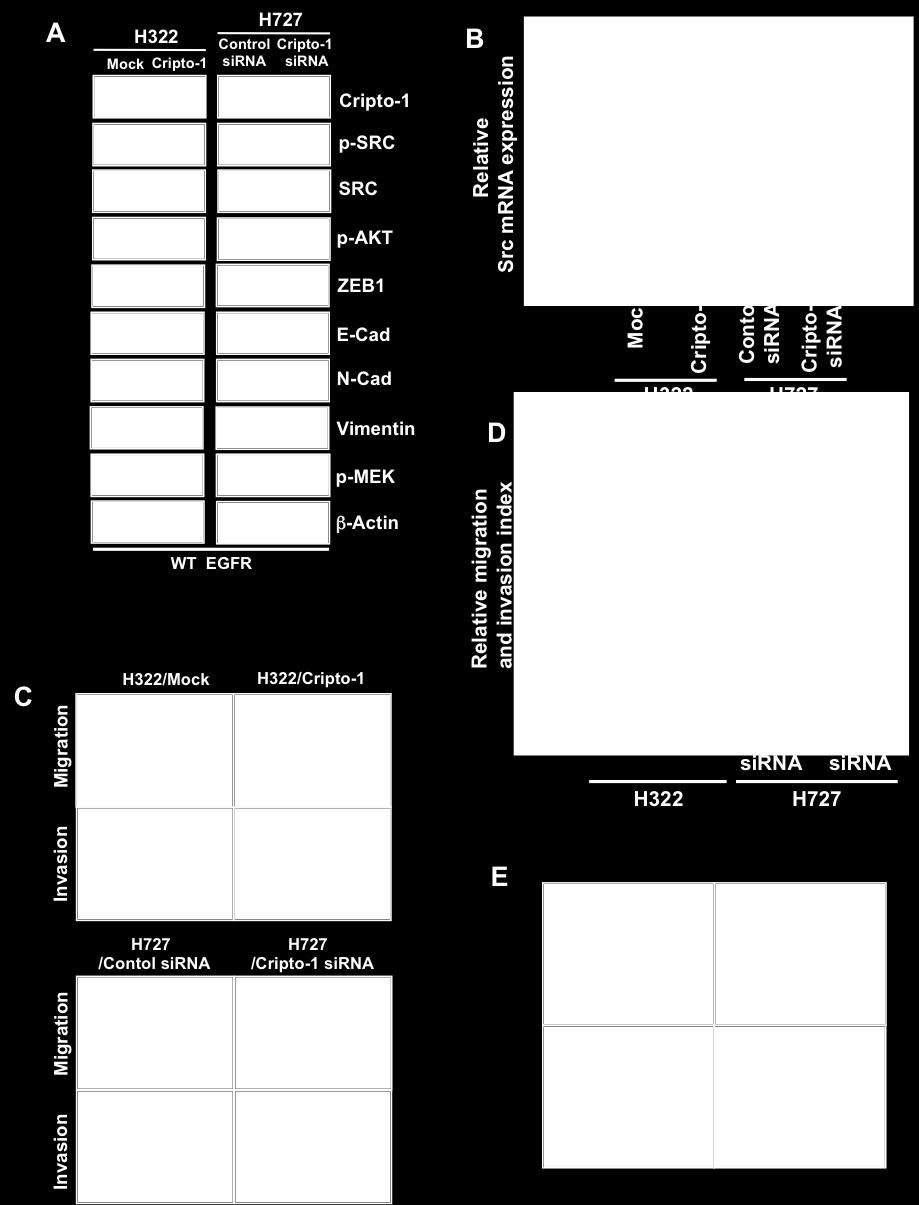
11 Supplementary Figure 5. Effect of Cripto-1 on SRC signaling and EMT. (A) Western blot analysis of both SRC and EMT signaling protein expression in EGFR WT NSCLC cell lines either stably-transfected with Cripto-1 or knockeddown by Cripto-1siRNA. Cripto-1 blot is the same with supplementary figure 2A. (B) The level of SRC mrna in Cripto-1 stably-transfected and sirna knockdown NSCLC cell lines by RT-PCR. (C and D) Cell migration and invasion were measured as described in Materials and Methods. Data are representative of three independent experiments. (E) Phase-contrast images of Cripto1- transfected and -knockdown NSCLC cell lines. Note no morphology changes in H727/Cripto-1 sirna and H322/Cripto-1 cells; Magnification, 200X.


12 Supplementary Figure 6. Cripto-1-induced EGFR-TKI resistance is not ZEB1- dependent. (A) Western blot analyses of ZEB1, Vimentin, N-Cadherin and psrc in HCC827/Cripto-1/ZEB1 shrna cells. (B) ZEB1 knockdown reversed the EMT phenotype but (C) failed to restore erlotinib sensitivity of HCC827/Cripto-1 cells. Magnification, 200X.
 SRC sirna reinstated erlotinib sensitivity of HCC827/Cripto-1 cells.")
 Synergistic effect of AZD0530 and erlotinib combination.")
13 Supplementary Figure 7. Cripto-1-induced EGFR-TKI resistance is SRC dependent. (A) Western blot analysis of HCC4006/Cripto-1 cells 72 hrs after SRC sirna transfection. β-actin was used as loading control. (B) SRC sirna reinstated erlotinib sensitivity of HCC827/Cripto-1 cells. Two days after transfection, the indicated cell lines were treated with erlortinib for 3 days, followed by MTS assay. Data represent triplicate experiments. (C) Synergistic effect of AZD0530 and erlotinib combination. MTS assays were performed in HCC827/Cripto-1 cells treated with 150 nm of erlotinib plus increasing concentrations of AZD0530 (15.625, 31.25, 62.5, 125, 250, 500 and 1000 nm) for 3 days. Fa, fraction affected; CI, combination index.
 secondary antibody alone, (B) Cripto-1 antibody (Rockland) and (C) Cripto-1 antibody blocked with recombinant human Cripto-1")
14 Supplementary Figure 8. Specificity of Cripto-1 antibody. Immunohistochemical staining of HCC827/Cripto-1 xenograft tumors with (A) secondary antibody alone, (B) Cripto-1 antibody (Rockland) and (C) Cripto-1 antibody blocked with recombinant human Cripto-1 protein (R&D systems). Cripto-1 immuno histochemical staining of (D) human normal lung tissue and (E) HCC827 xenograft tumors. (F) RT-PCR verification of Cripto-1 expression (bottom) on human NSCLC samples that express Cripto-1 protein at different levels (See Figure 6A and B) quantified by immunohistochemistry using Cripto-1 specific antibody (top). (G) Similar experiments to Figure S8F were performed by realtime PCR using different Cripto-1 specific primers. Note that the RNA was extracted from tumor cells (marked by a pathologist) scraped out of H&E-stained FFPE slides. Magnification, 400X
 Western blot analysis. Cripto-1 expression is not elevated in acquired erlotinib-resistant (ER) NSCLC cell lines.")
 plus increasing concentrations of AZD0530 (0.15625, 0.3125, 0.625, 1.25, 2.")
15 Supplementary Figure 9. AZD0530 and erlotinib combination elicits no synergy in acquired erlotinib-resistant NSCLC cells. (A) Western blot analysis. Cripto-1 expression is not elevated in acquired erlotinib-resistant (ER) NSCLC cell lines. (B and C) MTS assays were performed in acquired erlotinib-resistant cells treated with erlotinib at IC50 concentration (40 µm for HCC827ER and 20 µm for H4006ER) plus increasing concentrations of AZD0530 ( , , 0.625, 1.25, 2.5, 5 and 10 µm) for 3 days. CI, combination index.
16 Supplementary Table 1. IC50 of Cripto-1-overexpressed and Cripto-1 sirnatransfected NSCLC cell lines harboring mutant (A, related to Figure 2B) and wild (B, related to Supplementary Figure 2B) EGFR. MTS assays were performed 72hrs after erlotinib and dacomitinib (PF299804) treatment. Data represent means + SD of triplicate measurements relative to untreated cells. A Erlotinib PF Cell name (IC50) (IC50) EGFR HCC827/Mock 10 nm 2 nm Exon 19 del HCC827/Cripto-1 75 nm 20 nm H4006/Mock 50 nm 10 nm Exon 19 del H4006/Cripto nm 26.3 nm H3255/Mock 50 nm 1.5 nm L858R B Cell name Erlotinib (IC50) PF (IC50) EGFR H727/Control > 10uM 3.01 um WT sirna H727/Cripto-1 > 10 um 2.98 um sirna H322/Mock 5.15 um 5.51 um WT H322/Cripto um 5.62 um
17 Supplementary Table 2. Combination treatment index related to Figure 5D (A) and Supplementary Figure 7C (B). A No. Erlotinib (nm) AZD0530 (nm) Fa CI B No. Erlotinib (nm) AZD0530 (nm) Fa CI
18 Supplementary Table 3. Cripto-1 immunohistochemistry scores and patient characteristics. No. Status OS Smoking Stage Sex (months) history ECOG Performance status at Histology initiation of EGFR-TKI Previous chemother apies EGFR- TKI Response PFS to EGFR- (months) TKI Mutation IHC Score of Cripto-1 1 Dead 10.3 IV M Never 1 Ad 1 Gefitinib PD 1.9 Exon 19 del 3 2 Dead 10.8 IIIb M Never 1 Ad 2 Erlotinib PD 0.9 Exon 19 del 2 3 Dead 2.3 IV M Current 2 Ad 3 Erlotinib PD 1.1 Exon 19 del 3 4 Dead 11.9 IV M Former 0 Ad 1 Gefitinib SD 6.9 L858R 2 5 Dead 12.2 Recur rence M Current 1 Ad 2 Erlotinib SD 4 Exon 19 del 1 6 Dead 16 IV F Never 0 Ad 1 Gefitinib SD 4 L858R 1 7 Dead 13 IV M Never 1 Ad 1 Gefitinib PD 1 L858R 1 8 Alive Recur rence M Former 1 Ad 3 Erlotinib SD 10.5 L858R 0 9 Alive IV M Never 1 Ad 0 Erlotinib SD 7.4 L858R 1 10 Dead 64.4 IIIb F Never 1 Ad 1 Gefitinib PR 16.1 Exon 19 del 1 11 Dead 23.2 IV F Never 1 Ad 1 Gefitinib PR 10.9 L858R 1 12 Dead 17.7 IV F Never 0 Ad 1 Gefitinib PR 16.1 L858R 1 13 Alive IV M Former 1 Ad 4 Erlotinib PR 14 Exon 19 del 1 14 Dead 12.6 IV M Current 1 Ad 3 Gefitinib PR 7.6 Exon 19 del 2 15 Dead 11.1 IV F Never 1 Sq 0 Gefitinib PR 10.9 L858R 1 16 Dead 9 IV F Never 1 Ad 1 Gefitinib PR 5.8 Exon 19 del 1 17 Alive Recur rence F Never 0 Ad 0 Gefitinib PR 24.6 Exon 19 del 0 18 Dead 20 IV F Never 1 Ad 0 Gefitinib PR 10.3 Exon 19 del 0 19 Alive IV F Never 1 Ad 0 Gefitinib PR Exon 19 del 2 20 Alive IV F Never 1 Ad 1 Gefitinib PR 7.2 Exon 19 del 1 21 Dead 25.6 IV F Never 2 Ad 0 Gefitinib PR 20.4 L858R 0 22 Alive Recur rence F Never 1 Ad 0 Gefitinib PR 25.8 Exon 19 del 0 23 Dead 27.8 IV F Never 2 Ad 3 Erlotinib PR 11.1 L858R /T790M 0 24 Alive IV F Never 0 Ad 1 Erlotinib PR 10.1 Exon 19 del /T790M 0 25 Alive 9.8+ IV F Former 0 Ad 1 Erlotinib PR 9.8 Exon 19 del 0 26 Alive IV F Never 1 Ad 1 Erlotinib PR 10.2 L858R 1 27 Alive IV F Former 0 Ad 2 Erlotinib PR 50.9 L858R 0 28 Alive IV F Former 1 Ad 2 Erlotinib PR 13.2 Exon 19 del /T790M 2 29 Alive Recur rence F Never 1 Ad 1 Erlotinib PR 16.1 Exon 19 del 0 30 Alive IV M Former 0 Ad 0 Erlotinib PR Exon 19 del 0 31 Alive 23+ IV M Former Exon 19 del Ad 1 Erlotinib PR /T790M 0 32 Dead 2 IV M Never 1 BAC 0 Erlotinib PD 1 L858R 3 33 Alive 17+ IV M Never 2 Ad 0 Erlotinib PR 9 Exon 19 del 0 34 Dead 9 IV M Never 1 other 0 Erlotinib PD 1 Exon 19 del 3 35 Alive 13+ IV F Never 1 Ad 0 Erlotinib CR 13+ Exon 19 del 0 36 Alive 17+ IV F Never 0 BAC 1 Erlotinib SD 17+ Exon 19 del 2 37 Alive 11+ IV F Never 2 Ad 1 Erlotinib PR 11+ Exon 19 del 0 38 Alive 8+ IV F Never 1 Ad 0 Erlotinib CR 8+ Exon 19 del 0 39 Alive 15+ IV F Never L858R Ad 0 Erlotinib PR /T790M 0 40 Alive 12+ IV F Never Exon 19 del Ad 1 Erlotinib PR /T790M 0
19 (Table 2 Cont.) OS No. Status (months) Stage Sex Smoking history ECOG Performance status at initiation of EGFR-TKI Previous Histology chemother EGFR-TKI apies Respons e to EGFR- TKI PFS (months) Mutation 41 Alive 13+ IV M Former 1 BAC 0 Erlotinib PR 13+ Exon Alive 7+ IV M Current 2 Ad 0 Erlotinib PR 7+ L858R /T790M 0 43 Alive 10+ IV F Never 1 Ad 0 Erlotinib PR 10+ Exon Dead 9 IV F Former Exon 19 del Ad 1 Erlotinib PR /T790M 45 Alive 4+ IV M Never L858R Ad 1 Erlotinib PR 4+ 1 /T790M 0 46 Alive 8+ IV F Never 0 Ad 0 Erlotinib PR 8+ Exon 19 del 0 47 Dead 5 IV F Never 2 Ad 0 Erlotinib PR 5 Exon 19 del 0 48 Alive 7+ IV F Never 1 Ad 0 Erlotinib PR 7+ L858R 0 49 Alive 7+ IV F Current 1 Ad 0 Erlotinib PR 7+ Exon 19 del 0 50 Alive 11+ IV M Never 2 Ad 1 Erlotinib PR 8 L858R 0 51 Alive 47+ IV M Current 1 Ad 1 Gefitinib PD 1.1 Exon 19 del 2 52 Dead 44.3 IV F Never 1 Ad 1 Gefitinib SD 9.6 L858R 1 53 Dead 19.2 IV M Never 1 Ad 1 Gefitinib SD 3.5 L858R 2 54 Alive IV F Never 1 Ad 1 Gefitinib SD 27.7 L858R 2 55 Alive 7+ IV F Never 1 Ad 1 Gefitinib +Erlotinib PD 3.8 L858R 3 56 Alive 43+ IV M Never 1 Ad 1 Gefitinib PR 18.4 G719C 0 57 Dead 30 IV M Former 1 Ad 0 Gefitinib CR 11.8 Exon 19 del 0 58 Dead 16.5 IV M Never 1 Ad 0 Gefitinib PR 3.9 Exon 19 del 0 59 Dead 21.1 IV M Current 1 Ad 0 Gefitinib PR 1.6 G Dead 6 IV F Never 1 other 0 Gefitinib PR 2 Exon 19 del 2 61 Dead 40.3 IV F Current 1 Ad 0 Gefitinib PR 38.2 L858R 0 62 Alive 7.8+ IV M Current 1 Ad 0 Gefitinib SD 2.5 Exon 19 del 1 63 Alive 4+ IV M Current 1 Ad 1 Gefitinib SD 4.2 Exon 19 del 1 64 Alive 13+ IV F Current 1 Ad 1 Gefitinib PR 11.1 Exon 19 del 0 65 Alive 124+ IV F Never 0 Ad 0 Gefitinib SD 64.6 Exon 19 del 2 66 Dead 89.2 IIIA M Smoker 1 Ad 0 Gefitinib SD 14.9 Exon 19 del 3 67 Dead 71.5 IIIA M Smoker 0 Ad 0 Gefitinib SD 14.8 Exon 19 del 2 68 Dead 65.9 IIIA M Never 3 Ad 2 Gefitinib PD 2.7 L858R 2 69 Dead 62 IV F Never 1 Ad 1 Gefitinib PR 32.8 Exon 19 del 0 70 Dead 44.8 IIA F Never 1 Ad 2 Gefitinib PR 5 Exon 19 del 0 71 Dead 82.8 IA F Never 1 Ad 0 Gefitinib PR 18.8 Exon 19 del 0 72 Dead 80.2 IB F Smoker 1 Ad 2 Gefitinib PR 4.8 Exon 19 del 0 73 Dead 84.4 IIIA F Never 1 Ad 0 Gefitinib PR 8.8 Exon 19 del 0 74 Dead 38 IIIA F Never 0 Ad 0 Gefitinib CR 9.9 L858R 0 75 Dead 69.2 IIB F Never 0 Ad 0 Gefitinib PR 5.9 L858R 0 76 Dead 18.8 IIIB M Smoker 2 AdSq 1 Gefitinib PR 8.6 Exon 19 del 0 77 Dead 57.7 IIB M Never 0 Ad 0 Gefitinib PR 25.5 G719C 0 78 Dead 53.7 IIIA M Smoker 1 Ad 0 Gefitinib CR 12.1 Exon 19 del 0 79 Dead 64.3 IIIA M Never 0 Ad 0 Gefitinib PR 3.8 Exon 19 del 0 80 Dead 20.8 IIIB M Smoker 0 Ad 0 Gefitinib PR 1.6 G Dead 6.2 IIIB F Never 2 Ad 0 Gefitinib PR 1.9 Exon 19 del 0 82 Dead 14.3 IIIA F Smoker 1 Ad 2 Gefitinib PR 10.9 Exon 19 del 0 83 Alive 42+ IV M Former 1 Ad 1 Erlotinib PR 18 Exon 19 del 0 84 Dead 9 IV F Former 2 Ad 0 Erlotinib PD 6 G719S 3 85 Alive 4+ IIIb F Never 0 Ad 0 Gefitinib PD 2 Exon 19 del 2 OS = Overall survival Stage: Recurrence = recurrence after surgical resection with or without adjuvant chemotherapy Sex: M = male; F = female Histology: Ad = adenocarcinoma; Sq = Squamous carcinoma; BAC = bronchoalveolar carcinoma Response: PD = progressive disease; SD = stable disease; PR = partial response; CR = complete response PFS = Progression-free survival IHC Score of Cripto-1
20 Supplementary Table 4. Combination treatment index related to HCC827ER (A) H4006ER (B) cells in Supplementary Figure 9B and 9C. Fa, fraction affected; CI, combination index. A No. Erlotinib (um) AZD0530 (um) Fa CI B No. Erlotinib (um) AZD0530 (um) Fa CI
HEK293FT cells were transiently transfected with reporters, N3-ICD construct and
 Supplementary Information Luciferase reporter assay HEK293FT cells were transiently transfected with reporters, N3-ICD construct and increased amounts of wild type or kinase inactive EGFR. Transfections
HCC1937 is the HCC1937-pcDNA3 cell line, which was derived from a breast cancer with a mutation
 SUPPLEMENTARY INFORMATION Materials and Methods Human cell lines and culture conditions HCC1937 is the HCC1937-pcDNA3 cell line, which was derived from a breast cancer with a mutation in exon 20 of BRCA1
MicroRNA sponges: competitive inhibitors of small RNAs in mammalian cells
 MicroRNA sponges: competitive inhibitors of small RNAs in mammalian cells Margaret S Ebert, Joel R Neilson & Phillip A Sharp Supplementary figures and text: Supplementary Figure 1. Effect of sponges on
(A) PCR primers (arrows) designed to distinguish wild type (P1+P2), targeted (P1+P2) and excised (P1+P3)14-
 PCR primers (arrows) designed to distinguish wild type (P1+P2), targeted (P1+P2) and excised (P1+P3)14-") 1 Supplemental Figure Legends Figure S1. Mammary tumors of ErbB2 KI mice with 14-3-3σ ablation have elevated ErbB2 transcript levels and cell proliferation (A) PCR primers (arrows) designed to distinguish
1 Supplemental Figure Legends Figure S1. Mammary tumors of ErbB2 KI mice with 14-3-3σ ablation have elevated ErbB2 transcript levels and cell proliferation (A) PCR primers (arrows) designed to distinguish
SUPPLEMENT. Materials and methods
 SUPPLEMENT Materials and methods Cell culture and reagents Cell media and reagents were from Invitrogen unless otherwise indicated. Antibiotics and Tet-certified serum were from Clontech. In experiments
Supplementary data Supplementary Figure 1 Supplementary Figure 2
 Supplementary data Supplementary Figure 1 SPHK1 sirna increases RANKL-induced osteoclastogenesis in RAW264.7 cell culture. (A) RAW264.7 cells were transfected with oligocassettes containing SPHK1 sirna
(A) RT-PCR for components of the Shh/Gli pathway in normal fetus cell (MRC-5) and a
 RT-PCR for components of the Shh/Gli pathway in normal fetus cell (MRC-5) and a") Supplementary figure legends Supplementary Figure 1. Expression of Shh signaling components in a panel of gastric cancer. (A) RT-PCR for components of the Shh/Gli pathway in normal fetus cell (MRC-5) and
Supplementary figure legends Supplementary Figure 1. Expression of Shh signaling components in a panel of gastric cancer. (A) RT-PCR for components of the Shh/Gli pathway in normal fetus cell (MRC-5) and
Supplementary Data Table of Contents:
 Supplementary Data Table of Contents: - Supplementary Methods - Supplementary Figures S1(A-B) - Supplementary Figures S2 (A-B) - Supplementary Figures S3 - Supplementary Figures S4(A-B) - Supplementary
RNA extraction, RT-PCR and real-time PCR. Total RNA were extracted using
 Supplementary Information Materials and Methods RNA extraction, RT-PCR and real-time PCR. Total RNA were extracted using Trizol reagent (Invitrogen,Carlsbad, CA) according to the manufacturer's instructions.
MTC-TT and TPC-1 cell lines were cultured in RPMI medium (Gibco, Breda, The Netherlands)
") Supplemental data Materials and Methods Cell culture MTC-TT and TPC-1 cell lines were cultured in RPMI medium (Gibco, Breda, The Netherlands) supplemented with 15% or 10% (for TPC-1) fetal bovine serum
Supplemental data Materials and Methods Cell culture MTC-TT and TPC-1 cell lines were cultured in RPMI medium (Gibco, Breda, The Netherlands) supplemented with 15% or 10% (for TPC-1) fetal bovine serum
Supplementary Materials and Methods
 Supplementary Materials and Methods Reagents and antibodies was purchased from iaffin GmbH & Co KG. Cisplatin (ristol-myers Squibb Co.) and etoposide (Sandoz Pharma Ltd.) were used. Antibodies recognizing
Islet viability assay and Glucose Stimulated Insulin Secretion assay RT-PCR and Western Blot
 Islet viability assay and Glucose Stimulated Insulin Secretion assay Islet cell viability was determined by colorimetric (3-(4,5-dimethylthiazol-2-yl)-2,5- diphenyltetrazolium bromide assay using CellTiter
Supplementary material for the manuscript
 Supplementary material for the manuscript Title: CD200-positive cancer associated fibroblasts augment the sensitivity of Epidermal Growth Factor Receptor mutation-positive lung adenocarcinomas to EGFR
SUPPLEMENTARY INFORMATION. Supplementary Figures S1-S9. Supplementary Methods
 SUPPLEMENTARY INFORMATION SUMO1 modification of PTEN regulates tumorigenesis by controlling its association with the plasma membrane Jian Huang 1,2#, Jie Yan 1,2#, Jian Zhang 3#, Shiguo Zhu 1, Yanli Wang
Supplementary Figures
 Supplementary Figures Supplementary Figure 1 DOT1L regulates the expression of epithelial and mesenchymal markers. (a) The expression levels and cellular localizations of EMT markers were confirmed by
Supplementary Figure 1. Basal level EGFR across a panel of ESCC lines. Immunoblots demonstrate the expression of phosphorylated and total EGFR as
 Supplementary Figure 1. Basal level EGFR across a panel of ESCC lines. Immunoblots demonstrate the expression of phosphorylated and total EGFR as well as their downstream effectors across a panel of ESCC
Supplementary Information
 Supplementary Information Supplementary Figure 1. CD4 + T cell activation and lack of apoptosis after crosslinking with anti-cd3 + anti-cd28 + anti-cd160. (a) Flow cytometry of anti-cd160 (5D.10A11) binding
mtor Inhibition Specifically Sensitizes Colorectal Cancers with KRAS or BRAF Mutations to BCL-2/BCL-
 Supplementary Material for mtor Inhibition Specifically Sensitizes Colorectal Cancers with KRAS or BRAF Mutations to BCL-2/BCL- XL Inhibition by Suppressing MCL-1 Anthony C. Faber 1,2 *, Erin M. Coffee
Supplemental Table S1
 Supplemental Table S. Tumorigenicity and metastatic potential of 44SQ cell subpopulations a Tumorigenicity b Average tumor volume (mm ) c Lung metastasis d CD high /4 8. 8/ CD low /4 6./ a Mice were injected
Impact of hyper-o-glcnacylation on apoptosis and NF-κB activity SUPPLEMENTARY METHODS
 SUPPLEMENTARY METHODS 3D culture and cell proliferation- MiaPaCa-2 cell culture in 3D was performed as described previously (1). Briefly, 8-well glass chamber slides were evenly coated with 50 µl/well
Online Data Supplement. Anti-aging Gene Klotho Enhances Glucose-induced Insulin Secretion by Upregulating Plasma Membrane Retention of TRPV2
 Online Data Supplement Anti-aging Gene Klotho Enhances Glucose-induced Insulin Secretion by Upregulating Plasma Membrane Retention of TRPV2 Yi Lin and Zhongjie Sun Department of physiology, college of
Erzsebet Kokovay, Susan Goderie, Yue Wang, Steve Lotz, Gang Lin, Yu Sun, Badrinath Roysam, Qin Shen,
 Cell Stem Cell, Volume 7 Supplemental Information Adult SVZ Lineage Cells Home to and Leave the Vascular Niche via Differential Responses to SDF1/CXCR4 Signaling Erzsebet Kokovay, Susan Goderie, Yue Wang,
SUPPLEMENTARY INFORMATION
 SUPPLEMENTARY INFORMATION FOR Liver X Receptor α mediates hepatic triglyceride accumulation through upregulation of G0/G1 Switch Gene 2 (G0S2) expression I: SUPPLEMENTARY METHODS II: SUPPLEMENTARY FIGURES
Supplementary Information Titles Journal: Nature Medicine
 Supplementary Information Titles Journal: Nature Medicine Article Title: Corresponding Author: Supplementary Item & Number Supplementary Fig.1 Fig.2 Fig.3 Fig.4 Fig.5 Fig.6 Fig.7 Fig.8 Fig.9 Fig. Fig.11
p47 negatively regulates IKK activation by inducing the lysosomal degradation of polyubiquitinated NEMO
 Supplementary Information p47 negatively regulates IKK activation by inducing the lysosomal degradation of polyubiquitinated NEMO Yuri Shibata, Masaaki Oyama, Hiroko Kozuka-Hata, Xiao Han, Yuetsu Tanaka,
Supplementary Figure 1: si-craf but not si-braf sensitizes tumor cells to radiation.
 Supplementary Figure 1: si-craf but not si-braf sensitizes tumor cells to radiation. (a) Embryonic fibroblasts isolated from wildtype (WT), BRAF -/-, or CRAF -/- mice were irradiated (6 Gy) and DNA damage
Supplementary Figure 1
 A B D Relative TAp73 mrna p73 Supplementary Figure 1 25 2 15 1 5 p63 _-tub. MDA-468 HCC1143 HCC38 SUM149 MDA-468 HCC1143 HCC38 SUM149 HCC-1937 MDA-MB-468 ΔNp63_ TAp73_ TAp73β E C Relative ΔNp63 mrna TAp73
Supplementary Information and Figure legends
 Supplementary Information and Figure legends Table S1. Primers for quantitative RT-PCR Target Sequence (5 -> 3 ) Target Sequence (5 -> 3 ) DAB2IP F:TGGACGATGTGCTCTATGCC R:GGATGGTGATGGTTTGGTAG Snail F:CCTCCCTGTCAGATGAGGAC
(a) Significant biological processes (upper panel) and disease biomarkers (lower panel)
 Significant biological processes (upper panel) and disease biomarkers (lower panel)") Supplementary Figure 1. Functional enrichment analyses of secretomic proteins. (a) Significant biological processes (upper panel) and disease biomarkers (lower panel) 2 involved by hrab37-mediated secretory
Supplementary Figure 1. Functional enrichment analyses of secretomic proteins. (a) Significant biological processes (upper panel) and disease biomarkers (lower panel) 2 involved by hrab37-mediated secretory
(a) Schematic diagram of the FS mutation of UVRAG in exon 8 containing the highly instable
 Schematic diagram of the FS mutation of UVRAG in exon 8 containing the highly instable") Supplementary Figure 1. Frameshift (FS) mutation in UVRAG. (a) Schematic diagram of the FS mutation of UVRAG in exon 8 containing the highly instable A 10 DNA repeat, generating a premature stop codon
Supplementary Figure 1. Frameshift (FS) mutation in UVRAG. (a) Schematic diagram of the FS mutation of UVRAG in exon 8 containing the highly instable A 10 DNA repeat, generating a premature stop codon
FOXO Reporter Kit PI3K/AKT Pathway Cat. #60643
 Data Sheet FOXO Reporter Kit PI3K/AKT Pathway Cat. #60643 Background The PI3K/AKT signaling pathway is essential for cell growth and survival. Disruption of this pathway or its regulation has been linked
Supplementary Figure 1. HOPX is hypermethylated in NPC. (a) Methylation levels of HOPX in Normal (n = 24) and NPC (n = 24) tissues from the
 Methylation levels of HOPX in Normal (n = 24) and NPC (n = 24) tissues from the") Supplementary Figure 1. HOPX is hypermethylated in NPC. (a) Methylation levels of HOPX in Normal (n = 24) and NPC (n = 24) tissues from the genome-wide methylation microarray data. Mean ± s.d.; Student
Supplementary Figure 1. HOPX is hypermethylated in NPC. (a) Methylation levels of HOPX in Normal (n = 24) and NPC (n = 24) tissues from the genome-wide methylation microarray data. Mean ± s.d.; Student
Supplementary Materials and Methods
 Supplementary Materials and Methods Immunoblotting Immunoblot analysis was performed as described previously (1). Due to high-molecular weight of MUC4 (~ 950 kda) and MUC1 (~ 250 kda) proteins, electrophoresis
Supporting Information
 Supporting Information Bertolini et al. 10.1073/pnas.0905653106 SI Text Lung Tissue Disaggregation. Solid tissues were finely minced by razorblade, washed in DMEM/F12 (Lonza), and then incubated with Accumax
Nature Neuroscience: doi: /nn Supplementary Figure 1
 Supplementary Figure 1 EGFR inhibition activates signaling pathways (a-b) EGFR inhibition activates signaling pathways (a) U251EGFR cells were treated with erlotinib (1µM) for the indicated times followed
An epithelial-to-mesenchymal transition-inducing potential of. granulocyte macrophage colony-stimulating factor in colon. cancer
 An epithelial-to-mesenchymal transition-inducing potential of granulocyte macrophage colony-stimulating factor in colon cancer Yaqiong Chen, Zhi Zhao, Yu Chen, Zhonglin Lv, Xin Ding, Renxi Wang, He Xiao,
Type of file: PDF Size of file: 0 KB Title of file for HTML: Supplementary Information Description: Supplementary Figures
 Type of file: PDF Size of file: 0 KB Title of file for HTML: Supplementary Information Description: Supplementary Figures Supplementary Figure 1 mir-128-3p is highly expressed in chemoresistant, metastatic
Supplementary Information
 Supplementary Information Supplementary Figure 1. Effect of mir mimics and anti-mirs on DTPs a, Representative fluorescence microscopy images of GFP vector control or mir mimicexpressing parental and DTP
Supplementary Figure 1. a. b. Relative cell viability. Nature Genetics: doi: /ng SCR shyap1-1 shyap
 Supplementary Figure 1. a. b. p-value for depletion in vehicle (DMSO) 1e-05 1e-03 1e-01 1 0 1000 2000 3000 4000 5000 Genes log2 normalized shrna counts in T0 0 2 4 6 8 sh1 shluc 0 2 4 6 8 log2 normalized
EGFR shrna A: CCGGCGCAAGTGTAAGAAGTGCGAACTCGAGTTCGCACTTCTTACACTTGCG TTTTTG. EGFR shrna B: CCGGAGAATGTGGAATACCTAAGGCTCGAGCCTTAGGTATTCCACATTCTCTT TTTG
 Supplementary Methods Sequence of oligonucleotides used for shrna targeting EGFR EGFR shrna were obtained from the Harvard RNAi consortium. The following oligonucleotides (forward primer) were used to
Department of Pharmaceutical Sciences, School of Pharmacy, Northeastern University, Boston, MA 02115, USA 2
 Pancreatic Cancer Cell Exosome-Mediated Macrophage Reprogramming and the Role of MicroRNAs 155 and 125b2 Transfection using Nanoparticle Delivery Systems Mei-Ju Su 1, Hibah Aldawsari 2, and Mansoor Amiji
Thoracic and head/neck oncology new developments
 Thoracic and head/neck oncology new developments Goh Boon Cher Department of Hematology-Oncology National University Cancer Institute of Singapore Research Clinical Care Education Scope Lung cancer Screening
Supplementary Figure 1. Characterization of NMuMG-ErbB2 and NIC breast cancer cells expressing shrnas targeting LPP. NMuMG-ErbB2 cells (a) and NIC
 and NIC") Supplementary Figure 1. Characterization of NMuMG-ErbB2 and NIC breast cancer cells expressing shrnas targeting LPP. NMuMG-ErbB2 cells (a) and NIC cells (b) were engineered to stably express either a LucA-shRNA
Supplementary Figure 1. Characterization of NMuMG-ErbB2 and NIC breast cancer cells expressing shrnas targeting LPP. NMuMG-ErbB2 cells (a) and NIC cells (b) were engineered to stably express either a LucA-shRNA
Soft Agar Assay. For each cell pool, 100,000 cells were resuspended in 0.35% (w/v)
") SUPPLEMENTARY MATERIAL AND METHODS Soft Agar Assay. For each cell pool, 100,000 cells were resuspended in 0.35% (w/v) top agar (LONZA, SeaKem LE Agarose cat.5004) and plated onto 0.5% (w/v) basal agar.
SUPPLEMENTARY MATERIAL AND METHODS Soft Agar Assay. For each cell pool, 100,000 cells were resuspended in 0.35% (w/v) top agar (LONZA, SeaKem LE Agarose cat.5004) and plated onto 0.5% (w/v) basal agar.
Graveley Lab shrna knockdown followed by RNA-seq Biosample Preparation and Characterization Document
 Graveley Lab shrna knockdown followed by RNA-seq Biosample Preparation and Characterization Document Wet Lab: Sara Olson and Lijun Zhan Computational Lab: Xintao Wei and Michael Duff PI: Brenton Graveley
Supplementary Information Supplementary Fig. 1. Elevated Usp9x in melanoma and NRAS mutant melanoma cells are dependent on NRAS for 3D growth.
 Supplementary Information Supplementary Fig. 1. Elevated Usp9x in melanoma and NRAS mutant melanoma cells are dependent on NRAS for 3D growth. a. Immunoblot for Usp9x protein in NRAS mutant melanoma cells
Figure S1. ERBB3 mrna levels are elevated in Luminal A breast cancers harboring ERBB3
 Supplemental Figure Legends. Figure S1. ERBB3 mrna levels are elevated in Luminal A breast cancers harboring ERBB3 ErbB3 gene copy number gain. Supplemental Figure S1. ERBB3 mrna levels are elevated in
Supplementary Figure S1. Venn diagram analysis of mrna microarray data and mirna target analysis. (a) Western blot analysis of T lymphoblasts (CLS)
 Western blot analysis of T lymphoblasts (CLS)") Supplementary Figure S1. Venn diagram analysis of mrna microarray data and mirna target analysis. (a) Western blot analysis of T lymphoblasts (CLS) and their exosomes (EXO) in resting (REST) and activated
Supplementary Figure S1. Venn diagram analysis of mrna microarray data and mirna target analysis. (a) Western blot analysis of T lymphoblasts (CLS) and their exosomes (EXO) in resting (REST) and activated
mir-509-5p and mir-1243 increase the sensitivity to gemcitabine by inhibiting
 mir-509-5p and mir-1243 increase the sensitivity to gemcitabine by inhibiting epithelial-mesenchymal transition in pancreatic cancer Hidekazu Hiramoto, M.D. 1,3, Tomoki Muramatsu, Ph.D. 1, Daisuke Ichikawa,
File Name: Supplementary Information Description: Supplementary Figures and Supplementary Tables. File Name: Peer Review File Description:
 File Name: Supplementary Information Description: Supplementary Figures and Supplementary Tables File Name: Peer Review File Description: Primer Name Sequence (5'-3') AT ( C) RT-PCR USP21 F 5'-TTCCCATGGCTCCTTCCACATGAT-3'
Construction of a hepatocellular carcinoma cell line that stably expresses stathmin with a Ser25 phosphorylation site mutation
 Construction of a hepatocellular carcinoma cell line that stably expresses stathmin with a Ser25 phosphorylation site mutation J. Du 1, Z.H. Tao 2, J. Li 2, Y.K. Liu 3 and L. Gan 2 1 Department of Chemistry,
microrna-200b and microrna-200c promote colorectal cancer cell proliferation via
 Supplementary Materials microrna-200b and microrna-200c promote colorectal cancer cell proliferation via targeting the reversion-inducing cysteine-rich protein with Kazal motifs Supplementary Table 1.
TFEB-mediated increase in peripheral lysosomes regulates. Store Operated Calcium Entry
 TFEB-mediated increase in peripheral lysosomes regulates Store Operated Calcium Entry Luigi Sbano, Massimo Bonora, Saverio Marchi, Federica Baldassari, Diego L. Medina, Andrea Ballabio, Carlotta Giorgi
Cell isolation. Spleen and lymph nodes (axillary, inguinal) were removed from mice
 were removed from mice") Supplementary Methods: Cell isolation. Spleen and lymph nodes (axillary, inguinal) were removed from mice and gently meshed in DMEM containing 10% FBS to prepare for single cell suspensions. CD4 + CD25
Supplementary Methods: Cell isolation. Spleen and lymph nodes (axillary, inguinal) were removed from mice and gently meshed in DMEM containing 10% FBS to prepare for single cell suspensions. CD4 + CD25
Graveley Lab shrna knockdown followed by RNA-seq Biosample Preparation and Characterization Document
 Graveley Lab shrna knockdown followed by RNA-seq Biosample Preparation and Characterization Document Wet Lab: Sara Olson and Lijun Zhan Computational Lab: Xintao Wei and Michael Duff PI: Brenton Graveley
m 6 A mrna methylation regulates AKT activity to promote the proliferation and tumorigenicity of endometrial cancer
 SUPPLEMENTARY INFORMATION Articles https://doi.org/10.1038/s41556-018-0174-4 In the format provided by the authors and unedited. m 6 A mrna methylation regulates AKT activity to promote the proliferation
HIV-1 Virus-like Particle Budding Assay Nathan H Vande Burgt, Luis J Cocka * and Paul Bates
 HIV-1 Virus-like Particle Budding Assay Nathan H Vande Burgt, Luis J Cocka * and Paul Bates Department of Microbiology, Perelman School of Medicine at the University of Pennsylvania, Philadelphia, USA
SUPPLEMENTARY INFORMATION
 SUPPLEMENTARY INFORMATION doi:1.138/nature9814 a A SHARPIN FL B SHARPIN ΔNZF C SHARPIN T38L, F39V b His-SHARPIN FL -1xUb -2xUb -4xUb α-his c Linear 4xUb -SHARPIN FL -SHARPIN TF_LV -SHARPINΔNZF -SHARPIN
Supplementary Figure 1.TRIM33 binds β-catenin in the nucleus. a & b, Co-IP of endogenous TRIM33 with β-catenin in HT-29 cells (a) and HEK 293T cells
 and HEK 293T cells") Supplementary Figure 1.TRIM33 binds β-catenin in the nucleus. a & b, Co-IP of endogenous TRIM33 with β-catenin in HT-29 cells (a) and HEK 293T cells (b). TRIM33 was immunoprecipitated, and the amount of
Supplementary Figure 1.TRIM33 binds β-catenin in the nucleus. a & b, Co-IP of endogenous TRIM33 with β-catenin in HT-29 cells (a) and HEK 293T cells (b). TRIM33 was immunoprecipitated, and the amount of
Supplementary Information POLO-LIKE KINASE 1 FACILITATES LOSS OF PTEN-INDUCED PROSTATE CANCER FORMATION
 Supplementary Information POLO-LIKE KINASE 1 FACILITATES LOSS OF PTEN-INDUCED PROSTATE CANCER FORMATION X. Shawn Liu 1, 3, Bing Song 2, 3, Bennett D. Elzey 3, 4, Timothy L. Ratliff 3, 4, Stephen F. Konieczny
Supplemental information
 Carcinoemryonic antigen-related cell adhesion molecule 6 (CEACAM6) promotes EGF receptor signaling of oral squamous cell carcinoma metastasis via the complex N-glycosylation y Chiang et al. Supplemental
Data Sheet TIGIT / NFAT Reporter - Jurkat Cell Line Catalog #60538
 Data Sheet TIGIT / NFAT Reporter - Jurkat Cell Line Catalog #60538 Background: TIGIT is a co-inhibitory receptor that is highly expressed in Natural Killer (NK) cells, activated CD4+, CD8+ and regulatory
2,6,9-Triazabicyclo[3.3.1]nonanes as overlooked. amino-modification products by acrolein
![2,6,9-Triazabicyclo[3.3.1]nonanes as overlooked. amino-modification products by acrolein](/thumbs/86/94743397.jpg "2,6,9-Triazabicyclo[3.3.1]nonanes as overlooked. amino-modification products by acrolein") Supplementary Information 2,6,9-Triazabicyclo[3.3.1]nonanes as overlooked amino-modification products by acrolein Ayumi Tsutsui and Katsunori Tanaka* Biofunctional Synthetic Chemistry Laboratory, RIKEN
Supplementary Information 2,6,9-Triazabicyclo[3.3.1]nonanes as overlooked amino-modification products by acrolein Ayumi Tsutsui and Katsunori Tanaka* Biofunctional Synthetic Chemistry Laboratory, RIKEN
Supplementary Methods: IGFBP7 Drives Resistance to Epidermal Growth Factor Receptor Tyrosine Kinase Inhibition in Lung Cancer
 S1 of S6 Supplementary Methods: IGFBP7 Drives Resistance to Epidermal Growth Factor Receptor Tyrosine Kinase Inhibition in Lung Cancer Shang-Gin Wu, Tzu-Hua Chang, Meng-Feng Tsai, Yi-Nan Liu, Chia-Lang
SUPPLEMENTARY FIGURES AND TABLES
 SUPPLEMENTARY FIGURES AND TABLES Supplementary Figure S1: CaSR expression in neuroblastoma models. A. Proteins were isolated from three neuroblastoma cell lines and from the liver metastasis of a MYCN-non
Effect of Survivin-siRNA on Drug Sensitivity of Osteosarcoma Cell Line MG-63
 68 Chin J Cancer Res 22(1):68-72, 2010 www.springerlink.com Original Article Effect of Survivin-siRNA on Drug Sensitivity of Osteosarcoma Cell Line MG-63 Jing-Wei Wang 1, Yi Liu 2, Hai-mei Tian 2, Wei
General Laboratory methods Plasma analysis: Gene Expression Analysis: Immunoblot analysis: Immunohistochemistry:
 General Laboratory methods Plasma analysis: Plasma insulin (Mercodia, Sweden), leptin (duoset, R&D Systems Europe, Abingdon, United Kingdom), IL-6, TNFα and adiponectin levels (Quantikine kits, R&D Systems
Supplementary Figure 1. The CagA-dependent wound healing or transwell migration of gastric cancer cell. AGS cells transfected with vector control or
 Supplementary Figure 1. The CagA-dependent wound healing or transwell migration of gastric cancer cell. AGS cells transfected with vector control or 3xflag-CagA expression vector were wounded using a pipette
Supplementary Figure (OH) 22 nanoparticles did not affect cell viability and apoposis. MDA-MB-231, MCF-7, MCF-10A and BT549 cells were
 22 nanoparticles did not affect cell viability and apoposis. MDA-MB-231, MCF-7, MCF-10A and BT549 cells were") Supplementary Figure 1. Gd@C 82 (OH) 22 nanoparticles did not affect cell viability and apoposis. MDA-MB-231, MCF-7, MCF-10A and BT549 cells were treated with PBS, Gd@C 82 (OH) 22, C 60 (OH) 22 or GdCl
Supplementary Figure 1. Gd@C 82 (OH) 22 nanoparticles did not affect cell viability and apoposis. MDA-MB-231, MCF-7, MCF-10A and BT549 cells were treated with PBS, Gd@C 82 (OH) 22, C 60 (OH) 22 or GdCl
Inhibition of TGFβ enhances chemotherapy action against triple negative breast cancer by abrogation of
 SUPPLEMENTAL DATA Inhibition of TGFβ enhances chemotherapy action against triple negative breast cancer by abrogation of cancer stem cells and interleukin-8 Neil E. Bhola 1, Justin M. Balko 1, Teresa C.
SUPPLEMENTAL EXPERIMENTAL PROCEDURES
 SUPPLEMENTAL EXPERIMENTAL PROCEDURES Crystal violet assay Cells were seeded in 24-well plates and cultured in media supplemented with % FBS for 7 days. Media were then removed, plates were briefly washed
Protocol for Gene Transfection & Western Blotting
 The schedule and the manual of basic techniques for cell culture Advanced Protocol for Gene Transfection & Western Blotting Schedule Day 1 26/07/2008 Transfection Day 3 28/07/2008 Cell lysis Immunoprecipitation
The Schedule and the Manual of Basic Techniques for Cell Culture
 The Schedule and the Manual of Basic Techniques for Cell Culture 1 Materials Calcium Phosphate Transfection Kit: Invitrogen Cat.No.K2780-01 Falcon tube (Cat No.35-2054:12 x 75 mm, 5 ml tube) Cell: 293
Supplementary Figure 1 Role of Raf-1 in TLR2-Dectin-1-mediated cytokine expression
 Supplementary Figure 1 Supplementary Figure 1 Role of Raf-1 in TLR2-Dectin-1-mediated cytokine expression. Quantitative real-time PCR of indicated mrnas in DCs stimulated with TLR2-Dectin-1 agonist zymosan
Supporting Information
 Supporting Information Identification of Novel ROS Inducers: Quinone Derivatives Tethered to Long Hydrocarbon Chains Yeonsun Hong,, Sandip Sengupta,, Wooyoung Hur, *, Taebo Sim,, * KU-KIST Graduate School
Cellular Physiology and Biochemistry
 Original Paper 2015 The Author(s). 2015 Published The Author(s) by S. Karger AG, Basel Published online: November 27, 2015 www.karger.com/cpb Published by S. Karger AG, Basel 2194 1421-9778/15/0376-2194$39.50/0
Essential Medium, containing 10% fetal bovine serum, 100 U/ml penicillin and 100 µg/ml streptomycin. Huvec were cultured in
 Supplemental data Methods Cell culture media formulations A-431 and U-87 MG cells were maintained in Dulbecco s Modified Eagle s Medium. FaDu cells were cultured in Eagle's Minimum Essential Medium, containing
Supplemental Figure 1
 Supplemental Figure 1 A S100A4: SFLGKRTDEAAFQKLMSNLDSNRDNEVDFQEYCVFLSCIAMMCNEFFEGFPDK Overlap: SF G DE KLM LD N D VDFQEY VFL I M N FF G PD S100A2: SFVGEKVDEEGLKKLMGSLDENSDQQVDFQEYAVFLALITVMCNDFFQGCPDR
Supplementary Figure 1. Identification of tumorous sphere-forming CSCs and CAF feeder cells. The LEAP (Laser-Enabled Analysis and Processing)
") Supplementary Figure 1. Identification of tumorous sphere-forming CSCs and CAF feeder cells. The LEAP (Laser-Enabled Analysis and Processing) platform with laser manipulation to efficiently purify lung
Supplementary Figure 1. Identification of tumorous sphere-forming CSCs and CAF feeder cells. The LEAP (Laser-Enabled Analysis and Processing) platform with laser manipulation to efficiently purify lung
- 1 - Cell types Monocytes THP-1 cells Macrophages. LPS Treatment time (Hour) IL-6 level (pg/ml)
 IL-6 level (pg/ml)") Supplementary Table ST1: The dynamic effect of LPS on IL-6 production in monocytes and THP-1 cells after GdA treatment. Monocytes, THP-1 cells and macrophages (5x10 5 ) were incubated with 10 μg/ml of
Supplementary Table ST1: The dynamic effect of LPS on IL-6 production in monocytes and THP-1 cells after GdA treatment. Monocytes, THP-1 cells and macrophages (5x10 5 ) were incubated with 10 μg/ml of
Doctoral Degree Program in Marine Biotechnology, College of Marine Sciences, Doctoral Degree Program in Marine Biotechnology, Academia Sinica, Taipei,
 Cyclooxygenase 2 facilitates dengue virus replication and serves as a potential target for developing antiviral agents Chun-Kuang Lin 1,2, Chin-Kai Tseng 3,4, Yu-Hsuan Wu 3,4, Chih-Chuang Liaw 1,5, Chun-
Data Sheet. Notch Pathway Reporter Kit Catalog # 60509
 Data Sheet Notch Pathway Reporter Kit Catalog # 60509 6042 Cornerstone Court W, Ste B Background The Notch signaling pathway controls cell fate decisions in vertebrate and invertebrate tissues. NOTCH signaling
supplementary information
 DOI: 10.1038/ncb1875 Figure S1 (a) The 79 surgical specimens from NSCLC patients were analysed by immunohistochemistry with an anti-p53 antibody and control serum (data not shown). The normal bronchi served
p = formed with HCI-001 p = Relative # of blood vessels that formed with HCI-002 Control Bevacizumab + 17AAG Bevacizumab 17AAG
 A.. Relative # of ECs associated with HCI-001 1.4 1.2 1.0 0.8 0.6 0.4 0.2 0.0 ol b p < 0.001 Relative # of blood vessels that formed with HCI-001 1.4 1.2 1.0 0.8 0.6 0.4 0.2 0.0 l b p = 0.002 Control IHC:
Electron micrograph of phosphotungstanic acid-stained exosomes derived from murine
 1 SUPPLEMENTARY INFORMATION SUPPLEMENTARY FIGURES Supplementary Figure 1. Physical properties of murine DC-derived exosomes. a, Electron micrograph of phosphotungstanic acid-stained exosomes derived from
SUPPLEMENTARY FIGURE LEGENDS. atypical adenomatous hyperplasias (AAH); Grade II: adenomas; Grade III: adenocarcinomas;
; Grade II: adenomas; Grade III: adenocarcinomas;") SUPPLEMENTARY FIGURE LEGENDS Supplementary Figure S1: Tumor grades in Ras G12D ; p53 / lung tumors. Representative histology (H&E) of K-Ras G12D ; p53 / lung tumors 13 weeks after tumor initiation. Grade
SUPPLEMENTARY FIGURE LEGENDS Supplementary Figure S1: Tumor grades in Ras G12D ; p53 / lung tumors. Representative histology (H&E) of K-Ras G12D ; p53 / lung tumors 13 weeks after tumor initiation. Grade
York criteria, 6 RA patients and 10 age- and gender-matched healthy controls (HCs).
.") MATERIALS AND METHODS Study population Blood samples were obtained from 15 patients with AS fulfilling the modified New York criteria, 6 RA patients and 10 age- and gender-matched healthy controls (HCs).
MATERIALS AND METHODS Study population Blood samples were obtained from 15 patients with AS fulfilling the modified New York criteria, 6 RA patients and 10 age- and gender-matched healthy controls (HCs).
Supplementary Figure S1 Supplementary Figure S2
 Supplementary Figure S A) The blots shown in Figure B were qualified by using Gel-Pro analyzer software (Rockville, MD, USA). The ratio of LC3II/LC3I to actin was then calculated. The data are represented
Figure S1. Reduction in glomerular mir-146a levels correlate with progression to higher albuminuria in diabetic patients.
 Supplementary Materials Supplementary Figures Figure S1. Reduction in glomerular mir-146a levels correlate with progression to higher albuminuria in diabetic patients. Figure S2. Expression level of podocyte
Supplementary webappendix
 Supplementary webappendix This webappendix formed part of the original submission and has been peer reviewed. We post it as supplied by the authors. Supplement to: Kratz JR, He J, Van Den Eeden SK, et
Cells and reagents. Synaptopodin knockdown (1) and dynamin knockdown (2)
 and dynamin knockdown (2)") Supplemental Methods Cells and reagents. Synaptopodin knockdown (1) and dynamin knockdown (2) podocytes were cultured as described previously. Staurosporine, angiotensin II and actinomycin D were all obtained
Supplemental Methods Cells and reagents. Synaptopodin knockdown (1) and dynamin knockdown (2) podocytes were cultured as described previously. Staurosporine, angiotensin II and actinomycin D were all obtained
condition. Left panel, the HCT-116 cells were lysed with RIPA buffer containing 0.1%
 FIGURE LEGENDS Supplementary Fig 1 (A) sumoylation pattern detected under denaturing condition. Left panel, the HCT-116 cells were lysed with RIPA buffer containing 0.1% SDS in the presence and absence
(A) Dose response curves of HMLE_shGFP (blue circle), HMLE_shEcad (red square),
 Dose response curves of HMLE_shGFP (blue circle), HMLE_shEcad (red square),") Supplementary Figures and Tables Figure S1. Validation of EMT-selective small molecules (A) Dose response curves of HMLE_shGFP (blue circle), HMLE_shEcad (red square), and HMLE_Twist (black diamond) cells
Supplementary Figures and Tables Figure S1. Validation of EMT-selective small molecules (A) Dose response curves of HMLE_shGFP (blue circle), HMLE_shEcad (red square), and HMLE_Twist (black diamond) cells
Cell lines and tissue samples. The 18 human NSCLC cell lines used in this. study included eight adenocarcinoma cell lines (ADCs; A427, A549, LC319,
 Supplementary Materials and Methods Cell lines and tissue samples. The 18 human NSCLC cell lines used in this study included eight adenocarcinoma cell lines (ADCs; A427, A549, LC319, NCI-H1373, PC-3, PC-9,
Supplementary Figure 1. Characterization of ALDH-positive cell population in MCF-7 cells. (a) Expression level of stem cell markers in MCF-7 cells or
 Expression level of stem cell markers in MCF-7 cells or") Supplementary Figure 1. Characterization of ALDH-positive cell population in MCF-7 cells. (a) Expression level of stem cell markers in MCF-7 cells or ALDH-positive cell population by qpcr. Data represent
Supplementary Figure 1. Characterization of ALDH-positive cell population in MCF-7 cells. (a) Expression level of stem cell markers in MCF-7 cells or ALDH-positive cell population by qpcr. Data represent
Supplementary Figure 1. SA-β-Gal positive senescent cells in various cancer tissues. Representative frozen sections of breast, thyroid, colon and
 Supplementary Figure 1. SA-β-Gal positive senescent cells in various cancer tissues. Representative frozen sections of breast, thyroid, colon and stomach cancer were stained with SA-β-Gal and nuclear fast
microrna PCR System (Exiqon), following the manufacturer s instructions. In brief, 10ng of
, following the manufacturer s instructions. In brief, 10ng of") SUPPLEMENTAL MATERIALS AND METHODS Quantitative RT-PCR Quantitative RT-PCR analysis was performed using the Universal mircury LNA TM microrna PCR System (Exiqon), following the manufacturer s instructions.
SUPPLEMENTAL MATERIALS AND METHODS Quantitative RT-PCR Quantitative RT-PCR analysis was performed using the Universal mircury LNA TM microrna PCR System (Exiqon), following the manufacturer s instructions.
Supplemental Material:
 Supplemental Material: MATERIALS AND METHODS RNA interference Mouse CHOP sirna (ON-TARGETplus SMARTpool Cat# L-062068-00) and control sirna (ON-TARGETplus Control) were purchased from Dharmacon. Transfection
SUPPLEMENTARY INFORMATION
 DOI: 10.1038/ncb2607 Figure S1 Elf5 loss promotes EMT in mammary epithelium while Elf5 overexpression inhibits TGFβ induced EMT. (a, c) Different confocal slices through the Z stack image. (b, d) 3D rendering
Figure S1. Generation of inducible PTEN deficient mice and the BMMCs (A) B6.129 Pten loxp/loxp mice were mated with B6.
 B6.129 Pten loxp/loxp mice were mated with B6.") Figure S1. Generation of inducible PTEN deficient mice and the BMMCs (A) B6.129 Pten loxp/loxp mice were mated with B6.129-Gt(ROSA)26Sor tm1(cre/ert2)tyj /J mice. To induce deletion of the Pten locus,
Figure S1. Generation of inducible PTEN deficient mice and the BMMCs (A) B6.129 Pten loxp/loxp mice were mated with B6.129-Gt(ROSA)26Sor tm1(cre/ert2)tyj /J mice. To induce deletion of the Pten locus,