Supplemental Figure 1. Loss of Cdkn2b promotes atherosclerosis in both genders and at serial timepoints. Loss of Cdkn2b also increases growth of the
|
|
|
- Rose Hart
- 5 years ago
- Views:
Transcription
1 Supplemental Figure. Loss of Cdkn2b promotes atherosclerosis in both genders and at serial timepoints. Loss of Cdkn2b also increases growth of the necrotic core and increases early apoptosis. (A) Relative to male Cdkn2b +/+,ApoE -/- control mice, male Cdkn2b -/-,ApoE -/- mice develop advanced atherosclerotic plaques as soon as 8 weeks after initiating Western diet, with these changes persisting over time (4x magnification). (B) A similar change is observed in female mice (P =0.04, 4x magnification). (C) Additional examples of the large acellular necrotic cores observed in Cdkn2b -/-,ApoE -/- mice relative to Cdkn2b +/+,ApoE -/- control animals (H&E staining on top, Masson Trichrome on bottom at various magnifications). (D) Because very little apoptosis was observed at the terminal endpoint of the chronic model provided in Figure, an additional 0 Cdkn2b +/+,ApoE -/- and Cdkn2b -/-,ApoE -/- who had only received 4 weeks of high-fat diet were infused with Angiotensin II by osmotic minipump for 72 hours prior to sacrifice to induce acute vascular inflammation. In this case, Cdkn2b -/-,ApoE -/- displayed a 97% increase in TUNEL positive cells per section relative to controls, of borderline significance (P=0.06). (E) Compensation of other 9p2.3 locus genes in aortic tissue from Cdkn2b -/-,ApoE -/- relative to Cdkn2b +/+,ApoE -/- control mice. As previously described, there is significant upregulation of Cdkn2a in Cdkn2b knockout animals. In the current studies, no difference in the expression of the pro-apoptotic gene p9/arf was observed at the terminal endpoint. (F) No difference in lipid levels or fasting glucose was observed between genotypes after 2 weeks of Western diet. 43


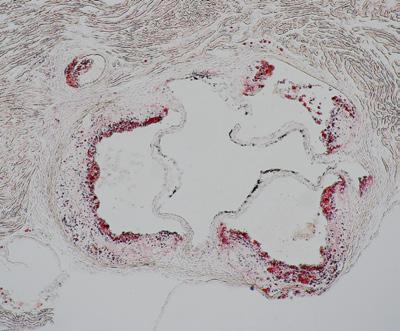
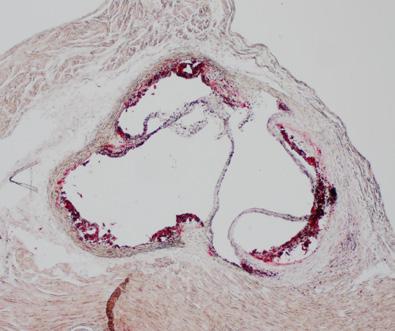


2 Suppl. Fig. Time course A Week 2 ** Atherosclerosis area (mm2) Week 8 Cdkn2b-/ + Baseline B * TUNEL positive cells E F Cdkn2b-/-/ApoE-//ApoE-/mg/dL Apoptosing cells () Cdkn2b-/- Week 2 20x Magnification 0x Magnification 4x Magnification 4x Magnification Cdkn2b-/ Week 8 Cdkn2b-/- Relative expression Atherosclerosis area (mm2) Cdkn2b-/ D C Female mice Cdkn2b-/ Cd kn 2b p 9A rf Cd kn 2a MT AP To ta lc ho Tri g les lyc ter eri HD ol LD de L-C s ho les L- ter Ch Glu ol co ole se ste rol
3 Supplemental Figure 2. Bioinformatics analysis of human atherosclerosis samples and evaluation of additional efferocytosis genes in HCASMC. (A) Topological relationship between and genes involved in efferocytosis in human coronary artery segments. Color bars correspond to module assignment. (B) Gene coexpression network cluster dendogram from human coronary artery segments. The network adjacency was calculated from topological overlap between all gene pairs represented in the expression data set. The dynamic tree cut algorithm was used to iteratively choose stable cluster sizes and partition the network into modules. (C) Correlation between expression and genes involved in efferocytosis in human coronary artery segments: (a) All samples; (b) samples without atherosclerotic lesions; (c) samples with atherosclerotic lesions. (D) Relative expression of several additional candidate efferocytosis genes in si HCASMC compared to sicont HCASMC at baseline (D) and during apoptosis (E). (F) Compared to control Cdkn2b +/+,ApoE -/- specimens, aortas from female heterozygous Cdkn2b +/-,ApoE -/- had an intermediate 62.% reduction in Calr expression (P < 0.03) compared to the 90.8% reduction in Calr expression observed in Cdkn2b -/-,ApoE -/- animals (P < 0.02, top panel). These findings correlated with the in vivo reduction of aortic Cdkn2b expression observed in herterozygous animals (bottom panel). (G) Co-expression analysis in human carotid artery atherosclerotic plaques confirm that and CALR are positively associated, as observed in human coronary artery atherosclerotic plaque (r 2 = 0.74, P <0.000). 44

 Correlation coefficient.0 0. 5")


 Aortic Cdkn2b expression (mrna, %) C ALR")
4 A rho B Cluster Dendrogram Suppl. Fig. 2 C ELMO PPARG CD36 TIMD4 ABCA6 AKT CALR GAS6 MFGE8 CX3CL CD4 CQB MERTK GULP DOCK CD47 ANXA PROS LRP APOH BAI SIRPA LRPAP MBL2 NRH3 ICAM3 PANX TGFB ELMO PPARG CD36 TIMD4 ABCA6 AKT CALR GAS6 MFGE8 CX3CL CD4 CQB MERTK GULP DOCK CD47 ANXA PROS LRP APOH BAI SIRPA LRPAP MBL2 NRH3 ICAM3 PANX TGFB a. b. c. Height Modules d hclust (*, "average") Correlation coefficient Correlation coefficient Correlation coefficient D E Eat-Me ligand expression Eat-Me ligand expression C ALR M FGE 8 CX3CL ABCA6 ICAM3 AS6 G A PO H PROS CQB ANXA D47 RP C L M BL 2 S IRP A 3 NRH PPARG LRPAP TGFB AI B T IMD C D 4 M ERT K C D3 6 E LMO DOCK A KT P ANX GULP HCASMC - Baseline CD47 ICAM-3 Gas-6 Thrombospondin Lactadherine Cq APOH ABC- HCASMC - Apoptosis C ALR M FGE 8 CX3CL ABCA6 ICAM3 AS6 CD47 ICAM-3 Gas-6 Thrombospondin Lactadherine Cq APOH ABC- G A PO H PROS CQB ANXA D47 RP C L M BL 2 S IRP A 3 NRH PPARG LRPAP TGFB AI B T IMD C D 4 M ERT K C D3 6 E LMO DOCK A KT P ANX GULP F Aortic calreticulin expression (mrna, %) Aortic Cdkn2b expression (mrna, %) C ALR M FGE 8 CX3CL ABCA6 ICAM3 AS6 G A PO H PROS CQB ANXA D47 RP C L M BL 2 S IRP A 3 NRH PPARG LRPAP TGFB AI B T IMD C D 4 M ERT K C D3 6 E LMO DOCK A KT P ANX GULP Heterozygous aortas * Cdkn2b -/- / Cdkn2b +/- / Cdkn2b +/+ / ApoE -/- ApoE -/- ApoE -/- Heterozygous aortas Cdkn2b -/- / Cdkn2b +/- / Cdkn2b +/+ / ApoE -/- ApoE -/- ApoE -/- G Calreticulin Carotid plaque expression correlation var2 95% CI Fitted values var
5 Supplemental Figure 3. Additional analysis of the CALR promoter. (A) Publically-available data from the UCSC genome browser reveals that the CALR promoter has an open chromatin pattern, DNase hypersensitivity sites, a consistent AoSMC DNA methylation pattern and published ChIP-seq data all of which suggest that E2F4 could regulate CALR expression in human SMCs. (B) Untransfected HCASMC increased their expression of in response to exogenous TGF- β stimulation in a pattern consistent with the luciferase reporter data shown in Figure 3. (C) CALR promoter oligo sequences and ChiP primers employed in the EMSA and immunoprecipitation studies, respectively, described in Figure 3. (D) Positive and negative control reactions employed in the EMSA experiments for Figure 3. 45


6 A B Fold Change (mrna) TGF-B: Suppl. Fig. 3 0 ng/ml 2 ng/ml 0.5 ng/ml None C D A
7 Supplemental Figure 4. does not alter the phagocytic capacity of the neighboring cell. (A) Control gates employed for all efferocytosis studies. (B) Although loss of rendered apoptotic cells resistant to efferocytosis, loss of in the neighboring, non-apoptotic HCASMC had no impact on its phagocytic capacity. Note that was undetectable in professional phagocytes such as macrophages, in culture. (C) Apoptotic primary Cdkn2b -/- aortic smooth muscle cells resist phagocytic clearance by RAW macrophages relative to apoptotic primary Cdkn2b +/+ aortic smooth muscle cells (P < 0.0), in keeping with findings provided for -deficient HCASMC in Figure 4. (D) Heterozygous Cdkn2b +/- aortic smooth muscle cells show an intermediate efferocytosis phenotype. (E) Additional examples of failed efferocytosis in vivo in Cdkn2b -/-,ApoE -/- mice. Electron micrographs at various magnifications again reveal more frequent apoptosis and necrosis in Cdkn2b -/-,ApoE -/- animals, with condensed chromatin and interruption of plasma membrane integrity (black arrows), along with a high burden of extracellular debris and ABs not associated with an adjacent macrophage (black arrowheads). Conversely, Cdkn2b +/+,ApoE -/- control mice displayed smoothly outlined nuclei with normal heterochromatin patterns, normal sized mitochondria and intact plasma membranes (white arrowheads). These plaques also routinely displayed macrophages which had ingested numerous ABs, suggestive of intact efferocytosis. 46


8 si sicontrol Efferocytosis Resistance Assay - Primary Mouse Aortic Smooth Muscle Cells Cdkn2b-/- 200x 200x 00 FITC Green RAW MΦ 00 FITC Green RAW MΦ 2500x 6000x D Efferocytosis rate (%) Cdkn2b-/ Efferocytosis rate (%) sicontrol Efferocytosis rate (%) si C Cdkn2b-/ Efferocytosis Capacity Assay B E Orange ABs Green Phagocytes Unstained ABs Unstained SMC A Suppl. Fig. 4 Efferocytosis Gates and Single Positive Controls Heterozygous cells Cdkn2b-/- Cdkn2b+/- 500x 2500x 3000x 800x
9 Supplemental Figure 5. Macrophages co-cultured with Cdkn2b +/+ AB (grey bar) upregulated Abca relative to baseline (white bar). This homeostatic pathway was significantly blunted when macrophages were co-cultured with Cdkn2b -/- AB (black bar), as observed for the experiments with -deficient HCASMCs provided in Figure 5. Supplemental Table. Summary of topological characteristics of gene coexpression modules identified in human coronary artery segments. Supplemental Table 2. Summary of gene coexpression module assignment in human coronary artery segments. ktotal = global network connectivity, kwithin = intramodular network connectivity, kout = extramodular network connectivity, kdiff = difference between extramodular and intramodular connectivity, MAR = maximum adjacency ratio, kme0 kmen = correlation between gene expression and module eigengene expression for modules 0 n. Supplemental Table 3. Primers and probes used in these studies. 47

10 A Abca expression (mrna %) Macrophages + + Cdkn2b +/+ AB + Cdkn2b -/- AB Unstimulated Suppl. Fig. 5
Cyclin-dependent kinase inhibitor 2B regulates efferocytosis and atherosclerosis
 Research article Cyclin-dependent kinase inhibitor 2B regulates efferocytosis and atherosclerosis Yoko Kojima, 1,2 Kelly Downing, 1 Ramendra Kundu, 2 Clint Miller, 2 Frederick Dewey, 2 Hope Lancero, 2
Supplementary Figure S I: Effects of D4F on body weight and serum lipids in apoe -/- mice.
 Supplementary Figures: Supplementary Figure S I: Effects of D4F on body weight and serum lipids in apoe -/- mice. Male apoe -/- mice were fed a high-fat diet for 8 weeks, and given PBS (model group) or
Supplementary Figure 1. Characterization of human carotid plaques. (a) Flash-frozen human plaques were separated into vulnerable (V) and stable (S),
 Flash-frozen human plaques were separated into vulnerable (V) and stable (S),") Supplementary Figure 1. Characterization of human carotid plaques. (a) Flash-frozen human plaques were separated into vulnerable (V) and stable (S), regions which were then quantified for mean fluorescence
Supplementary Figure 1. Characterization of human carotid plaques. (a) Flash-frozen human plaques were separated into vulnerable (V) and stable (S), regions which were then quantified for mean fluorescence
Supplementary Figures
 Supplementary Figures Supplementary Figure 1. Confirmation of Dnmt1 conditional knockout out mice. a, Representative images of sorted stem (Lin - CD49f high CD24 + ), luminal (Lin - CD49f low CD24 + )
Mass Histology Service
 Mass Histology Service A complete anatomical pathology laboratory www.masshistology.com Telephone: (877) 286-6004 Report on Pathology A Time Course Study of the Local Effects of Intramuscular XXXXXXX Injection
Potential Atheroprotective Effects of Ixmyelocel-T Cellular Therapy. Kelly J. Ledford, Nikki Murphy, Frank Zeigler, Ronnda L.
 Potential Atheroprotective Effects of Ixmyelocel-T Cellular Therapy Kelly J. Ledford, Nikki Murphy, Frank Zeigler, Ronnda L. Bartel 1 Ixmyelocel-T, an expanded, autologous multicellular therapy cultured
Stewart et al. CD36 ligands promote sterile inflammation through assembly of a TLR 4 and 6 heterodimer
 NFκB (fold induction) Stewart et al. ligands promote sterile inflammation through assembly of a TLR 4 and 6 heterodimer a. mrna (fold induction) 5 4 3 2 1 LDL oxldl Gro1a MIP-2 RANTES mrna (fold induction)
Basic Mechanisms of Atherosclerosis and Plaque Rupture: Clinical Implications
 12 th Annual Cardiovascular Disease Prevention Symposium February 8, 2013 KEYNOTE ADDRESS Basic Mechanisms of Atherosclerosis and Plaque Rupture: Clinical Implications Ira Tabas, M.D., Ph.D. Richard J.
Leptin deficiency suppresses progression of atherosclerosis in apoe-deficient mice
 Leptin deficiency suppresses progression of atherosclerosis in apoe-deficient mice Atherosclerosis, 2007 Chiba T, Shinozaki S, Nakazawa T, et al. Present by Sudaporn Pummoung Apolipoprotein E (apoe( apoe)
Supplementary Figure 1: TSLP receptor skin expression in dcssc. A: Healthy control (HC) skin with TSLP receptor expression in brown (10x
 skin with TSLP receptor expression in brown (10x") Supplementary Figure 1: TSLP receptor skin expression in dcssc. A: Healthy control (HC) skin with TSLP receptor expression in brown (10x magnification). B: Second HC skin stained for TSLP receptor in brown
Supplementary Figure 1: TSLP receptor skin expression in dcssc. A: Healthy control (HC) skin with TSLP receptor expression in brown (10x magnification). B: Second HC skin stained for TSLP receptor in brown
Supplementary Materials for
 www.sciencesignaling.org/cgi/content/full/2/1/ra81/dc1 Supplementary Materials for Delivery of MicroRNA-126 by Apoptotic Bodies Induces CXCL12- Dependent Vascular Protection Alma Zernecke,* Kiril Bidzhekov,
c Ischemia (30 min) Reperfusion (8 w) Supplementary Figure bp 300 bp Ischemia (30 min) Reperfusion (4 h) Dox 20 mg/kg i.p.
 Reperfusion (8 w) Supplementary Figure bp 300 bp Ischemia (30 min) Reperfusion (4 h) Dox 20 mg/kg i.p.") a Marker Ripk3 +/ 5 bp 3 bp b Ischemia (3 min) Reperfusion (4 h) d 2 mg/kg i.p. 1 w 5 w Sacrifice for IF size A subset for echocardiography and morphological analysis c Ischemia (3 min) Reperfusion (8
a Marker Ripk3 +/ 5 bp 3 bp b Ischemia (3 min) Reperfusion (4 h) d 2 mg/kg i.p. 1 w 5 w Sacrifice for IF size A subset for echocardiography and morphological analysis c Ischemia (3 min) Reperfusion (8
7SK ChIRP-seq is specifically RNA dependent and conserved between mice and humans.
 Supplementary Figure 1 7SK ChIRP-seq is specifically RNA dependent and conserved between mice and humans. Regions targeted by the Even and Odd ChIRP probes mapped to a secondary structure model 56 of the
Probe. Hind III Q,!?R'!! /0!!!!D1"?R'! vector. Homologous recombination
 Supple-Zhang Page 1 Wild-type locus Targeting construct Targeted allele Exon Exon3 Exon Probe P1 P P3 FRT FRT loxp loxp neo vector amh I Homologous recombination neo P1 P P3 FLPe recombination Q,!?R'!!
Supplementary Figure 1
 Supplementary Figure 1 a Percent of body weight! (%) 4! 3! 1! Epididymal fat Subcutaneous fat Liver SD Percent of body weight! (%) ** 3! 1! SD Percent of body weight! (%) 6! 4! SD ** b Blood glucose (mg/dl)!
Supplementary Materials for
 www.sciencesignaling.org/cgi/content/full/8/375/ra41/dc1 Supplementary Materials for Actin cytoskeletal remodeling with protrusion formation is essential for heart regeneration in Hippo-deficient mice
SUPPLEMENTARY INFORMATION
 DOI:.38/ncb3399 a b c d FSP DAPI 5mm mm 5mm 5mm e Correspond to melanoma in-situ Figure a DCT FSP- f MITF mm mm MlanaA melanoma in-situ DCT 5mm FSP- mm mm mm mm mm g melanoma in-situ MITF MlanaA mm mm
Supplementary Figure 1. DNA methylation of the adiponectin promoter R1, Pparg2, and Tnfa promoter in adipocytes is not affected by obesity.
 Supplementary Figure 1. DNA methylation of the adiponectin promoter R1, Pparg2, and Tnfa promoter in adipocytes is not affected by obesity. (a) Relative amounts of adiponectin, Ppar 2, C/ebp, and Tnf mrna
Control GST GST-RAP. α2-mg. 170 kda. b-actin. 42 kda LRP-1
 % of max Supplementary Figure 1 Control GST GST-RP 17 kda α2-mg 42 kda b-actin Gate: CD11c+ (DCs) Gate: F4/8+ (Mfs) IgG Cd11cCre + Lrp1 fl/fl LRP-1 Supplementary figure 1. () MDCs were pretreated with
Comparison of open chromatin regions between dentate granule cells and other tissues and neural cell types.
 Supplementary Figure 1 Comparison of open chromatin regions between dentate granule cells and other tissues and neural cell types. (a) Pearson correlation heatmap among open chromatin profiles of different
Cells and reagents. Synaptopodin knockdown (1) and dynamin knockdown (2)
 and dynamin knockdown (2)") Supplemental Methods Cells and reagents. Synaptopodin knockdown (1) and dynamin knockdown (2) podocytes were cultured as described previously. Staurosporine, angiotensin II and actinomycin D were all obtained
Supplemental Methods Cells and reagents. Synaptopodin knockdown (1) and dynamin knockdown (2) podocytes were cultured as described previously. Staurosporine, angiotensin II and actinomycin D were all obtained
Phagocytosis of apoptotic cells Prof. Peter Henson
 National Jewish Medical and Research Center Denver, CO. U.S.A. Aimee decathelineau 1 1. Apoptosis and other forms of programmed cell death (PCD) are mechanisms for cell deletion in vivo Examples: Inflammation
Supplementary Information File
 Supplementary Information File Supplementary Table 1. List of synthesized sirna sequences for target genes sirna Species Sequence Ctrl sirna mouse sense 5 -UUCUCCGAACGUGUCACGUTT-3 Antisense 5 -ACGUGACACGUUCGGAGAATT-3
Supplementary Figure 1:
 Supplementary Figure 1: (A) Whole aortic cross-sections stained with Hematoxylin and Eosin (H&E), 7 days after porcine-pancreatic-elastase (PPE)-induced AAA compared to untreated, healthy control aortas
Supplemental Figure 1. Genes showing ectopic H3K9 dimethylation in this study are DNA hypermethylated in Lister et al. study.
 mc mc mc mc SUP mc mc Supplemental Figure. Genes showing ectopic HK9 dimethylation in this study are DNA hypermethylated in Lister et al. study. Representative views of genes that gain HK9m marks in their
Supplementary Figure 1
 Supplementary Figure 1 how HFD how HFD Epi WT p p Hypothalamus p p Inguinal WT T Liver Lean mouse adipocytes p p p p p p Obese mouse adipocytes Kidney Muscle Spleen Heart p p p p p p p p Extracellular
Trim29 gene-targeting strategy. (a) Genotyping of wildtype mice (+/+), Trim29 heterozygous mice (+/ ) and homozygous mice ( / ).
 Genotyping of wildtype mice (+/+), Trim29 heterozygous mice (+/ ) and homozygous mice ( / ).") Supplementary Figure 1 Trim29 gene-targeting strategy. (a) Genotyping of wildtype mice (+/+), Trim29 heterozygous mice (+/ ) and homozygous mice ( / ). (b) Immunoblot analysis of TRIM29 in lung primary
Supplementary Figure 1 Trim29 gene-targeting strategy. (a) Genotyping of wildtype mice (+/+), Trim29 heterozygous mice (+/ ) and homozygous mice ( / ). (b) Immunoblot analysis of TRIM29 in lung primary
Title: Smooth muscle cell-specific Tgfbr1 deficiency promotes aortic aneurysm formation by stimulating multiple signaling events
 Title: Smooth muscle cell-specific Tgfbr1 deficiency promotes aortic aneurysm formation by stimulating multiple signaling events Pu Yang 1, 3, radley M. Schmit 1, Chunhua Fu 1, Kenneth DeSart 1, S. Paul
SUPPLEMENTARY FIGURES
 SUPPLEMENTARY FIGURES 1 Supplementary Figure 1, Adult hippocampal QNPs and TAPs uniformly express REST a-b) Confocal images of adult hippocampal mouse sections showing GFAP (green), Sox2 (red), and REST
Pathologic Stage. Lymph node Stage
 ASC ASC a c Patient ID BMI Age Gleason score Non-obese PBMC 1 22.1 81 6 (3+3) PBMC 2 21.9 6 6 (3+3) PBMC 3 22 84 8 (4+4) PBMC 4 24.6 68 7 (3+4) PBMC 24. 6 (3+3) PBMC 6 24.7 73 7 (3+4) PBMC 7 23. 67 7 (3+4)
E10.5 E18.5 P2 10w 83w NF1 HF1. Sham ISO. Bmi1. H3K9me3. Lung weight (g)
") Myociyte cross-sectional Relative mrna levels Relative levels Relative mrna levels Supplementary Figures and Legends a 8 6 4 2 Ezh2 E1.5 E18.5 P2 1w 83w b Ezh2 p16 amhc b-actin P2 43w kd 37 86 16 wt mouse
Myociyte cross-sectional Relative mrna levels Relative levels Relative mrna levels Supplementary Figures and Legends a 8 6 4 2 Ezh2 E1.5 E18.5 P2 1w 83w b Ezh2 p16 amhc b-actin P2 43w kd 37 86 16 wt mouse
TGF-β Signaling Regulates Neuronal C1q Expression and Developmental Synaptic Refinement
 Supplementary Information Title: TGF-β Signaling Regulates Neuronal C1q Expression and Developmental Synaptic Refinement Authors: Allison R. Bialas and Beth Stevens Supplemental Figure 1. In vitro characterization
SUPPLEMENTARY INFORMATION
 DOI: 10.1038/ncb2607 Figure S1 Elf5 loss promotes EMT in mammary epithelium while Elf5 overexpression inhibits TGFβ induced EMT. (a, c) Different confocal slices through the Z stack image. (b, d) 3D rendering
Dyslipidemia Endothelial dysfunction Free radicals Immunologic
 ATHEROSCLEROSIS Hossein Mehrani Professor of Clinical Biochemistry Definition Atherosclerosis: Is a chronic inflammatory process characterized by plaque formation within the vessel wall of arteries and
Supplemental Table I.
 Supplemental Table I Male / Mean ± SEM n Mean ± SEM n Body weight, g 29.2±0.4 17 29.7±0.5 17 Total cholesterol, mg/dl 534.0±30.8 17 561.6±26.1 17 HDL-cholesterol, mg/dl 9.6±0.8 17 10.1±0.7 17 Triglycerides,
Supplementary Figure S1. Gene expression analysis of epidermal marker genes and TP63.
 Supplementary Figure Legends Supplementary Figure S1. Gene expression analysis of epidermal marker genes and TP63. A. Screenshot of the UCSC genome browser from normalized RNAPII and RNA-seq ChIP-seq data
The aorta is an integral part of the cardiovascular system and should not be considered as just a conduit for blood supply from the heart to the
 The aorta is an integral part of the cardiovascular system and should not be considered as just a conduit for blood supply from the heart to the limbs and major organs. A range of important pathologies
Supplementary Figure 1. HOPX is hypermethylated in NPC. (a) Methylation levels of HOPX in Normal (n = 24) and NPC (n = 24) tissues from the
 Methylation levels of HOPX in Normal (n = 24) and NPC (n = 24) tissues from the") Supplementary Figure 1. HOPX is hypermethylated in NPC. (a) Methylation levels of HOPX in Normal (n = 24) and NPC (n = 24) tissues from the genome-wide methylation microarray data. Mean ± s.d.; Student
Supplementary Figure 1. HOPX is hypermethylated in NPC. (a) Methylation levels of HOPX in Normal (n = 24) and NPC (n = 24) tissues from the genome-wide methylation microarray data. Mean ± s.d.; Student
Supplemental Table 1. Primers used for RT-PCR analysis of inflammatory cytokines Gene Primer Sequence
 Supplemental Table 1. Primers used for RT-PCR analysis of inflammatory cytokines Gene Primer Sequence IL-1α Forward primer 5 -CAAGATGGCCAAAGTTCGTGAC-3' Reverse primer 5 -GTCTCATGAAGTGAGCCATAGC-3 IL-1β
Pathogenesis of lupus apoptosis clearance and regulation of self tolerance. Durga Prasanna Misra
 Pathogenesis of lupus apoptosis clearance and regulation of self tolerance Durga Prasanna Misra Format Apoptosis Apoptosis in SLE Decreased apoptosis of autoreactive cells Increased apoptosis Defective
Supplementary Figure 1 Chemokine and chemokine receptor expression during muscle regeneration (a) Analysis of CR3CR1 mrna expression by real time-pcr
 Analysis of CR3CR1 mrna expression by real time-pcr") Supplementary Figure 1 Chemokine and chemokine receptor expression during muscle regeneration (a) Analysis of CR3CR1 mrna expression by real time-pcr at day 0, 1, 4, 10 and 21 post- muscle injury. (b)
Supplementary Figure 1 Chemokine and chemokine receptor expression during muscle regeneration (a) Analysis of CR3CR1 mrna expression by real time-pcr at day 0, 1, 4, 10 and 21 post- muscle injury. (b)
34 Apoptosis Programmed cell death is vital to the health and development of multicellular organisms.
 Principles of Biology contents 34 Apoptosis Programmed cell death is vital to the health and development of multicellular organisms. Apoptosis is the reason we have separate fingers and toes. During embryonic
Supplemental Figure 1. Egr1 expression in adult Achilles tendons. (A,B) Achilles tendons were isolated from 2 month-old Egr1 +/- mice and stained for
 Achilles tendons were isolated from 2 month-old Egr1 +/- mice and stained for") Supplemental Figure 1. Egr1 expression in adult Achilles tendons. (A,B) Achilles tendons were isolated from 2 month-old Egr1 +/- mice and stained for LacZ activity, which reflects Egr1 expression. (A)
Supplemental Figure 1. Egr1 expression in adult Achilles tendons. (A,B) Achilles tendons were isolated from 2 month-old Egr1 +/- mice and stained for LacZ activity, which reflects Egr1 expression. (A)
Fig. S1. Validation of ChIP-seq binding sites by single gene ChIP-PCR Fig. S2. Transactivation potential of PPAR
 Fig. S1. Validation of ChIP-seq binding sites by single gene ChIP-PCR ChIP-PCR was performed on PPARγ and RXR-enriched chromatin harvested during adipocyte differentiation at day and day 6 as described
Supplementary Figure 1 IL-27 IL
 Tim-3 Supplementary Figure 1 Tc0 49.5 0.6 Tc1 63.5 0.84 Un 49.8 0.16 35.5 0.16 10 4 61.2 5.53 10 3 64.5 5.66 10 2 10 1 10 0 31 2.22 10 0 10 1 10 2 10 3 10 4 IL-10 28.2 1.69 IL-27 Supplementary Figure 1.
Receptor-interacting Protein Kinases Mediate Necroptosis In Neural Tissue Damage After Spinal Cord Injury
 Receptor-interacting Protein Kinases Mediate Necroptosis In Neural Tissue Damage After Spinal Cord Injury Haruo Kanno, M.D., Ph.D., Hiroshi Ozawa, M.D., Ph.D., Satoshi Tateda, M.D., Kenichiro Yahata, M.D.,
Chronic variable stress activates hematopoietic stem cells
 SUPPLEMENTARY INFORMATION Chronic variable stress activates hematopoietic stem cells Timo Heidt *, Hendrik B. Sager *, Gabriel Courties, Partha Dutta, Yoshiko Iwamoto, Alex Zaltsman, Constantin von zur
Supplemental Figure 1. (A) The localization of Cre DNA recombinase in the testis of Cyp19a1-Cre mice was detected by immunohistchemical analyses
 The localization of Cre DNA recombinase in the testis of Cyp19a1-Cre mice was detected by immunohistchemical analyses") Supplemental Figure 1. (A) The localization of Cre DNA recombinase in the testis of Cyp19a1-Cre mice was detected by immunohistchemical analyses using an anti-cre antibody; testes at 1 week (left panel),
Supplemental Figure 1. (A) The localization of Cre DNA recombinase in the testis of Cyp19a1-Cre mice was detected by immunohistchemical analyses using an anti-cre antibody; testes at 1 week (left panel),
Supplemental Figure 1
 Supplemental Figure 1 A S100A4: SFLGKRTDEAAFQKLMSNLDSNRDNEVDFQEYCVFLSCIAMMCNEFFEGFPDK Overlap: SF G DE KLM LD N D VDFQEY VFL I M N FF G PD S100A2: SFVGEKVDEEGLKKLMGSLDENSDQQVDFQEYAVFLALITVMCNDFFQGCPDR
Supplementary Figure 1: Hsp60 / IEC mice are embryonically lethal (A) Light microscopic pictures show mouse embryos at developmental stage E12.
 Light microscopic pictures show mouse embryos at developmental stage E12.") Supplementary Figure 1: Hsp60 / IEC mice are embryonically lethal (A) Light microscopic pictures show mouse embryos at developmental stage E12.5 and E13.5 prepared from uteri of dams and subsequently genotyped.
Supplementary Figure 1: Hsp60 / IEC mice are embryonically lethal (A) Light microscopic pictures show mouse embryos at developmental stage E12.5 and E13.5 prepared from uteri of dams and subsequently genotyped.
Pharmacologic inhibition of histone demethylation as a therapy for pediatric brainstem glioma
 Supplementary information for: Pharmacologic inhibition of histone demethylation as a therapy for pediatric brainstem glioma Rintaro Hashizume 1, Noemi Andor 2, Yuichiro Ihara 2, Robin Lerner 2, Haiyun
Supplemental Figures:
 Supplemental Figures: Figure 1: Intracellular distribution of VWF by electron microscopy in human endothelial cells. a) Immunogold labeling of LC3 demonstrating an LC3-positive autophagosome (white arrow)
EPIGENETIC RE-EXPRESSION OF HIF-2α SUPPRESSES SOFT TISSUE SARCOMA GROWTH
 EPIGENETIC RE-EXPRESSION OF HIF-2α SUPPRESSES SOFT TISSUE SARCOMA GROWTH Supplementary Figure 1. Supplementary Figure 1. Characterization of KP and KPH2 autochthonous UPS tumors. a) Genotyping of KPH2
Quantitative Real-Time PCR was performed as same as Materials and Methods.
 Supplemental Material Quantitative Real-Time PCR Quantitative Real-Time PCR was performed as same as Materials and Methods. Expression levels in the aorta were normalized to peptidylprolyl isomerase B
Supplementary Figure 1. EC-specific Deletion of Snail1 Does Not Affect EC Apoptosis. (a,b) Cryo-sections of WT (a) and Snail1 LOF (b) embryos at
 Cryo-sections of WT (a) and Snail1 LOF (b) embryos at") Supplementary Figure 1. EC-specific Deletion of Snail1 Does Not Affect EC Apoptosis. (a,b) Cryo-sections of WT (a) and Snail1 LOF (b) embryos at E10.5 were double-stained for TUNEL (red) and PECAM-1 (green).
Supplementary Figure 1. EC-specific Deletion of Snail1 Does Not Affect EC Apoptosis. (a,b) Cryo-sections of WT (a) and Snail1 LOF (b) embryos at E10.5 were double-stained for TUNEL (red) and PECAM-1 (green).
Nature Protocols: doi: /nprot Supplementary Figure 1
 Supplementary Figure 1 Traditional electronic gating strategy for analysing cell death based on A5-FITC and 7-AAD. a, Flow cytometry analysis showing the traditional two-stage electronic gating strategy
SUPPLEMENTARY INFORMATION
 Figure S1 Treatment with both Sema6D and Plexin-A1 sirnas induces the phenotype essentially identical to that induced by treatment with Sema6D sirna alone or Plexin-A1 sirna alone. (a,b) The cardiac tube
Type of file: PDF Title of file for HTML: Supplementary Information Description: Supplementary Figures and Supplementary Table.
 Type of file: PDF Title of file for HTML: Supplementary Information Description: Supplementary Figures and Supplementary Tale. Type of file: VI Title of file for HTML: Supplementary Movie 1 Description:
Supplementary Materials for
 www.sciencesignaling.org/cgi/content/full/8/389/ra79/dc1 Supplementary Materials for HDL-bound sphingosine 1-phosphate acts as a biased agonist for the endothelial cell receptor S1P 1 to limit vascular
perk/erk STAT5B
 pakt/akt relative to saline (fold).5.5.5 control perk/erk relative to saline (fold).6.4..8.6.4. p=.6 control db/+ Hsp6 VDAC Hsp6/VDAC (relative to db/+) 8 6 4 db/+ C db/+ Hsp6 Hsp6/actin (relative to db/+)
Nature Structural & Molecular Biology: doi: /nsmb.2419
 Supplementary Figure 1 Mapped sequence reads and nucleosome occupancies. (a) Distribution of sequencing reads on the mouse reference genome for chromosome 14 as an example. The number of reads in a 1 Mb
Soft Agar Assay. For each cell pool, 100,000 cells were resuspended in 0.35% (w/v)
") SUPPLEMENTARY MATERIAL AND METHODS Soft Agar Assay. For each cell pool, 100,000 cells were resuspended in 0.35% (w/v) top agar (LONZA, SeaKem LE Agarose cat.5004) and plated onto 0.5% (w/v) basal agar.
SUPPLEMENTARY MATERIAL AND METHODS Soft Agar Assay. For each cell pool, 100,000 cells were resuspended in 0.35% (w/v) top agar (LONZA, SeaKem LE Agarose cat.5004) and plated onto 0.5% (w/v) basal agar.
Citation for published version (APA): Sivapalaratnam, S. (2012). The molecular basis of early onset cardiovascular disease
: Sivapalaratnam, S. (2012). The molecular basis of early onset cardiovascular disease") UvA-DARE (Digital Academic Repository) The molecular basis of early onset cardiovascular disease Sivapalaratnam, S. Link to publication Citation for published version (APA): Sivapalaratnam, S. (2012).
UvA-DARE (Digital Academic Repository) The molecular basis of early onset cardiovascular disease Sivapalaratnam, S. Link to publication Citation for published version (APA): Sivapalaratnam, S. (2012).
Supplementary Figure 1. Expression of EPO and EPOR during self-limited versus delayed
 Supplementary Figure 1. Expression of EPO and EPOR during self-limited versus delayed inflammation resolution. a: Flow cytometry analysis showing the electronic gating strategy used to identify peritoneal
ZL ZDF ZDF + E2 *** Visceral (g) ZDF
 ZDF") Body Weight (g) 4 3 2 1 ** * ZL ZDF 6 8 1 12 14 16 Age (weeks) B * Sub-cutaneous (g) 16 12 8 4 ZL ZDF Visceral (g) 25 2 15 1 5 ZL ZDF Total fat pad weight (g) 4 3 2 1 ZDF ZL Supplemental Figure 1: Effect
Body Weight (g) 4 3 2 1 ** * ZL ZDF 6 8 1 12 14 16 Age (weeks) B * Sub-cutaneous (g) 16 12 8 4 ZL ZDF Visceral (g) 25 2 15 1 5 ZL ZDF Total fat pad weight (g) 4 3 2 1 ZDF ZL Supplemental Figure 1: Effect
New Frontiers in Atherosclerotic Disease and Myocardial Infarction: From local inflammation to systemic stem and progenitor cell reaction
 New Frontiers in Atherosclerotic Disease and Myocardial Infarction: From local inflammation to systemic stem and progenitor cell reaction Matthias Nahrendorf MGH Center for Systems Biology http://csb.mgh.harvard.edu/investigator/matthias_nahrendorf
Nature Neuroscience: doi: /nn Supplementary Figure 1. Neuron class-specific arrangements of Khc::nod::lacZ label in dendrites.
 Supplementary Figure 1 Neuron class-specific arrangements of Khc::nod::lacZ label in dendrites. Staining with fluorescence antibodies to detect GFP (Green), β-galactosidase (magenta/white). (a, b) Class
Supplemental Information. Aryl Hydrocarbon Receptor Controls. Monocyte Differentiation. into Dendritic Cells versus Macrophages
 Immunity, Volume 47 Supplemental Information Aryl Hydrocarbon Receptor Controls Monocyte Differentiation into Dendritic Cells versus Macrophages Christel Goudot, Alice Coillard, Alexandra-Chloé Villani,
SUPPLEMENTARY INFORMATION
 b 350 300 250 200 150 100 50 0 E0 E10 E50 E0 E10 E50 E0 E10 E50 E0 E10 E50 Number of organoids per well 350 300 250 200 150 100 50 0 R0 R50 R100 R500 1st 2nd 3rd Noggin 100 ng/ml Noggin 10 ng/ml Noggin
Supplementary Information. Preferential associations between co-regulated genes reveal a. transcriptional interactome in erythroid cells
 Supplementary Information Preferential associations between co-regulated genes reveal a transcriptional interactome in erythroid cells Stefan Schoenfelder, * Tom Sexton, * Lyubomira Chakalova, * Nathan
Nature Neuroscience: doi: /nn Supplementary Figure 1
 Supplementary Figure 1 Subcellular segregation of VGluT2-IR and TH-IR within the same VGluT2-TH axon (wild type rats). (a-e) Serial sections of a dual VGluT2-TH labeled axon. This axon (blue outline) has
Supplementary Materials for
 www.sciencetranslationalmedicine.org/cgi/content/full/4/117/117ra8/dc1 Supplementary Materials for Notch4 Normalization Reduces Blood Vessel Size in Arteriovenous Malformations Patrick A. Murphy, Tyson
Supplementary Figure 1: STAT3 suppresses Kras-induced lung tumorigenesis
 Supplementary Figure 1: STAT3 suppresses Kras-induced lung tumorigenesis (a) Immunohistochemical (IHC) analysis of tyrosine 705 phosphorylation status of STAT3 (P- STAT3) in tumors and stroma (all-time
The 10 th International & 15 th National Congress on Quality Improvement in Clinical Laboratories
 The 10 th International & 15 th National Congress on Quality Improvement in Clinical Laboratories Cardiac biomarkers in atherosclerosis Najma Asadi MD-APCP Ross and Colleagues in 1973: Response to Injury
Supplementary Figure 1 (Related with Figure 4). Molecular consequences of Eed deletion. (a) ChIP analysis identifies 3925 genes that are associated
. Molecular consequences of Eed deletion. (a) ChIP analysis identifies 3925 genes that are associated") Supplementary Figure 1 (Related with Figure 4). Molecular consequences of Eed deletion. (a) ChIP analysis identifies 3925 genes that are associated with the H3K27me3 mark in chondrocytes (see Table S1,
Supplementary Figure 1 (Related with Figure 4). Molecular consequences of Eed deletion. (a) ChIP analysis identifies 3925 genes that are associated with the H3K27me3 mark in chondrocytes (see Table S1,
Role of Alpha-lipoic acid(ala) and statin in vascular smooth muscle cell proliferation
 and statin in vascular smooth muscle cell proliferation") Role of Alpha-lipoic acid(ala) and statin in vascular smooth muscle cell proliferation In-kyu Lee, M.D., Ph. D. Dept. of Internal Med, Keimyung Univ., School of Med. Taegu, Korea Oxidative Stress and Atherosclerosis
Role of Alpha-lipoic acid(ala) and statin in vascular smooth muscle cell proliferation In-kyu Lee, M.D., Ph. D. Dept. of Internal Med, Keimyung Univ., School of Med. Taegu, Korea Oxidative Stress and Atherosclerosis
Quantitative Imaging of Transmural Vasa Vasorum Distribution in Aortas of ApoE -/- /LDL -/- Double Knockout Mice using Nano-CT
 Quantitative Imaging of Transmural Vasa Vasorum Distribution in Aortas of ApoE -/- /LDL -/- Double Knockout Mice using Nano-CT M. Kampschulte 1, M.D.; A. Brinkmann 1, M.D.; P. Stieger 4, M.D.; D.G. Sedding
SUPPLEMENTARY INFORMATION
 doi:10.1038/nature12652 Supplementary Figure 1. PRDM16 interacts with endogenous EHMT1 in brown adipocytes. Immunoprecipitation of PRDM16 complex by flag antibody (M2) followed by Western blot analysis
Summary and concluding remarks
 Summary and concluding remarks This thesis is focused on the role and interaction of different cholesterol and phospholipid transporters. Cholesterol homeostasis is accomplished via a tightly regulated
Supplementary Figure 1.TRIM33 binds β-catenin in the nucleus. a & b, Co-IP of endogenous TRIM33 with β-catenin in HT-29 cells (a) and HEK 293T cells
 and HEK 293T cells") Supplementary Figure 1.TRIM33 binds β-catenin in the nucleus. a & b, Co-IP of endogenous TRIM33 with β-catenin in HT-29 cells (a) and HEK 293T cells (b). TRIM33 was immunoprecipitated, and the amount of
Supplementary Figure 1.TRIM33 binds β-catenin in the nucleus. a & b, Co-IP of endogenous TRIM33 with β-catenin in HT-29 cells (a) and HEK 293T cells (b). TRIM33 was immunoprecipitated, and the amount of
Supplementary Information
 Nature Immunology doi:1.138/ni.2477 Supplementary Information Capillary and arteriolar pericytes attract innate leukocytes exiting through venules and instruct them with pattern recognition and motility
The inhibition of CETP: From simply raising HDL-c to promoting cholesterol efflux and lowering of atherogenic lipoproteins Prof Dr J Wouter Jukema
 The inhibition of CETP: From simply raising HDL-c to promoting cholesterol efflux and lowering of atherogenic lipoproteins Prof Dr J Wouter Jukema Dept Cardiology, Leiden University Medical Center, Leiden,
Supplementary Figure 1. SC35M polymerase activity in the presence of Bat or SC35M NP encoded from the phw2000 rescue plasmid.
 1 2 3 4 5 6 7 8 9 10 11 12 13 14 15 16 17 18 19 20 21 22 23 24 25 26 27 Supplementary Figure 1. SC35M polymerase activity in the presence of Bat or SC35M NP encoded from the phw2000 rescue plasmid. HEK293T
fl/+ KRas;Atg5 fl/+ KRas;Atg5 fl/fl KRas;Atg5 fl/fl KRas;Atg5 Supplementary Figure 1. Gene set enrichment analyses. (a) (b)
 (b)") KRas;At KRas;At KRas;At KRas;At a b Supplementary Figure 1. Gene set enrichment analyses. (a) GO gene sets (MSigDB v3. c5) enriched in KRas;Atg5 fl/+ as compared to KRas;Atg5 fl/fl tumors using gene set
KRas;At KRas;At KRas;At KRas;At a b Supplementary Figure 1. Gene set enrichment analyses. (a) GO gene sets (MSigDB v3. c5) enriched in KRas;Atg5 fl/+ as compared to KRas;Atg5 fl/fl tumors using gene set
Nature Immunology: doi: /ni Supplementary Figure 1. Transcriptional program of the TE and MP CD8 + T cell subsets.
 Supplementary Figure 1 Transcriptional program of the TE and MP CD8 + T cell subsets. (a) Comparison of gene expression of TE and MP CD8 + T cell subsets by microarray. Genes that are 1.5-fold upregulated
Tcf21 MCM ; R26 mtmg Sham GFP Col 1/3 TAC 8W TAC 2W. Postn MCM ; R26 mtmg Sham GFP Col 1/3 TAC 8W TAC 2W
 A Tcf21 MCM ; R26 mtmg Sham GFP Col 1/3 Tcf21 MCM ; R26 mtmg TAC 2W Tcf21 MCM ; R26 mtmg TAC 8W B Postn MCM ; R26 mtmg Sham GFP Col 1/3 Postn MCM ; R26 mtmg TAC 2W Postn MCM ; R26 mtmg TAC 8W Supplementary
Using CART to Mine SELDI ProteinChip Data for Biomarkers and Disease Stratification
 Using CART to Mine SELDI ProteinChip Data for Biomarkers and Disease Stratification Kenna Mawk, D.V.M. Informatics Product Manager Ciphergen Biosystems, Inc. Outline Introduction to ProteinChip Technology
Supplementary Figure 1. Efficiency of Mll4 deletion and its effect on T cell populations in the periphery. Nature Immunology: doi: /ni.
 Supplementary Figure 1 Efficiency of Mll4 deletion and its effect on T cell populations in the periphery. Expression of Mll4 floxed alleles (16-19) in naive CD4 + T cells isolated from lymph nodes and
Supplementary Figure 1. IDH1 and IDH2 mutation site sequences on WHO grade III
 Supplementary Materials: Supplementary Figure 1. IDH1 and IDH2 mutation site sequences on WHO grade III patient samples. Genomic DNA samples extracted from punch biopsies from either FFPE or frozen tumor
Supplemental Figure 1. Western blot analysis indicated that MIF was detected in the fractions of
 Supplemental Figure Legends Supplemental Figure 1. Western blot analysis indicated that was detected in the fractions of plasma membrane and cytosol but not in nuclear fraction isolated from Pkd1 null
Histopathology: Cell necrosis and cytoplasmic accumulations
 Histopathology: Cell necrosis and cytoplasmic accumulations These presentations are to help you identify basic histopathological features. They do not contain the additional factual information that you
Nature Neuroscience: doi: /nn Supplementary Figure 1
 Supplementary Figure 1 Quantification of myelin fragments in the aging brain (a) Electron microscopy on corpus callosum is shown for a 18-month-old wild type mice. Myelin fragments (arrows) were detected
Postn MCM Smad2 fl/fl Postn MCM Smad3 fl/fl Postn MCM Smad2/3 fl/fl. Postn MCM. Tgfbr1/2 fl/fl TAC
 A Smad2 fl/fl Smad3 fl/fl Smad2/3 fl/fl Tgfbr1/2 fl/fl 1. mm B Tcf21 MCM Tcf21 MCM Smad3 fl/fl Tcf21 MCM Smad2/3 fl/fl Tcf21 MCM Tgfbr1/2 fl/fl αmhc MCM C 1. mm 1. mm D Smad2 fl/fl Smad3 fl/fl Smad2/3
Supplementary Figure 1 Transcription assay of nine ABA-responsive PP2C. Transcription assay of nine ABA-responsive PP2C genes. Total RNA was isolated
 Supplementary Figure 1 Transcription assay of nine ABA-responsive PP2C genes. Transcription assay of nine ABA-responsive PP2C genes. Total RNA was isolated from 7 day-old seedlings treated with or without
Lung Met 1 Lung Met 2 Lung Met Lung Met H3K4me1. Lung Met H3K27ac Primary H3K4me1
 a Gained Met-VELs 1.5 1.5 -.5 Lung Met 1 Lung Met Lung Met 3 1. Lung Met H3K4me1 Lung Met H3K4me1 1 Lung Met H3K4me1 Lung Met H3K7ac 1.5 Lung Met H3K7ac Lung Met H3K7ac.8 Primary H3K4me1 Primary H3K7ac
islets scored 1 week month months
 Supplementary Table 1. Sampling parameters for the morphometrical analyses Time (post- DT) Control mice (age-matched) α-cells mice pancreatic surface (mm 2 ) scored DT-treated mice islets scored mice pancreatic
Supplementary Table 1. The primers used for quantitative RT-PCR. Gene name Forward (5 > 3 ) Reverse (5 > 3 )
 Reverse (5 > 3 )") 770 771 Supplementary Table 1. The primers used for quantitative RT-PCR. Gene name Forward (5 > 3 ) Reverse (5 > 3 ) Human CXCL1 GCGCCCAAACCGAAGTCATA ATGGGGGATGCAGGATTGAG PF4 CCCCACTGCCCAACTGATAG TTCTTGTACAGCGGGGCTTG
770 771 Supplementary Table 1. The primers used for quantitative RT-PCR. Gene name Forward (5 > 3 ) Reverse (5 > 3 ) Human CXCL1 GCGCCCAAACCGAAGTCATA ATGGGGGATGCAGGATTGAG PF4 CCCCACTGCCCAACTGATAG TTCTTGTACAGCGGGGCTTG
Supplementary Figure 1. Deletion of Smad3 prevents B16F10 melanoma invasion and metastasis in a mouse s.c. tumor model.
 A B16F1 s.c. Lung LN Distant lymph nodes Colon B B16F1 s.c. Supplementary Figure 1. Deletion of Smad3 prevents B16F1 melanoma invasion and metastasis in a mouse s.c. tumor model. Highly invasive growth
Suppl Video: Tumor cells (green) and monocytes (white) are seeded on a confluent endothelial
 and monocytes (white) are seeded on a confluent endothelial") Supplementary Information Häuselmann et al. Monocyte induction of E-selectin-mediated endothelial activation releases VE-cadherin junctions to promote tumor cell extravasation in the metastasis cascade
Supplementary Information Häuselmann et al. Monocyte induction of E-selectin-mediated endothelial activation releases VE-cadherin junctions to promote tumor cell extravasation in the metastasis cascade
Supplementary Appendix
 Supplementary Appendix This appendix has been provided by the authors to give readers additional information about their work. Supplement to: Bredel M, Scholtens DM, Yadav AK, et al. NFKBIA deletion in