Supplementary Figure 1. Dynamic Response of WT and mir-21 -/- mice to caerulein. (a) Representative histological sections of mouse pancreas stained
|
|
|
- Lorena Carr
- 6 years ago
- Views:
Transcription
 Representative histological sections of mouse pancreas stained with hematoxylin from caerulein-treated WT and mir-21 -/- mice at day 3 (d3, n=5 per group) and day 7 (d7, n=5 per")
1 Supplementary Figure 1. Dynamic Response of WT and mir-21 -/- mice to caerulein. (a) Representative histological sections of mouse pancreas stained with hematoxylin from caerulein-treated WT and mir-21 -/- mice at day 3 (d3, n=5 per group) and day 7 (d7, n=5 per group) after the last dose of caerulein. Scale bars=200µm. (b) Percentage of necrotic cells. NS: not significant.
 Representative histological sections of lung stained with hematoxylin and eosin from caerulein-treated WT and mir-21 -/- mice at day 1 (d1, n=12 per group) after the last caerulein injection.")
2 Supplementary Figure 2. Knockout of mir-21 protects pancreatitisassociated lung injury in mice. (a) Representative histological sections of lung stained with hematoxylin and eosin from caerulein-treated WT and mir-21 -/- mice at day 1 (d1, n=12 per group) after the last caerulein injection. Scale bars=100µm. (b) MPO activity was measured as described in Materials and Methods. ** indicates a significant difference between WT and mir-21 -/- mice (P<0.01).
 and IL-4 (b). Values are mean±sd (n=5).")
3 Supplementary Figure 3. Response of WT and mir-21 -/- bone marrowderived macrophages (BMDMs) to LPS and IL-4. Real-time PCR analysis of gene expression in BMDMs isolated from WT and mir-21 -/- mice and treated with LPS (a) and IL-4 (b). Values are mean±sd (n=5). ** indicates a significant difference between WT and mir-21 -/- BMDMs treated with LPS or IL-4 (P<0.01).
4 Supplementary Figure 4: Analysis of circulating blood cells in mice transplanted with bone marrow cells isolated from WT or mir-21 -/- mice. (a) Leukocyte analysis. (b-f) show levels of chimerism in blood as determined by FACS. (b) Leukocytes (% of CD45.2 cells). (c) Granulocytes (% of CD45.2 among Gr-1 pos cells). (d) B-lymphocytes (% of CD45.2 among B220 pos cells). (e) T-lymphocytes (% of CD45.2 among CD3 pos cells). (f) Monocytes (% of CD45.2 among CD11b pos cells). There are no significant differences between mice transplanted from WT bone marrow and those transplanted from mir-21 -/- bone marrow.
5 Supplementary Figure 5: Gating for flow cytometry analysis of mice with transplantation. A representative gating image is shown for the analysis of donor derived cells (CD45.2) among (a) whole leukocyte population, (b) granulocytes, (c) B-cells, (d) T-cells and (e) monocytes.
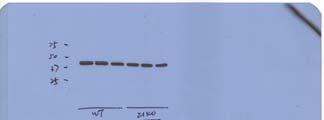
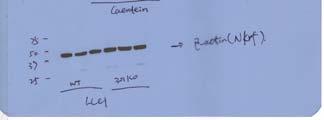
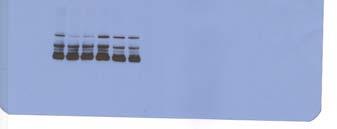
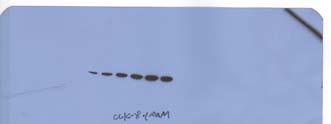
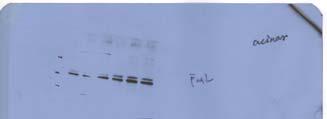
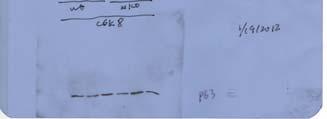
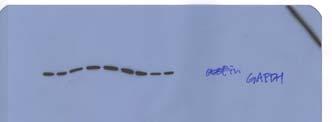
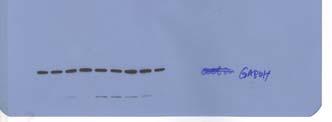
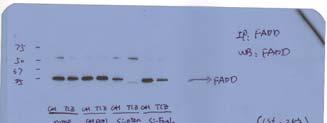
6 Supplementary Figure 6. The effects of mir-21 deletion on cholecystokinin receptor, A (CCKAR) and B (CCKBR). (a) Western blotting analyses of CCKAR and CCKBR expression in pancreata. Pancreata of WT and mir-21 -/- mice treated with caerulein were harvested at d1 after the last dose injection (each lane for one animal). (b) Acinar cells were treated with CCK-8 for 2, 4 and 6 h, and then CCKAR and CCKBR were measured using western blotting. (c) Acinar cells were treated with CCK-8 for 1, 2 and 4 h, and the supernatants were collected to measure the amylase activity as described in Materials and Methods. NS: not significant.
7 Supplementary Figure 7. Caspase 8 inhibition reverses the protective effect of mir-21 loss in acute pancreatitis induced by caerulein. (a) mir-21 -/- mice were intraperitoneally injected with z-vad-fmk (5mg kg 1 ) 1h before injection of caerulein (n=6 per group). At d1 after the last caerulein injection, pancreata were fixed and stained with hematoxylin. Scale bars=200µm. (b) Percentage of necrotic cells in (a). (c) mir-21 -/- mice were intraperitoneally injected with z- IETD-fmk (5mg kg 1 ) 1h before injection of caerulein (n=6 per group). At d1 after the last caerulein injection, pancreata were fixed and stained with hematoxylin. Scale bars=200µm. (d) Percentage of necrotic cells in (c). ** indicates a significant difference between the marked two groups (P<0.01).
 Representative histological sections of pancreata stained with hematoxylin from L-arginine (L-Arg)-treated WT and mir-21 -/- mice at day 3 (n=5 for untreated and PBS treated, n=7 for L-Arg).")
8 Supplementary Figure 8. mir-21 deletion protects L-arginine-induced acute pancreatitis. (a) Representative histological sections of pancreata stained with hematoxylin from L-arginine (L-Arg)-treated WT and mir-21 -/- mice at day 3 (n=5 for untreated and PBS treated, n=7 for L-Arg). Scale bars=200µm. (b) Serum amylase level in L-Arg-treated WT and mir-21 -/- mice at day 3 (n=5 for untreated and PBS, n=7 for L-Arg). (c) Serum lipase in L-Arg-treated WT and mir-21 -/- mice at day 3 (n=5 for untreated and PBS, n=7 for L-Arg). (d) Percentage of necrotic cells. ** P<0.01 indicates significant difference between WT and mir-21 -/- groups.
 Representative histological sections of pancreata stained with hematoxylin from caerulein or caerulein plus FasL treated WT mice (n=5 for each group).")
9 Supplementary Figure 9. The impact of FasL on caerulein-induced pancreatitis in WT or mir-21 -/- mice. (a) Representative histological sections of pancreata stained with hematoxylin from caerulein or caerulein plus FasL treated WT mice (n=5 for each group). FasL was mixed with caerulein, and intraperitoneally injected into mice. Scale bars=200µm. (b) Percentage of necrotic cells. (d) Representative histological sections of pancreata stained with hematoxylin from caerulein or caerulein+mfl3 treated mir-21 -/- mice (n=5 for each group). MFL3 (200μg) was injected intravenously 15min before injection of caerulein. Scale bars=200µm. (d) Percentage of necrotic cells. NS: not significant.
 Representative histological sections of pancreata stained with hematoxylin from caerulein or caerulein+necrostatin-1 (Nec-1) treated WT and mir-21 -/- mice (n = 5 for each group). Nec-1 (1.")
10 Supplementary Figure 10. The effect of necrostatin-1 on caerulein-induced pancreatitis in WT and mir-21 -/- mice. (a) Representative histological sections of pancreata stained with hematoxylin from caerulein or caerulein+necrostatin-1 (Nec-1) treated WT and mir-21 -/- mice (n = 5 for each group). Nec-1 (1.65 mg kg 1 ) was injected intraperitoneally in WT and mir-21 -/- mice with caerulein. Scale bars = 200µm. (b) Percentage of necrotic cells s. * P<0.05 and ** P<0.01 indicate a significant difference between the marked groups. NS: not significant.
, kidney (c), and liver (e) stained with hematoxylin and eosin 3 h after TNF-α or TNF-α+necrostatin-1(Nec-1) injection")
.")
11 Supplementary Figure 11. The effect of necrostatin-1 on TNFα-induced shock in WT and mir-21 -/- mice. Representative histological sections of ileum (a), kidney (c), and liver (e) stained with hematoxylin and eosin 3 h after TNF-α or TNF-α+necrostatin-1(Nec-1) injection in WT and mir-21 -/- mice. Nec-1(125 μg) was delivered intravenously 15 min before injection of TNFα. Scale bars = 200 µm for ileum and 100 µm for kidney and liver (n=5 for both PBS and treated groups). Tissue damage scores for ileum (b), kidney (d) and liver (f) were evaluated. *P<0.05 indicate significant difference between WT and mir-21 -/- mice treated with TNF-α or TNFα+Nec1. NS: not significant.


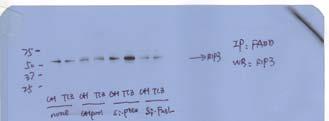
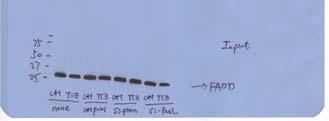
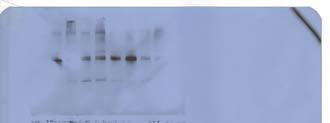
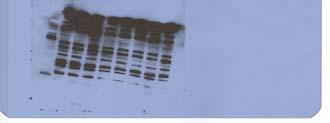
12 Supplemental Figure 12. Unedited scan for all Western blotting images. White arrow and dashed line box show the lanes of the unedited gel correspond to those shown in the cropped images used in figures and supplementary figures. Full unedited gel for Figure 3e RIP1 Full unedited gel for Figure 3e RIP3 Full unedited gel for Figure 3e FADD 1 Full unedited gel for Figure 3e FADD 2 Full unedited gel for Figure 3e GAPDH 1


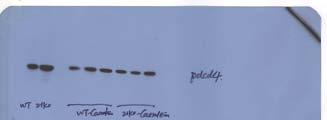


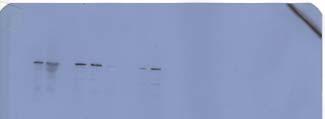
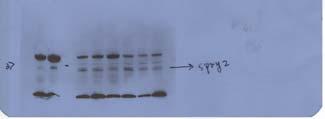
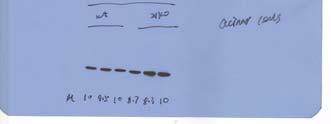
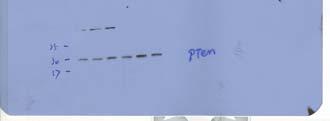
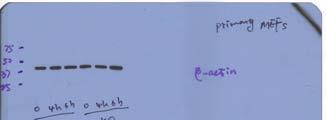
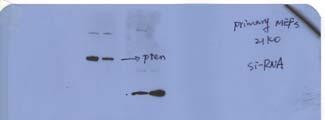
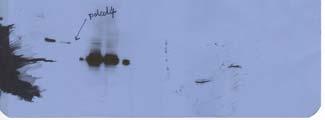
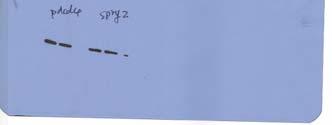
13 Full unedited gel for Figure 3e GAPDH 2 Full unedited gel for Figure 3f PTEN 1 GAPDH 75 Full unedited gel for Figure 3f PTEN 2 Full unedited gel for Figure 3f PDCD Full unedited gel for Figure 3f FasL Full unedited gel for Figure 3f Spry2


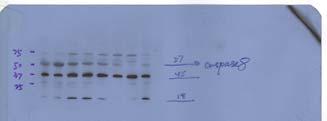


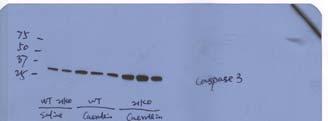

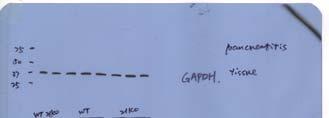

14 Full unedited gel for Figure 3f Bcl 2 Full unedited gel for Figure 3f GAPDH 10 Full unedited gel for Figure 3g Total Caspase8 Full unedited gel for Figure 3g p43(cleaved Caspase8) Full unedited gel for Figure 3g Total Caspase3 Full unedited gel for Figure 3g GAPDH


15 Full unedited gel for Figure 3k RIP1 Full unedited gel for Figure 3k RIP3 Full unedited gel for Figure 3k FADD Full unedited gel for Figure 3k GAPDH 25 Full unedited gel for Figure 3l Pten Full unedited gel for Figure 3l FasL


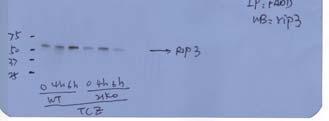
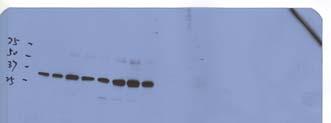
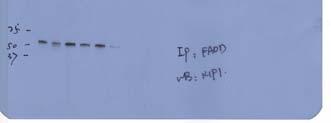
16 Full unedited gel for Figure 3l GAPDH Full unedited gel for Figure 4b Pten 75 Full unedited gel for Figure 4b FasL Full unedited gel for Figure 4b GAPDH Full unedited gel for Figure 6e IP:FADD; WB:RIP3 Full unedited gel for Figure 6e IP:FADD; WB:RIP1


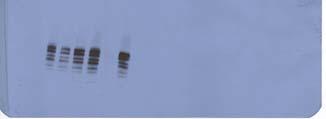

17 Full unedited gel for Figure 6e IP:FADD; WB:FADD Full unedited gel for Figure 6e Input:RIP3 Full unedited gel for Figure 6e Input:RIP1 Full unedited gel for Figure 6e Input:FADD 75 Full unedited gel for Figure 6e Input:β actin Full unedited gel for Figure 6f Pten 75


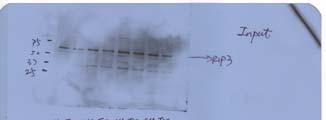

18 Full unedited gel for Figure 6f FasL Full unedited gel for Figure 6f β actin Full unedited gel for Figure 6h IP:FADD;WB:RIP3 Full unedited gel for Figure 6h IP:FADD;WB:RIP1 75 Full unedited gel for Figure 6h IP:FADD;WB:FADD Full unedited gel for Figure 6h Input:RIP3


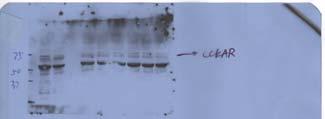

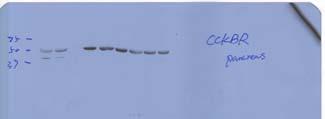
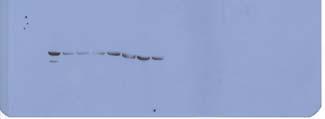
19 Full unedited gel for Figure 6h Input:RIP1 Full unedited gel for Figure 6H Input:FADD 75 Full unedited gel for Figure 6h Input:β actin Full unedited gel for Supplementary Figure 7a CCKAR Full unedited gel for Supplementary Figure 7a CCKBR Full unedited gel for Supplementary Figure 7a GAPDH


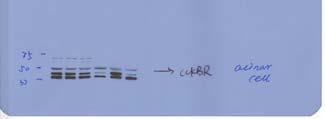
20 Full unedited gel for Supplementary Figure 7b CCKAR Full unedited gel for Supplementary Figure 7b CCKBR 75 Full unedited gel for Supplementary Figure 7b GAPDH
21 Supplementary Table 1. Primer sequences of M1 and M2 genes in real-time PCR analysis Gene name Forward Reverse IL12A ccatcagcagatcattctagacaa cgccattatgattcagagactg IL23 tccctactaggactcagccaac tgggcatctgttgggtct IL6 gctaccaaactggatataatcagga ccaggtagctatggtactccagaa TNFa tcttctcattcctgcttgtgg ggtctgggccatagaactga IL1b tgtaatgaaagacggcacacc tcttctttgggtattgcttgg CXCL9 cttttcctcttgggcatcat gcatcgtgcattccttatca CXCL10 gctgccgtcattttctgc tctcactggcccgtcatc H2-Ab1 gtggtgctgatggtgctg ccatgaactggtacacgaaatg CD86 gaagccgaatcagcctagc cagcgttactatcccgctct NOS2 gggctgtcacggagatca ccatgatggtcacattctgc PTGS2 gatgctcttccgagctgtg ggattggaacagcaaggattt ARG1 cctgaaggaactgaaaggaaag ttggcagatatgcagggagt CD163 tctcagtgcctctgctgtca cgccagtctcagttccttct CSF1 caacagctttgctaagtgctcta cactgctaggggtggcttta IL10 cagagccacatgctcctaga gtccagctggtcctttgttt MMP9 acgacatagacggcatcca gctgtggttcagttgtggtg MRC1 ccacagcattgaggagtttg acagctcatcatttggctca VEGFA aaaaacgaaagcgcaagaaa tttctccgctctgaacaagg CCL22 tcttgctgtggcaattcaga gagggtgacggatgtagtcc IFNG atctggaggaactggcaaaa ttcaagacttcaaagagtctgaggta CCL17 tgcttctggggacttttctg gaatggcccctttgaagtaa ACTB ctaaggccaaccgtgaaaag accagaggcatacagggaca
Supplementary Figure 1: TSLP receptor skin expression in dcssc. A: Healthy control (HC) skin with TSLP receptor expression in brown (10x
 skin with TSLP receptor expression in brown (10x") Supplementary Figure 1: TSLP receptor skin expression in dcssc. A: Healthy control (HC) skin with TSLP receptor expression in brown (10x magnification). B: Second HC skin stained for TSLP receptor in brown
Supplementary Figure 1: TSLP receptor skin expression in dcssc. A: Healthy control (HC) skin with TSLP receptor expression in brown (10x magnification). B: Second HC skin stained for TSLP receptor in brown
Bezzi et al., Supplementary Figure 1 *** Nature Medicine: doi: /nm Pten pc-/- ;Zbtb7a pc-/- Pten pc-/- ;Pml pc-/- Pten pc-/- ;Trp53 pc-/-
 Gr-1 Gr-1 Gr-1 Bezzi et al., Supplementary Figure 1 a Gr1-CD11b 3 months Spleen T cells 3 months Spleen B cells 3 months Spleen Macrophages 3 months Spleen 15 4 8 6 c CD11b+/Gr1+ cells [%] 1 5 b T cells
Supplementary Figure 1. Antibiotic partially rescues mice from sepsis. (ab) BALB/c mice under CLP were treated with antibiotic or PBS.
 BALB/c mice under CLP were treated with antibiotic or PBS.") 1 Supplementary Figure 1. Antibiotic partially rescues mice from sepsis. (ab) BALB/c mice under CLP were treated with antibiotic or PBS. (a) Survival curves. WT Sham (n=5), WT CLP or WT CLP antibiotic
1 Supplementary Figure 1. Antibiotic partially rescues mice from sepsis. (ab) BALB/c mice under CLP were treated with antibiotic or PBS. (a) Survival curves. WT Sham (n=5), WT CLP or WT CLP antibiotic
Programmed necrosis, not apoptosis, is a key mediator of cell loss and DAMP-mediated inflammation in dsrna-induced retinal degeneration
 Programmed necrosis, not apoptosis, is a key mediator of cell loss and DAMP-mediated inflammation in dsrna-induced retinal degeneration The Harvard community has made this article openly available. Please
Supplementary Figure 1. mrna expression of chitinase and chitinase-like protein in splenic immune cells. Each splenic immune cell population was
 Supplementary Figure 1. mrna expression of chitinase and chitinase-like protein in splenic immune cells. Each splenic immune cell population was sorted by FACS. Surface markers for sorting were CD11c +
Supplementary fig. 1. Crystals induce necroptosis does not involve caspases, TNF receptor or NLRP3. A. Mouse tubular epithelial cells were pretreated
 Supplementary fig. 1. Crystals induce necroptosis does not involve caspases, TNF receptor or NLRP3. A. Mouse tubular epithelial cells were pretreated with zvad-fmk (10µM) and exposed to calcium oxalate
Supplementary Figures for TSC1 controls macrophage polarization to prevent inflammatory disorder by Linnan Zhu et al
 Supplementary Figures for TSC1 controls macrophage polarization to prevent inflammatory disorder by Linnan Zhu et al Suppl. Fig. 1 Tissue DN C Proteins kd TSC1-17 TSC 1 loxp bp -48-285 ctin PEMs Neutrophils
Supplementary Figure 1. Expression of CUGBP1 in non-parenchymal liver cells treated with TGF-β
 Supplementary Figures Supplementary Figure 1. Expression of CUGBP1 in non-parenchymal liver cells treated with TGF-β and LPS. Non-parenchymal liver cells were isolated and treated with or without TGF-β
SUPPLEMENTARY METHODS
 SUPPLEMENTARY METHODS Histological analysis. Colonic tissues were collected from 5 parts of the middle colon on day 7 after the start of DSS treatment, and then were cut into segments, fixed with 4% paraformaldehyde,
Type of file: PDF Title of file for HTML: Supplementary Information Description: Supplementary Figures
 Type of file: PDF Title of file for HTML: Supplementary Information Description: Supplementary Figures Type of file: MOV Title of file for HTML: Supplementary Movie 1 Description: NLRP3 is moving along
Supplementary information. The proton-sensing G protein-coupled receptor T-cell death-associated gene 8
 1 Supplementary information 2 3 The proton-sensing G protein-coupled receptor T-cell death-associated gene 8 4 (TDAG8) shows cardioprotective effects against myocardial infarction 5 Akiomi Nagasaka 1+,
Supplemental Figure 1. (A) Western blot for the expression of RIPK1 in HK-2 cells treated with or without LPS (1 µg/ml) for indicated times.
 Western blot for the expression of RIPK1 in HK-2 cells treated with or without LPS (1 µg/ml) for indicated times.") Supplemental Figure 1. (A) Western blot for the expression of RIPK1 in HK-2 cells treated with or without LPS (1 µg/ml) for indicated times. Western blots shown are representative results from 3 independent
Supplemental Figure 1. (A) Western blot for the expression of RIPK1 in HK-2 cells treated with or without LPS (1 µg/ml) for indicated times. Western blots shown are representative results from 3 independent
Title of file for HTML: Supplementary Information Description: Supplementary Figures and Supplementary Table
 Title of file for HTML: Supplementary Information Description: Supplementary Figures and Supplementary Table Title of file for HTML: Peer Review File Description: Innate Scavenger Receptor-A regulates
Supplemental Materials for. Effects of sphingosine-1-phosphate receptor 1 phosphorylation in response to. FTY720 during neuroinflammation
 Supplemental Materials for Effects of sphingosine-1-phosphate receptor 1 phosphorylation in response to FTY7 during neuroinflammation This file includes: Supplemental Table 1. EAE clinical parameters of
Supplemental Table 1. Primers used for RT-PCR analysis of inflammatory cytokines Gene Primer Sequence
 Supplemental Table 1. Primers used for RT-PCR analysis of inflammatory cytokines Gene Primer Sequence IL-1α Forward primer 5 -CAAGATGGCCAAAGTTCGTGAC-3' Reverse primer 5 -GTCTCATGAAGTGAGCCATAGC-3 IL-1β
well for 2 h at rt. Each dot represents an individual mouse and bar is the mean ±
 Supplementary data: Control DC Blimp-1 ko DC 8 6 4 2-2 IL-1β p=.5 medium 8 6 4 2 IL-2 Medium p=.16 8 6 4 2 IL-6 medium p=.3 5 4 3 2 1-1 medium IL-1 n.s. 25 2 15 1 5 IL-12(p7) p=.15 5 IFNγ p=.65 4 3 2 1
Supplementary Figures
 Supplementary Figures Supplementary Fig. 1. Galectin-3 is present within tumors. (A) mrna expression levels of Lgals3 (galectin-3) and Lgals8 (galectin-8) in the four classes of cell lines as determined
Page 39 of 44. 8h LTA & AT h PepG & AT h LTA
 Page 39 of 44 Fig. S1 A: B: C: D: 8h LTA 8h LTA & AT7519 E: F: 8h PepG G: 8h PepG & AT7519 Fig. S1. AT7519 overrides the survival effects of lipoteichoic acid (LTA) and peptidoglycan (PepG). (A) Human
Title. CitationCancer science, 109(4): Issue Date Doc URL. Rights(URL)
: Issue Date Doc URL. Rights(URL)") Title Toll-like receptor 3 signal augments radiation-induc Yoshida, Sumito; Shime, Hiroaki; Takeda, Yohei; Nam, Author(s) Hiroki; Kasahara, Masanori; Seya, Tsukasa CitationCancer science, 19(): 956-965
Title Toll-like receptor 3 signal augments radiation-induc Yoshida, Sumito; Shime, Hiroaki; Takeda, Yohei; Nam, Author(s) Hiroki; Kasahara, Masanori; Seya, Tsukasa CitationCancer science, 19(): 956-965
Nature Immunology: doi: /ni Supplementary Figure 1. Production of cytokines and chemokines after vaginal HSV-2 infection.
 Supplementary Figure 1 Production of cytokines and chemokines after vaginal HSV-2 infection. C57BL/6 mice were (a) treated intravaginally with 20 µl of PBS or infected with 6.7x10 4 pfu of HSV-2 in the
Supplementary material page 1/10
 Supplementary Figure 1. Metoprolol administration during ongoing AMI reduces MVO in STEMI patients (a, b) Complete representative CMR exams (short-axis covering the entire left ventricle (LV) from base
SOPten flox/flox (KO) Pten flox/flox (WT) flox allele 6.0 kb. Pten. Actin. ! allele 2.3 kb. Supplementary Figure S1. Yanagi, et al.
 Pten flox/flox (WT) flox allele 6.0 kb. Pten. Actin. ! allele 2.3 kb. Supplementary Figure S1. Yanagi, et al.") s1 A Pten flox/flox () SOPten flox/flox () flox allele 6. kb B Pten flox/flox () SOPten flox/flox () Pten Actin! allele 2.3 kb Supplementary Figure S1. Yanagi, et al. A B BrdU BrdU positive cells ( ) 3
s1 A Pten flox/flox () SOPten flox/flox () flox allele 6. kb B Pten flox/flox () SOPten flox/flox () Pten Actin! allele 2.3 kb Supplementary Figure S1. Yanagi, et al. A B BrdU BrdU positive cells ( ) 3
Suppl Video: Tumor cells (green) and monocytes (white) are seeded on a confluent endothelial
 and monocytes (white) are seeded on a confluent endothelial") Supplementary Information Häuselmann et al. Monocyte induction of E-selectin-mediated endothelial activation releases VE-cadherin junctions to promote tumor cell extravasation in the metastasis cascade
Supplementary Information Häuselmann et al. Monocyte induction of E-selectin-mediated endothelial activation releases VE-cadherin junctions to promote tumor cell extravasation in the metastasis cascade
Supplementary Figure 1 Chemokine and chemokine receptor expression during muscle regeneration (a) Analysis of CR3CR1 mrna expression by real time-pcr
 Analysis of CR3CR1 mrna expression by real time-pcr") Supplementary Figure 1 Chemokine and chemokine receptor expression during muscle regeneration (a) Analysis of CR3CR1 mrna expression by real time-pcr at day 0, 1, 4, 10 and 21 post- muscle injury. (b)
Supplementary Figure 1 Chemokine and chemokine receptor expression during muscle regeneration (a) Analysis of CR3CR1 mrna expression by real time-pcr at day 0, 1, 4, 10 and 21 post- muscle injury. (b)
Supplementary Figure 1.
 Supplementary Figure 1. Female Pro-ins2 -/- mice at 5-6 weeks of age were either inoculated i.p. with a single dose of CVB4 (1x10 5 PFU/mouse) or PBS and treated with αgalcer or control vehicle. On day
SHREE ET AL, SUPPLEMENTAL MATERIALS. (A) Workflow for tumor cell line derivation and orthotopic implantation.
 Workflow for tumor cell line derivation and orthotopic implantation.") SHREE ET AL, SUPPLEMENTAL MATERIALS SUPPLEMENTAL FIGURE AND TABLE LEGENDS Supplemental Figure 1. Derivation and characterization of TS1-TGL and TS2-TGL PyMT cell lines and development of an orthotopic
SHREE ET AL, SUPPLEMENTAL MATERIALS SUPPLEMENTAL FIGURE AND TABLE LEGENDS Supplemental Figure 1. Derivation and characterization of TS1-TGL and TS2-TGL PyMT cell lines and development of an orthotopic
Targeting tumour associated macrophages in anti-cancer therapies. Annamaria Gal Seminar Series on Drug Discovery Budapest 5 January 2018
 Targeting tumour associated macrophages in anti-cancer therapies Annamaria Gal Seminar Series on Drug Discovery Budapest 5 January 2018 Macrophages: Professional phagocytes of the myeloid lineage APC,
ONLINE SUPPLEMENT MATERIAL. CD70 limits atherosclerosis and promotes macrophage function.
 ONLINE SUPPLEMENT MATERIAL CD7 limits atherosclerosis and promotes macrophage function. Holger Winkels* 1,2, Svenja Meiler* 1,2, Esther Smeets* 2, Dirk Lievens 1, David Engel 3, Charlotte Spitz 1, Christina
Supplementary Figure S1. Flow cytometric analysis of the expression of Thy1 in NH cells. Flow cytometric analysis of the expression of T1/ST2 and
 Supplementary Figure S1. Flow cytometric analysis of the expression of Thy1 in NH cells. Flow cytometric analysis of the expression of T1/ST2 and Thy1 in NH cells derived from the lungs of naïve mice.
Eosinophils! 40! 30! 20! 10! 0! NS!
 A Macrophages Lymphocytes Eosinophils Neutrophils Percentage (%) 1 ** 4 * 1 1 MMA SA B C Baseline FEV1, % predicted 15 p = 1.11 X 10⁻⁹ 5 CD4:CD8 ratio 1 Supplemental Figure 1. Cellular infiltrate in the
Supplementary Figure 1. NAFL enhanced immunity of other vaccines (a) An over-the-counter, hand-held non-ablative fractional laser (NAFL).
 An over-the-counter, hand-held non-ablative fractional laser (NAFL).") Supplementary Figure 1. NAFL enhanced immunity of other vaccines (a) An over-the-counter, hand-held non-ablative fractional laser (NAFL). (b) Depiction of a MTZ array generated by NAFL. (c-e) IgG production
Supplementary Figure 1. NAFL enhanced immunity of other vaccines (a) An over-the-counter, hand-held non-ablative fractional laser (NAFL). (b) Depiction of a MTZ array generated by NAFL. (c-e) IgG production
MicroRNAs Modulate the Noncanonical NF- B Pathway by Regulating IKK Expression During Macrophage Differentiation
 MicroRNAs Modulate the Noncanonical NF- B Pathway by Regulating IKK Expression During Macrophage Differentiation Tao Li 1 *, Michael J. Morgan 1 *, Swati Choksi 1, Yan Zhang 1, You-Sun Kim 2#, Zheng-gang
Supplementary Figure 1. Generation of knockin mice expressing L-selectinN138G. (a) Schematics of the Sellg allele (top), the targeting vector, the
 Schematics of the Sellg allele (top), the targeting vector, the") Supplementary Figure 1. Generation of knockin mice expressing L-selectinN138G. (a) Schematics of the Sellg allele (top), the targeting vector, the targeted allele in ES cells, and the mutant allele in
Supplementary Figure 1. Generation of knockin mice expressing L-selectinN138G. (a) Schematics of the Sellg allele (top), the targeting vector, the targeted allele in ES cells, and the mutant allele in
Supplementary Figure 1
 Combination index (CI) Supplementary Figure 1 2. 1.5 1. Ishikawa AN3CA Nou-1 Hec-18.5...2.4.6.8 1. Fraction affected (Fa) Supplementary Figure 1. The synergistic effect of PARP inhibitor and PI3K inhibitor
a. b. c. d. e. f. g. h. i. j. k. l. m. n. o. p.
 a. b. c. d. e. f. g. h. i. j. k. l. 2.5 2 1.5 1.5 IL-1β 12 8 6 4 2 IL-1β 9 8 7 6 4 3 3 2.9 IL-1β m. n. o. p. 1.8 1.6 1.4 1.2 1.8.6.4.2 6h LPS 2 15 1 5 6h LPS 2 6h LPS 6 4 3 6h LPS Supplementary Figure
Supporting Information
 Supporting Information M1 macrophage-derived nanovesicles potentiate the anticancer efficacy of immune checkpoint inhibitors Yeon Woong Choo, 1, Mikyung Kang, 2, Han Young Kim, 1 Jin Han, 1 Seokyung Kang,
Nature Immunology: doi: /ni Supplementary Figure 1. Cellularity of leukocytes and their progenitors in naive wild-type and Spp1 / mice.
 Supplementary Figure 1 Cellularity of leukocytes and their progenitors in naive wild-type and Spp1 / mice. (a, b) Gating strategies for differentiated cells including PMN (CD11b + Ly6G hi and CD11b + Ly6G
Supplementary methods:
 Supplementary methods: Primers sequences used in real-time PCR analyses: β-actin F: GACCTCTATGCCAACACAGT β-actin [11] R: AGTACTTGCGCTCAGGAGGA MMP13 F: TTCTGGTCTTCTGGCACACGCTTT MMP13 R: CCAAGCTCATGGGCAGCAACAATA
Supplemental Figure 1. Signature gene expression in in vitro differentiated Th0, Th1, Th2, Th17 and Treg cells. (A) Naïve CD4 + T cells were cultured
 Naïve CD4 + T cells were cultured") Supplemental Figure 1. Signature gene expression in in vitro differentiated Th0, Th1, Th2, Th17 and Treg cells. (A) Naïve CD4 + T cells were cultured under Th0, Th1, Th2, Th17, and Treg conditions. mrna
Supplemental Figure 1. Signature gene expression in in vitro differentiated Th0, Th1, Th2, Th17 and Treg cells. (A) Naïve CD4 + T cells were cultured under Th0, Th1, Th2, Th17, and Treg conditions. mrna
Supplementary Information
 Supplementary Information TABLE S1. SUBJECT CHARACTERISTICS* Normal Control Subjects Subjects with Asthma p Value Number 23 48 Age (years) 35±10 35±10 0.75 Sex, M:F (% F) 9:12 (57) 17:26 (60) 0.76 FEV1
Supplementary Figures
 Supplementary Figures mir-150 regulates obesityassociated insulin resistance by controlling B cell functions Wei Ying, Alexander Tseng, Richard Cheng-An Chang, Haiqing Wang, Yu-lieh Lin, Srikanth Kanameni,
Nature Immunology doi: /ni.3268
 Supplementary Figure 1 Loss of Mst1 and Mst2 increases susceptibility to bacterial sepsis. (a) H&E staining of colon and kidney sections from wild type and Mst1 -/- Mst2 fl/fl Vav-Cre mice. Scale bar,
Figure SⅠ: Expression of mir-155, mir-122 and mir-196a in allografts compared with
 Figure SⅠ: Expression of mir-155, mir-122 and mir-196a in allografts compared with isografts (control) at the 2nd week, 4th and 8th week by RT-PCR. At the advanced stage, the expression of these three
Nature Immunology: doi: /ni Supplementary Figure 1. Cytokine pattern in skin in response to urushiol.
 Supplementary Figure 1 Cytokine pattern in skin in response to urushiol. Wild-type (WT) and CD1a-tg mice (n = 3 per group) were sensitized and challenged with urushiol (uru) or vehicle (veh). Quantitative
Supplementary Figure S I: Effects of D4F on body weight and serum lipids in apoe -/- mice.
 Supplementary Figures: Supplementary Figure S I: Effects of D4F on body weight and serum lipids in apoe -/- mice. Male apoe -/- mice were fed a high-fat diet for 8 weeks, and given PBS (model group) or
Supplementary Figure 1
 Supplementary Figure 1 a Percent of body weight! (%) 4! 3! 1! Epididymal fat Subcutaneous fat Liver SD Percent of body weight! (%) ** 3! 1! SD Percent of body weight! (%) 6! 4! SD ** b Blood glucose (mg/dl)!
Figure S1. Sorting nexin 9 (SNX9) specifically binds psmad3 and not psmad 1/5/8. Lysates from AKR-2B cells untreated (-) or stimulated (+) for 45 min
 specifically binds psmad3 and not psmad 1/5/8. Lysates from AKR-2B cells untreated (-) or stimulated (+) for 45 min") Figure S1. Sorting nexin 9 (SNX9) specifically binds psmad3 and not psmad 1/5/8. Lysates from AKR2B cells untreated () or stimulated () for 45 min with 5 ng/ml TGFβ or 10 ng/ml BMP4 were incubated with
Figure S1. Sorting nexin 9 (SNX9) specifically binds psmad3 and not psmad 1/5/8. Lysates from AKR2B cells untreated () or stimulated () for 45 min with 5 ng/ml TGFβ or 10 ng/ml BMP4 were incubated with
Toluidin-Staining of mast cells Ear tissue was fixed with Carnoy (60% ethanol, 30% chloroform, 10% acetic acid) overnight at 4 C, afterwards
 overnight at 4 C, afterwards") Toluidin-Staining of mast cells Ear tissue was fixed with Carnoy (60% ethanol, 30% chloroform, 10% acetic acid) overnight at 4 C, afterwards incubated in 100 % ethanol overnight at 4 C and embedded in
Toluidin-Staining of mast cells Ear tissue was fixed with Carnoy (60% ethanol, 30% chloroform, 10% acetic acid) overnight at 4 C, afterwards incubated in 100 % ethanol overnight at 4 C and embedded in
Pathologic Stage. Lymph node Stage
 ASC ASC a c Patient ID BMI Age Gleason score Non-obese PBMC 1 22.1 81 6 (3+3) PBMC 2 21.9 6 6 (3+3) PBMC 3 22 84 8 (4+4) PBMC 4 24.6 68 7 (3+4) PBMC 24. 6 (3+3) PBMC 6 24.7 73 7 (3+4) PBMC 7 23. 67 7 (3+4)
Supplementary Figures
 Supplementary Figures Supplementary Figure 1 Characterization of stable expression of GlucB and sshbira in the CT26 cell line (a) Live cell imaging of stable CT26 cells expressing green fluorescent protein
Supplementary table I. Real-time primers used in the study. The fold change was obtained by
 Supplementary table I. Real-time primers used in the study. The fold change was obtained by normalizing the gene expression number to those of HPRT, then comparing the samples to untreated or naive mice.
IL-6Rα IL-6RαT-KO KO. IL-6Rα f/f bp. f/f 628 bp deleted 368 bp. 500 bp
 STD H 2 O WT KO IL-6Rα f/f IL-6Rα IL-6RαT-KO KO 1000 bp 500 bp f/f 628 bp deleted 368 bp Supplementary Figure 1 Confirmation of T-cell IL-6Rα deficiency. (a) Representative histograms and (b) quantification
SUPPLEMENTARY INFORMATION
 Supplemental Figure 1. Furin is efficiently deleted in CD4 + and CD8 + T cells. a, Western blot for furin and actin proteins in CD4cre-fur f/f and fur f/f Th1 cells. Wild-type and furin-deficient CD4 +
Supplementary Table 1. List of primers used in this study
 Supplementary Table 1. List of primers used in this study Gene Forward primer Reverse primer Rat Met 5 -aggtcgcttcatgcaggt-3 5 -tccggagacacaggatgg-3 Rat Runx1 5 -cctccttgaaccactccact-3 5 -ctggatctgcctggcatc-3
Relative SOD1 activity. Relative SOD2 activity. Relative SOD activity (Infected:Mock) + CP + DDC
 + CP + DDC") Supplementary Figure 1. SOD1 activity is significantly increased relative to SOD1 levels. SOD1 and SOD2 activities in the infected mork13 cells are shown normalised to their corresponding levels and relative
Supplementary Figure 1. SOD1 activity is significantly increased relative to SOD1 levels. SOD1 and SOD2 activities in the infected mork13 cells are shown normalised to their corresponding levels and relative
Figure S1. Reduction in glomerular mir-146a levels correlate with progression to higher albuminuria in diabetic patients.
 Supplementary Materials Supplementary Figures Figure S1. Reduction in glomerular mir-146a levels correlate with progression to higher albuminuria in diabetic patients. Figure S2. Expression level of podocyte
Supplementary Material
 Supplementary Material Summary: The supplementary information includes 1 table (Table S1) and 4 figures (Figure S1 to S4). Supplementary Figure Legends Figure S1 RTL-bearing nude mouse model. (A) Tumor
Supplementary Information. Tissue-wide immunity against Leishmania. through collective production of nitric oxide
 Supplementary Information Tissue-wide immunity against Leishmania through collective production of nitric oxide Romain Olekhnovitch, Bernhard Ryffel, Andreas J. Müller and Philippe Bousso Supplementary
Supplementary Figure 1. Deletion of Smad3 prevents B16F10 melanoma invasion and metastasis in a mouse s.c. tumor model.
 A B16F1 s.c. Lung LN Distant lymph nodes Colon B B16F1 s.c. Supplementary Figure 1. Deletion of Smad3 prevents B16F1 melanoma invasion and metastasis in a mouse s.c. tumor model. Highly invasive growth
SUPPLEMENTARY INFORMATION
 doi:1.138/nature1554 a TNF-α + in CD4 + cells [%] 1 GF SPF 6 b IL-1 + in CD4 + cells [%] 5 4 3 2 1 Supplementary Figure 1. Effect of microbiota on cytokine profiles of T cells in GALT. Frequencies of TNF-α
L1 on PyMT tumor cells but Py117 cells are more responsive to IFN-γ. (A) Flow
 Flow") A MHCI B PD-L1 Fold expression 8 6 4 2 Fold expression 3 2 1 No tx 1Gy 2Gy IFN Py117 Py117 Supplementary Figure 1. Radiation and IFN-γ enhance MHCI expression and PD- L1 on PyMT tumor cells but Py117 cells
A MHCI B PD-L1 Fold expression 8 6 4 2 Fold expression 3 2 1 No tx 1Gy 2Gy IFN Py117 Py117 Supplementary Figure 1. Radiation and IFN-γ enhance MHCI expression and PD- L1 on PyMT tumor cells but Py117 cells
Supplementary Figure 1: Expression of NFAT proteins in Nfat2-deleted B cells (a+b) Protein expression of NFAT2 (a) and NFAT1 (b) in isolated splenic
 Protein expression of NFAT2 (a) and NFAT1 (b) in isolated splenic") Supplementary Figure 1: Expression of NFAT proteins in Nfat2-deleted B cells (a+b) Protein expression of NFAT2 (a) and NFAT1 (b) in isolated splenic B cells from WT Nfat2 +/+, TCL1 Nfat2 +/+ and TCL1 Nfat2
Supplementary Figure 1: Expression of NFAT proteins in Nfat2-deleted B cells (a+b) Protein expression of NFAT2 (a) and NFAT1 (b) in isolated splenic B cells from WT Nfat2 +/+, TCL1 Nfat2 +/+ and TCL1 Nfat2
Supplemental Information. Regulatory T Cells Promote Macrophage. Efferocytosis during Inflammation Resolution
 Immunity, Volume 9 Supplemental Information Regulatory T Cells Promote Macrophage Efferocytosis during Inflammation Resolution Jonathan D. Proto, Amanda C. Doran, Galina Gusarova, Arif Yurdagul Jr., Erdi
Therapeutic effect of baicalin on experimental autoimmune encephalomyelitis. is mediated by SOCS3 regulatory pathway
 Therapeutic effect of baicalin on experimental autoimmune encephalomyelitis is mediated by SOCS3 regulatory pathway Yuan Zhang 1,2, Xing Li 1,2, Bogoljub Ciric 1, Cun-gen Ma 3, Bruno Gran 4, Abdolmohamad
Myeloid cell-derived inducible nitric oxide synthase suppresses M1 macrophage polarization
 Received 28 Oct 24 Accepted 7 Feb 25 Published 27 Mar 25 DOI:.38/ncomms7676 OPEN Myeloid cell-derived inducible nitric oxide synthase suppresses M macrophage polarization Geming Lu, Ruihua Zhang, Shuo
Plasma exposure levels from individual mice 4 hours post IP administration at the
 Supplemental Figure Legends Figure S1. Plasma exposure levels of MKC-3946 in mice. Plasma exposure levels from individual mice 4 hours post IP administration at the indicated dose mg/kg. Data represent
Exosomes function in antigen presentation during an in vivo Mycobacterium tuberculosis infection
 Exosomes function in antigen presentation during an in vivo Mycobacterium tuberculosis infection Victoria L. Smith, Yong Cheng, Barry R. Bryant and Jeffrey S. Schorey Supplementary Figure 1: Unprocessed
As outlined under External contributions (see appendix 7.1), the group of Prof. Gröne at the
, the group of Prof. Gröne at the") 3 RESULTS As outlined under External contributions (see appendix 7.1), the group of Prof. Gröne at the DKFZ in Heidelberg (Dept. of Cellular and Molecular pathology) contributed to this work by performing
3 RESULTS As outlined under External contributions (see appendix 7.1), the group of Prof. Gröne at the DKFZ in Heidelberg (Dept. of Cellular and Molecular pathology) contributed to this work by performing
Supplementary Figure 1:
 Supplementary Figure 1: (A) Whole aortic cross-sections stained with Hematoxylin and Eosin (H&E), 7 days after porcine-pancreatic-elastase (PPE)-induced AAA compared to untreated, healthy control aortas
SUPPLEMENTARY FIGURES
 SUPPLEMENTARY FIGURES Figure S1. Effect of a HFD on the Acox gene expression in the livers of WT and IL-6 -/- mice. Expression of Acox in the livers of WT and IL-6 -/- mice fed STD or HFD determined through
Supplemental Figure 1
 Supplemental Figure 1 1a 1c PD-1 MFI fold change 6 5 4 3 2 1 IL-1α IL-2 IL-4 IL-6 IL-1 IL-12 IL-13 IL-15 IL-17 IL-18 IL-21 IL-23 IFN-α Mut Human PD-1 promoter SBE-D 5 -GTCTG- -1.2kb SBE-P -CAGAC- -1.kb
Figure S1 Generation of γ-gt DTR transgenic mice. (A) Schematic construct of the transgene. (B)
 Schematic construct of the transgene. (B)") Figure S1 Generation of γ-gt DTR transgenic mice. (A) Schematic construct of the transgene. (B) PCR identified expected hhb-egf band (left panel) and HA tag band (right) in kidneys of transgenic (TG) mice
Figure S1 Generation of γ-gt DTR transgenic mice. (A) Schematic construct of the transgene. (B) PCR identified expected hhb-egf band (left panel) and HA tag band (right) in kidneys of transgenic (TG) mice
Chronic variable stress activates hematopoietic stem cells
 SUPPLEMENTARY INFORMATION Chronic variable stress activates hematopoietic stem cells Timo Heidt *, Hendrik B. Sager *, Gabriel Courties, Partha Dutta, Yoshiko Iwamoto, Alex Zaltsman, Constantin von zur
Supplemental Table 1. Primer sequences for transcript analysis
 Supplemental Table 1. Primer sequences for transcript analysis Primer Sequence (5 3 ) Primer Sequence (5 3 ) Mmp2 Forward CCCGTGTGGCCCTC Mmp15 Forward CGGGGCTGGCT Reverse GCTCTCCCGGTTTC Reverse CCTGGTGTGCCTGCTC
Supplementary Fig. 1 p38 MAPK negatively regulates DC differentiation. (a) Western blot analysis of p38 isoform expression in BM cells, immature DCs
 Western blot analysis of p38 isoform expression in BM cells, immature DCs") Supplementary Fig. 1 p38 MAPK negatively regulates DC differentiation. (a) Western blot analysis of p38 isoform expression in BM cells, immature DCs (idcs) and mature DCs (mdcs). A myeloma cell line expressing
Supplementary Fig. 1 p38 MAPK negatively regulates DC differentiation. (a) Western blot analysis of p38 isoform expression in BM cells, immature DCs (idcs) and mature DCs (mdcs). A myeloma cell line expressing
Supplementary Figure 1. H-PGDS deficiency does not affect GI tract functions and anaphylactic reaction. (a) Representative pictures of H&E-stained
 Representative pictures of H&E-stained") 1 2 3 4 5 6 7 8 9 10 11 Supplementary Figure 1. H-PGDS deficiency does not affect GI tract functions and anaphylactic reaction. (a) Representative pictures of H&E-stained jejunum sections ( 200 magnification;
1 2 3 4 5 6 7 8 9 10 11 Supplementary Figure 1. H-PGDS deficiency does not affect GI tract functions and anaphylactic reaction. (a) Representative pictures of H&E-stained jejunum sections ( 200 magnification;
NK cells promote neutrophil recruitment in the brain during sepsisinduced. neuroinflammation
 NK cells promote neutrophil recruitment in the brain during sepsisinduced neuroinflammation Hao He 1, Tingting Geng 1, Piyun Chen 1, Meixiang Wang 1, Jingxia Hu 1, Li Kang 1, Wengang Song 1, * & Hua Tang
Supplementary Figure 1. ETBF activate Stat3 in B6 and Min mice colons
 Supplementary Figure 1 ETBF activate Stat3 in B6 and Min mice colons a pstat3 controls Pos Neg ETBF 1 2 3 4 b pstat1 pstat2 pstat3 pstat4 pstat5 pstat6 Actin Figure Legend: (a) ETBF induce predominantly
Intrinsic and chemo-sensitizing activity of SMAC-mimetics on high-risk childhood acute lymphoblastic leukemia
 SUPPLEMENTARY INFORMATION Intrinsic and chemo-sensitizing activity of SMAC-mimetics on high-risk childhood acute lymphoblastic leukemia Melanie Schirmer, Luca Trentin, Manon Queudeville, Felix Seyfried,
Supporting Information. FADD regulates NF-кB activation and promotes ubiquitination of cflip L to induce. apoptosis
 1 2 Supporting Information 3 4 5 FADD regulates NF-кB activation and promotes ubiquitination of cflip L to induce apoptosis 6 7 Kishu Ranjan and Chandramani Pathak* 8 9 Department of Cell Biology, School
Crucial role for human Toll-like receptor 4 in the development of contact allergy to nickel
 Supplementary Figures 1-8 Crucial role for human Toll-like receptor 4 in the development of contact allergy to nickel Marc Schmidt 1,2, Badrinarayanan Raghavan 1,2, Verena Müller 1,2, Thomas Vogl 3, György
Supplementary information CD4 T cells are required for both development and maintenance of disease in a new model of reversible colitis
 Supplementary information CD4 T cells are required for both development and maintenance of disease in a new model of reversible colitis rasseit and Steiner et al. .. Supplementary Figure 1 % of initial
(A) RT-PCR for components of the Shh/Gli pathway in normal fetus cell (MRC-5) and a
 RT-PCR for components of the Shh/Gli pathway in normal fetus cell (MRC-5) and a") Supplementary figure legends Supplementary Figure 1. Expression of Shh signaling components in a panel of gastric cancer. (A) RT-PCR for components of the Shh/Gli pathway in normal fetus cell (MRC-5) and
Supplementary figure legends Supplementary Figure 1. Expression of Shh signaling components in a panel of gastric cancer. (A) RT-PCR for components of the Shh/Gli pathway in normal fetus cell (MRC-5) and
Nature Immunology: doi: /ni.3866
 Nature Immunology: doi:10.1038/ni.3866 Supplementary Figure 1 The effect of TIPE2 on chemotaxis. a, The expression of TIPE2 in dhl-60c, dhl-60t, TIPE2-expressing and 15/16Q-expressing dhl-60t neutrophils
Supplementary Materials:
 Supplementary Materials: Supplemental Figure 1: Profibrotic markers in wt/wt or ex/ex mouse kidneys 42 days post IRI. The levels of fibronectin and αsma were examined by immunostaining in ADAM17 wt/wt
SUPPLEMENTARY INFORMATION
 DOI: 1.138/ncb3355 a S1A8 + cells/ total.1.8.6.4.2 b S1A8/?-Actin c % T-cell proliferation 3 25 2 15 1 5 T cells Supplementary Figure 1 Inter-tumoral heterogeneity of MDSC accumulation in mammary tumor
Supplementary Table 1. The primers used for quantitative RT-PCR. Gene name Forward (5 > 3 ) Reverse (5 > 3 )
 Reverse (5 > 3 )") 770 771 Supplementary Table 1. The primers used for quantitative RT-PCR. Gene name Forward (5 > 3 ) Reverse (5 > 3 ) Human CXCL1 GCGCCCAAACCGAAGTCATA ATGGGGGATGCAGGATTGAG PF4 CCCCACTGCCCAACTGATAG TTCTTGTACAGCGGGGCTTG
770 771 Supplementary Table 1. The primers used for quantitative RT-PCR. Gene name Forward (5 > 3 ) Reverse (5 > 3 ) Human CXCL1 GCGCCCAAACCGAAGTCATA ATGGGGGATGCAGGATTGAG PF4 CCCCACTGCCCAACTGATAG TTCTTGTACAGCGGGGCTTG
a surface permeabilized
 a surface permeabilized RAW 64.7 P388D1 J774 b CD11b + Ly-6G - Blood Monocytes WT Supplementary Figure 1. Cell surface expression on macrophages and DCs. (a) RAW64.7, P388D1, and J774 cells were subjected
Supplementary Materials for
 www.sciencesignaling.org/cgi/content/full/4/199/ra75/dc1 Supplementary Materials for Signaling by the Matrix Proteoglycan Decorin Controls Inflammation and Cancer Through PDCD4 and MicroRNA-21 Rosetta
Supplementary Figure 1
 Supplementary Figure 1 YAP negatively regulates IFN- signaling. (a) Immunoblot analysis of Yap knockdown efficiency with sh-yap (#1 to #4 independent constructs) in Raw264.7 cells. (b) IFN- -Luc and PRDs
SUPPLEMENTARY INFORMATION
 doi:10.1038/nature10134 Supplementary Figure 1. Anti-inflammatory activity of sfc. a, Autoantibody immune complexes crosslink activating Fc receptors, promoting activation of macrophages, and WWW.NATURE.COM/NATURE
A263 A352 A204. Pan CK. pstat STAT3 pstat3 STAT3 pstat3. Columns Columns 1-6 Positive control. Omentum. Rectosigmoid A195.
 pstat3 75 Pan CK A A263 A352 A24 B Columns 1-6 Positive control A195 A22 A24 A183 Rectal Nodule STAT3 pstat3 STAT3 pstat3 Columns 7-12 Omentum Rectosigmoid Left Ovary Right Ovary Omentum Uterus Uterus
Fig 1 CD163. CD11b S100A9. Sirius Red. 100μm ** ** CD163. CD11b S100A9 ** Sirius Red (PL) Sirius Red SUM Mo.
 Sirius Red SUM Mo.") T47D T47D + o SU-59 Fig SU-59 + o IHC score (-3) IHC score (-2) CD63 3 2 IHC score (-3) CD63 3 ** 2 CDb CDb * * SA9 SA9 ** * 2 IHC score (-4) αsa αsa 4 ** ** 2 Sirius Red μm IHC score (%) Sirius Red 8
T47D T47D + o SU-59 Fig SU-59 + o IHC score (-3) IHC score (-2) CD63 3 2 IHC score (-3) CD63 3 ** 2 CDb CDb * * SA9 SA9 ** * 2 IHC score (-4) αsa αsa 4 ** ** 2 Sirius Red μm IHC score (%) Sirius Red 8
% of live splenocytes. STAT5 deletion. (open shapes) % ROSA + % floxed
 % ROSA + % floxed") Supp. Figure 1. a 14 1 1 8 6 spleen cells (x1 6 ) 16 % of live splenocytes 5 4 3 1 % of live splenocytes 8 6 4 b 1 1 c % of CD11c + splenocytes (closed shapes) 8 6 4 8 6 4 % ROSA + (open shapes) % floxed
Supp. Figure 1. a 14 1 1 8 6 spleen cells (x1 6 ) 16 % of live splenocytes 5 4 3 1 % of live splenocytes 8 6 4 b 1 1 c % of CD11c + splenocytes (closed shapes) 8 6 4 8 6 4 % ROSA + (open shapes) % floxed
W/T Itgam -/- F4/80 CD115. F4/80 hi CD115 + F4/80 + CD115 +
 F4/8 % in the peritoneal lavage 6 4 2 p=.15 n.s p=.76 CD115 F4/8 hi CD115 + F4/8 + CD115 + F4/8 hi CD115 + F4/8 + CD115 + MHCII MHCII Supplementary Figure S1. CD11b deficiency affects the cellular responses
Supplementary Figure 1 IMQ-Induced Mouse Model of Psoriasis. IMQ cream was
 Supplementary Figure 1 IMQ-Induced Mouse Model of Psoriasis. IMQ cream was painted on the shaved back skin of CBL/J and BALB/c mice for consecutive days. (a, b) Phenotypic presentation of mouse back skin
Intracellular MHC class II molecules promote TLR-triggered innate. immune responses by maintaining Btk activation
 Intracellular MHC class II molecules promote TLR-triggered innate immune responses by maintaining Btk activation Xingguang Liu, Zhenzhen Zhan, Dong Li, Li Xu, Feng Ma, Peng Zhang, Hangping Yao and Xuetao
SUPPLEMENTARY INFORMATION
 1. Supplementary Figures and Legends Supplementary Fig. 1. S1P-mediated transcriptional regulation of integrins expressed in OP/monocytoid cells. Real-time quantitative PCR analyses of mrna for two integrins,
Supplementary Figure 1. Characterization of basophils after reconstitution of SCID mice
 Supplementary figure legends Supplementary Figure 1. Characterization of after reconstitution of SCID mice with CD4 + CD62L + T cells. (A-C) SCID mice (n = 6 / group) were reconstituted with 2 x 1 6 CD4
Supplementary Figure 1. Repression of hepcidin expression in the liver of mice treated with
 Supplementary Figure 1. Repression of hepcidin expression in the liver of mice treated with DMN Immunohistochemistry for hepcidin and H&E staining (left). qrt-pcr assays for hepcidin in the liver (right).