Figure S1. The PDE5 inhibitor sildenafil interacts with celecoxib to kill cancer cell lines. (A) Hepatoma
|
|
|
- Debra Baldwin
- 5 years ago
- Views:
Transcription
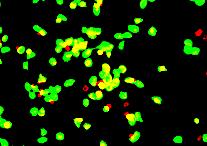
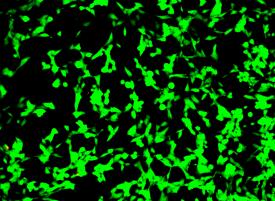
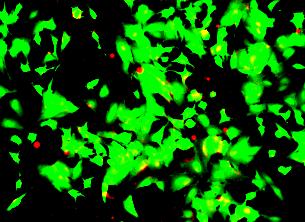
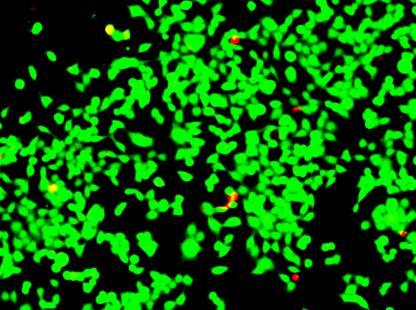
1 Figure S1. The PDE5 inhibitor sildenafil interacts with celecoxib to kill cancer cell lines. (A) Hepatoma cells were treated with celecoxib ( 5.0 M) and/or sildenafil (, 2.0 M). ls were isolated after 24h and viability determined by trypan blue exclusion (n = 3, +/- SEM) p < 0.05 greater than corresponding value in icle control. (B) Colon cancer cells were treated with celecoxib ( 5.0 M) and/or sildenafil (, 2.0 M). ls were isolated after 24h and viability determined by trypan blue exclusion (n = 3, +/- SEM) p < 0.05 greater than corresponding value in icle control. (C-F) GBM cells, selected GBM stem cells and freshly-isolated primary GBM cells were treated with celecoxib ( 5.0 M) and/or sildenafil (, 2.0 M). ls were isolated after 24h and viability determined by trypan blue exclusion (n = 3, +/- SEM) p < 0.05 greater than corresponding value in icle control. (G) Parental GBM12 cells were cultured in Steml Technologies NeuroCult NS-A Basal Medium supplemented with 20 g/ml bfgf, 20 g/ml EGF and 2 mm heparin. CD133+ glioma cells from this population were isolated by fluorescence-activated cell sorting analysis. ls grew as neurospheres and were characterized for stem cell markers compared to parental GBM12 cells: CD36; integrin 6; CD133; Nestin; CD15; SOX2; CD44; MAP-2; GFAP (n = 3).
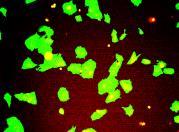
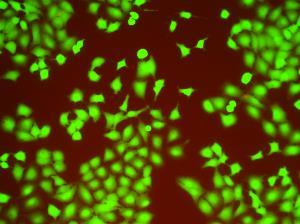
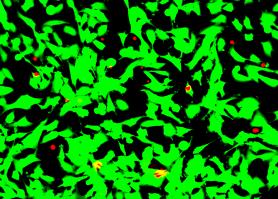
2 Figure S2. denafil and celecoxib interact to kill freshly-isolated activated human microglia. (A) Activated microglia were isolated from GBM tumors freshly delivered from the OR, as described in Methods (three patients: pt1; pt2; pt3). ls were plated in 96 well plates (10,000 cells / well) and were treated with celecoxib ( 5.0 M) and/or sildenafil (, 2.0 M). ls were isolated after 24h and viability determined using a live-dead assay (red cells = dead; green cells = alive) (n = 8 wells of a 96 well plate per condition, +/- SEM) p < 0.05 greater than corresponding value in icle control. (B) Microglia were plated in 96 well plates (10,000 cells / well) and were treated with celecoxib ( 5.0 M) and/or sildenafil (, 2.0 M). ls were isolated after 24h and fixed to the plate. Immunohistochemistry was performed to detect expression of interleukin 6 (IL-6) and tumor necrosis factor alpha (TNF ). The expression level of IL-6 and TNF was determined using Wisoft software in triplicate for each patient sample and the data presented are the mean of data from three patient samples (+/- SEM).
3 Figure S3. denafil and celecoxib treatment activates CD95 and causes cell killing in part by activation of ceramide synthase 6. (A) BT549 cells were pre-treated with icle or the pan-ceramide synthase inhibitor fumonisin B1 (2.5 M) and then were then treated with celecoxib ( 5.0 M) and/or sildenafil (, 2.0 M). Twenty four h after drug treatment cells were isolated and viability determined by trypan blue exclusion assay (n = 3 +/- SEM). p < 0.05 less than corresponding value in icle cells. (B) BT549 cells were pretreated with icle or fumonisin B1 (25 M) and then were then treated with celecoxib ( 5.0 M) and/or sildenafil (, 2.0 M). Upper Images: Six h after treatment cells were fixed to the plate and immunohistochemistry performed to determine the plasma membrane levels of CD95. The upper images obtained using the Hermes Wiscan imaging system is representative of the data. The intensity of CD95 immunostaining was determined using the Wisoft data analysis package (n = 3 +/- SEM). p < 0.05 value greater than celecoxib treatment alone. Lower immunoblot: Six h after treatment cells were isolated and subjected to SDS PAGE and immunoblotting to determine the phosphorylation of JNK. (C) - (H) BT549 cells were pre-treated with icle control or the nitric oxide synthase inhibitor L- (1 M) and 30 min later treated with icle control or with celecoxib ( 5.0 M) and/or sildenafil (, 2.0 M). Six h after treatment cells were isolated and bioactive lipids extracted. Multiple bioactive lipid species were analyzed using GC/MS techniques (n = 2 in triplicate +/- SEM). p < 0.05 greater than corresponding value in cells; p < 0.05 less than corresponding value in treatment; % p < 0.05 greater than value in celecoxib alone treatment. (I) BT549 cells were transfected as indicated to with a scrambled sirna (siscr) or sirna molecules to knock down expression of ceramide synthase 2 (silass2) or ceramide synthase 6 (silass6). Thirty six h after transfection cells were then treated with icle or with celecoxib ( 5.0 M) and sildenafil (, 2.0 M). Twenty four h after drug treatment cells were isolated and viability determined by trypan blue exclusion assay (n = 3 +/- SEM). p < 0.05 less than corresponding value in siscr transfected cells. (J) BT549 cells were treated with icle control or with FTY720 (fingolimod) (FTY, 0.05 M). Six h after treatment cells were isolated and bioactive lipids extracted. Multiple bioactive lipid species were analyzed using GC/MS techniques (n = 2 in triplicate +/- SEM). p < 0.05 greater than corresponding value in cells. (K) and (L)
4 Tumor cells, as indicated, were treated with icle, FTY720 (0.05 M), celecoxib ( 5.0 M), ATRA (150 nm) and sildenafil (, 2.0 M), or with three drug combinations, as indicated. Twelve h and 24h as indicated after drug treatment cells were isolated and viability determined by live / dead inclusion / exclusion assay (n = 3 +/- SEM). p < 0.05 less than corresponding value in icle treated cells. (M) Tumor cells, as indicated, were treated with icle, 4HPR (0.2 M), celecoxib ( 5.0 M) and sildenafil (, 2.0 M), or with all three drugs. Twelve h after drug treatment cells were isolated and viability determined by live / dead inclusion / exclusion assay (n = 3 +/- SEM). p < 0.05 less than corresponding value in icle treated cells. (N) Tumor cells, as indicated, were treated with icle, ATRA (0.15 M), celecoxib ( 5.0 M) and sildenafil (, 2.0 M), or with all three drugs. Twelve h after drug treatment cells were isolated and viability determined by live / dead inclusion / exclusion assay (n = 3 +/- SEM). (O) Tumor cells were treated with FTY720 (50 nm) and the expression of the death receptor CD95 determined over a 12h time course. (P) Tumor cells were transfected with a scrambled sirna (siscr) or sirna molecules to knock down expression of HDAC1 and HDAC2 (sihdac1 + sihdac2). Thirty six h later cells were isolated and immunoblotting performed to determine the expression of CD95. Lower graph: Tumor cells were transfected with a scrambled sirna (siscr) or an sirna molecule to knock down expression of CD95. Thirty six h later cells were pre-treated with icle or fumonisin B1 (FB1, 25 M) followed by treatment with icle, FTY720 (0.05 M), celecoxib ( 5.0 M) and sildenafil (, 2.0 M) together as indicated. Twelve h after drug treatment cells were isolated and viability determined by trypan blue exclusion assay (n = 3 +/- SEM). p < 0.05 less than corresponding value in icle treated cells. (Q) and (R) Tumor cells were transfected with a scrambled sirna (siscr) or an sirna molecule to knock down expression of CD95. Thirty six h later cells were treated with icle, 4HPR (0.20 M), ATRA (0.15 M), celecoxib ( 5.0 M) and sildenafil (, 2.0 M) together as indicated in the Figure. Twelve h after drug treatment cells were isolated and viability determined by live / dead assay (n = 3 +/- SEM) p < 0.05 less than corresponding value in siscr cells. (S) BT549 cells were treated with icle or with [celecoxib (5 M) + denafil (2 M) + FTY720 (50 nm)] and as indicated, 30 min after drug treatment, were irradiated (4 Gy). l viability was assessed 9h after irradiation by live / dead assay. (T) Tumor cells were pre-
5 treated with fumonisin B1 (25 M, FB1) or myriocin (200 nm, Myr) and then treated with icle, (FTY720, 50 nm and 4HPR, 200 nm) and/or with (celecoxib, 5 M and sildenafil, 2 M). Nine h after drug treatment cells were isolated and viability determined by live / dead inclusion / exclusion assay (n = 3 +/- SEM). p < 0.05 greater than corresponding value in double combination treated cells; p < 0.05 greater than corresponding triple combination cells. (U) GBM6-luciferase cells (0.5 x 10 6 ) were injected into the right caudate putamen (the brain) of athymic mice and tumors permitted to form for 14 days. Animals were segregated into groups with very similar mean tumor volumes. Animals were treated with icle (cremophore), sildenafil (5 mg/kg), celecoxib (10 mg/kg), FTY720 (0.05 mg/kg) or the drugs in combination as indicated simultaneously for 14 days QD. Tumor mass / luciferase activity was measured in an IVIS Xenogen imaging system, as used in our prior studies (150 mg/kg luciferin per mouse).
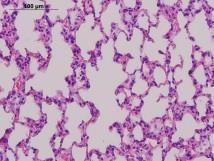
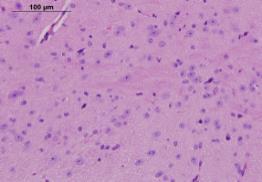
6 Figure S4. H&E staining of sections of normal tissues / organs from mice treated with celecoxib, sildenafil and FTY720 and ATRA. Mice were treated for 14 days with icle or with celecoxib (25 mg/kg) and sildenafil (10 mg/kg) and FTY720 (0.6 mg/kg) and ATRA (20 mg/kg). Organs were isolated, fixed sectioned and H&E stained (X20 magnification; 100 m bar in each panel).
7 S1A 40 Percentage cell death HuH7 HEP3B HEPG2 0
8 S1B 40 Percentage cell death HT29 HCT116 SW480 0
9 Percentage cell death S1C GBM5 GBM5 STEM 10 0
10 Percentage cell death S1D GBM6 GBM6 STEM
11 Percentage cell death S1E GBM14 GBM14 STEM 10 0
12 Percentage cell death S1F Primary Glioma 24h 0 pt1 pt2 pt3


13 S1G GBM12 GBM12 stem GBM12 GBM12 stem CD44 CD36 SOX2 Intgn B6 CD133 MAP2 CD15


14 Percentage cell death S2A Activated Microglia 24h pt1 pt2 pt3
15 S2B + IL-6 TNFa Percentage cytokine level h, Pts. 1-3 IL-6 TNFa
16 S3A Percentage cell death FB1


17 Percent Change in surface CD95 Expression vs Vehicle S3B FB % 22% P-JNK JNK FB1
18 S3C pmol dihydro-ceramide % 0 C16:0 C22:0 C24:1 C24:0 C26:1
19 S3D pmol dihydro-hexaceramide C16:0 C18:0 C20:0 C24:1
20 pmol dihydro-s1p S3E L-
21 pmol ceramide S3F C16:0 C22:0 C24:1 C24:0 C24:1
22 pmol hexaceramide S3G C16:0 C22:0 C24:1 C24:0 C24:1
23 pmol S1P S3H L-
24 + + + siscr silass6 silass2 S3I Percentage cell death BT549 24h LASS2 LASS6 GAPDH 0 siscr silass6 silass2
25 FTY FTY FTY FTY FTY FTY FTY FTY S3J 50 nmol dihydro-ceramide C16:0 C22:0 C24:1 C24:0 6h C16:0 C22:0 C24:1 C24:0 12h


26 S3K / FTY / /FTY / FTY / /FTY BT474 HEP3B 2% 15% 3% 52% 2% 10% 12% 38% HCT116 SUM149 3% 4% 4% 29% 1% 3% 5% 31% CON1 GBM6 GBM12 5% 7% 6% 28% 4% 6% 5% 46% HT29 HEPG2 2% 3% 3% 26% 1% 12% 8% 28% 4% 5% 9% 54% HOSS1 6% 12% 6% 30% SW480 3% 19% 3% 63%


27 S3L A549 H460 1% 2% 3% 32% 24h 1% 4% 3% 36% / FTY / /FTY ATRA / /ATRA A549 1% 11% 3% 53% 3% 28% 12h H460 1% 5% 4% 41% 5% 44%


28 S3M / 4HPR / /4HPR / 4HPR / /4HPR BT474 HEP3B 3% 12% 6% 38% 2% 10% 20% 45% HCT116 3% 7% 8% 33% HEPG2 1% 12% 9% 40% CON1 8% 12% 10% 29% GBM6 2% 8% 8% 21% GBM12 4% 7% 18% 21% HOSS1 6% 11% 9% 20% SW480 4% 23% 17% 29%


29 S3N HEPG2 1% 12% 6% 31% HEP3B 1% 10% 5% 25%
30 S3O Time (hours) after 50 nm FTY CD95 GAPDH BT549 CD95 GAPDH BT474

31 S3P CD95 GAPDH siscr sihdac1+2 HDAC1 HDAC2 GAPDH sihdac1+2 siscr 60 Percentage cell death F+C+S FTY720 F+C+S FTY720 F+C+S FTY720 FB1 siscr sicd95 siscr


32 S3Q + 4HPR + + 4HPR ATRA + + ATRA siscr SUM149 2% 4% 6% 51% 5% 31% sicd95 1% 1% 7% 6% 6% 8% siscr GBM6 1% 10% 2% 26% 3% 29% sicd95 1% 3% 2% 6% 2% 16%


33 S3R + 4HPR + + 4HPR ATRA + + ATRA siscr BT474 2% 4% 7% 40% 6% 54% sicd95 1% 3% 5% 11% 4% 7% siscr HEP3B 1% 17% 6% 37% 9% 43% sicd95 1% 2% 2% 9% 3% 13%


34 S3S BT549, 9h FTY FTY Mock exposed 4 Gy


35 S3T //FTY 4HPR 4 DRUG 5% 15% 7% 28% Plus FB1 Plus Myr 6% 8% 7% 7% 5% 8% 8% 17%


36 S3U FTY720 C+S+F Day 0 Day 7 Day 14 Day 28 Dead


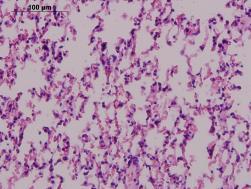


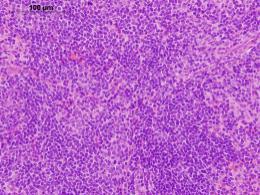


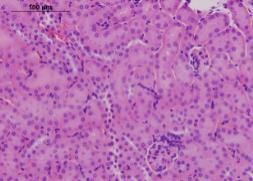

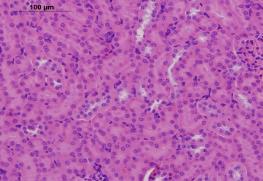


37 S4 FTY720 +FTY720 ATRA ATRA+FTY Spleen Lung Liver Kidney Heart Brain
PDE5 Inhibitors Enhance Celecoxib Killing in Multiple Tumor Types
 Virginia Commonwealth University VCU Scholars Compass Biochemistry and Molecular Biology Publications Dept. of Biochemistry and Molecular Biology 2015 PDE5 Inhibitors Enhance Celecoxib Killing in Multiple
Nature Neuroscience: doi: /nn Supplementary Figure 1
 Supplementary Figure 1 EGFR inhibition activates signaling pathways (a-b) EGFR inhibition activates signaling pathways (a) U251EGFR cells were treated with erlotinib (1µM) for the indicated times followed
c Ischemia (30 min) Reperfusion (8 w) Supplementary Figure bp 300 bp Ischemia (30 min) Reperfusion (4 h) Dox 20 mg/kg i.p.
 Reperfusion (8 w) Supplementary Figure bp 300 bp Ischemia (30 min) Reperfusion (4 h) Dox 20 mg/kg i.p.") a Marker Ripk3 +/ 5 bp 3 bp b Ischemia (3 min) Reperfusion (4 h) d 2 mg/kg i.p. 1 w 5 w Sacrifice for IF size A subset for echocardiography and morphological analysis c Ischemia (3 min) Reperfusion (8
a Marker Ripk3 +/ 5 bp 3 bp b Ischemia (3 min) Reperfusion (4 h) d 2 mg/kg i.p. 1 w 5 w Sacrifice for IF size A subset for echocardiography and morphological analysis c Ischemia (3 min) Reperfusion (8
Supplementary fig. 1. Crystals induce necroptosis does not involve caspases, TNF receptor or NLRP3. A. Mouse tubular epithelial cells were pretreated
 Supplementary fig. 1. Crystals induce necroptosis does not involve caspases, TNF receptor or NLRP3. A. Mouse tubular epithelial cells were pretreated with zvad-fmk (10µM) and exposed to calcium oxalate
human epithelial cells were pretreated with control sirna (50 nm) or GSK-3β sirna (50 nm)
 or GSK-3β sirna (50 nm)") GSK3β facilitates IFNγ signaling Supplementary Figure Legends Figure S1. The effects of inhibiting GSK3β on IFNγinduced TNFα expression. A, A549 human epithelial cells were pretreated with control sirna
GSK3β facilitates IFNγ signaling Supplementary Figure Legends Figure S1. The effects of inhibiting GSK3β on IFNγinduced TNFα expression. A, A549 human epithelial cells were pretreated with control sirna
Keywords: autophagy, anoikis, BH3 domain, MCL-1, ERBB1, tumor, signaling, necrosis, BAK, NOXA
 Research Paper Cancer Biology & Therapy 14:10, 982 996; October 2013; 2013 Landes Bioscience Histone deacetylase inhibitors restore toxic BH3 domain protein expression in anoikis-resistant mammary and
Supplementary Figure 1. Repression of hepcidin expression in the liver of mice treated with
 Supplementary Figure 1. Repression of hepcidin expression in the liver of mice treated with DMN Immunohistochemistry for hepcidin and H&E staining (left). qrt-pcr assays for hepcidin in the liver (right).
Figure S1. Reduction in glomerular mir-146a levels correlate with progression to higher albuminuria in diabetic patients.
 Supplementary Materials Supplementary Figures Figure S1. Reduction in glomerular mir-146a levels correlate with progression to higher albuminuria in diabetic patients. Figure S2. Expression level of podocyte
(a) Significant biological processes (upper panel) and disease biomarkers (lower panel)
 Significant biological processes (upper panel) and disease biomarkers (lower panel)") Supplementary Figure 1. Functional enrichment analyses of secretomic proteins. (a) Significant biological processes (upper panel) and disease biomarkers (lower panel) 2 involved by hrab37-mediated secretory
Supplementary Figure 1. Functional enrichment analyses of secretomic proteins. (a) Significant biological processes (upper panel) and disease biomarkers (lower panel) 2 involved by hrab37-mediated secretory
Supplementary Figure S I: Effects of D4F on body weight and serum lipids in apoe -/- mice.
 Supplementary Figures: Supplementary Figure S I: Effects of D4F on body weight and serum lipids in apoe -/- mice. Male apoe -/- mice were fed a high-fat diet for 8 weeks, and given PBS (model group) or
Supplementary Materials for
 www.sciencesignaling.org/cgi/content/full/4/199/ra75/dc1 Supplementary Materials for Signaling by the Matrix Proteoglycan Decorin Controls Inflammation and Cancer Through PDCD4 and MicroRNA-21 Rosetta
Supplementary Figure 1: si-craf but not si-braf sensitizes tumor cells to radiation.
 Supplementary Figure 1: si-craf but not si-braf sensitizes tumor cells to radiation. (a) Embryonic fibroblasts isolated from wildtype (WT), BRAF -/-, or CRAF -/- mice were irradiated (6 Gy) and DNA damage
Supplementary Material
 Supplementary Material accompanying the manuscript Interleukin 37 is a fundamental inhibitor of innate immunity Marcel F Nold, Claudia A Nold-Petry, Jarod A Zepp, Brent E Palmer, Philip Bufler & Charles
Supplemental Figure 1. Isolation and characterization of CD133+ neurosphere-like
 SUPPLEMENTL FIGURE LEGENDS Supplemental Figure 1. Isolation and characterization of CD133+ neurosphere-like spheroids from a human brain tumor sample or glioma xenograft. () CD133+ tumor cells isolated
Figure S1. B % of Phosphorylation 32H. 32ss
 Figure S1 8H 32ss 32H 32Hc % of Phosphorylation 3 32H 2 1 32ss 1 2 3 4 Extract (μg) C % of Phosphorylation 18 12 6-32H 32Hc 8H 32ss Dbait Figure S1. List of the Dbait molecules and activation of DN-PK
Supplemental Figure 1. Western blot analysis indicated that MIF was detected in the fractions of
 Supplemental Figure Legends Supplemental Figure 1. Western blot analysis indicated that was detected in the fractions of plasma membrane and cytosol but not in nuclear fraction isolated from Pkd1 null
Supplementary Figure 1.TRIM33 binds β-catenin in the nucleus. a & b, Co-IP of endogenous TRIM33 with β-catenin in HT-29 cells (a) and HEK 293T cells
 and HEK 293T cells") Supplementary Figure 1.TRIM33 binds β-catenin in the nucleus. a & b, Co-IP of endogenous TRIM33 with β-catenin in HT-29 cells (a) and HEK 293T cells (b). TRIM33 was immunoprecipitated, and the amount of
Supplementary Figure 1.TRIM33 binds β-catenin in the nucleus. a & b, Co-IP of endogenous TRIM33 with β-catenin in HT-29 cells (a) and HEK 293T cells (b). TRIM33 was immunoprecipitated, and the amount of
Supplementary Figure 1. Validation of astrocytes. Primary astrocytes were
 Supplementary Figure 1. Validation of astrocytes. Primary astrocytes were separated from the glial cultures using a mild trypsinization protocol. Anti-glial fibrillary acidic protein (GFAP) immunofluorescent
SUPPLEMENTARY FIGURES
 SUPPLEMENTARY FIGURES 1 2 3 4 SUPPLEMENTARY TABLES Supplementary Table S1. Brain Tumors used in the study Code Tumor Classification Age Gender HuTuP51 Glioblastoma 57 Male HuTuP52 Glioblastoma 53 Male
SUPPLEMENTARY FIGURES
 SUPPLEMENTARY FIGURES Supplementary Figure S1: Fibroblast-induced elongation of cancer cells requires direct contact with living fibroblasts. A. Representative images of HT29-GFP cultured in the presence
Additional methods appearing in the supplement are described in the Experimental Procedures section of the manuscript.
 Supplemental Materials: I. Supplemental Methods II. Supplemental Figure Legends III. Supplemental Figures Supplemental Methods Cell Culture and Transfections for Wild Type and JNK1-/-,JNK2-/- MEFs: The
HDAC inhibitors enhance neratinib activity and when combined enhance the actions of an anti-pd-1 immunomodulatory antibody in vivo
 /, 2017, Vol. 8, (No. 52), pp: 90262-90277 HDAC inhibitors enhance neratinib activity and when combined enhance the actions of an anti-pd-1 immunomodulatory antibody in vivo Laurence Booth 1, Jane L. Roberts
Supplementary Figure 1
 Supplementary Figure 1 AAV-GFP injection in the MEC of the mouse brain C57Bl/6 mice at 4 months of age were injected with AAV-GFP into the MEC and sacrificed at 7 days post injection (dpi). (a) Brains
Supplemental information
 Carcinoemryonic antigen-related cell adhesion molecule 6 (CEACAM6) promotes EGF receptor signaling of oral squamous cell carcinoma metastasis via the complex N-glycosylation y Chiang et al. Supplemental
Sorafenib and Vorinostat Kill Colon Cancer Cells by CD95- Dependent and -Independent Mechanisms
 0026-895X/09/7602-342 355$20.00 MOLECULAR PHARMACOLOGY Vol. 76, No. 2 Copyright 2009 The American Society for Pharmacology and Experimental Therapeutics 56523/3499960 Mol Pharmacol 76:342 355, 2009 Printed
Supplementary Figure 1. Characterization of ALDH-positive cell population in MCF-7 cells. (a) Expression level of stem cell markers in MCF-7 cells or
 Expression level of stem cell markers in MCF-7 cells or") Supplementary Figure 1. Characterization of ALDH-positive cell population in MCF-7 cells. (a) Expression level of stem cell markers in MCF-7 cells or ALDH-positive cell population by qpcr. Data represent
Supplementary Figure 1. Characterization of ALDH-positive cell population in MCF-7 cells. (a) Expression level of stem cell markers in MCF-7 cells or ALDH-positive cell population by qpcr. Data represent
Supplementary. presence of the. (c) mrna expression. Error. in naive or
 mrna expression. Error. in naive or") Figure 1. (a) Naive CD4 + T cells were activated in the presence of the indicated cytokines for 3 days. Enpp2 mrna expression was measured by qrt-pcrhr, infected with (b, c) Naive CD4 + T cells were activated
Figure 1. (a) Naive CD4 + T cells were activated in the presence of the indicated cytokines for 3 days. Enpp2 mrna expression was measured by qrt-pcrhr, infected with (b, c) Naive CD4 + T cells were activated
Supplementary Figure 1. Basal level EGFR across a panel of ESCC lines. Immunoblots demonstrate the expression of phosphorylated and total EGFR as
 Supplementary Figure 1. Basal level EGFR across a panel of ESCC lines. Immunoblots demonstrate the expression of phosphorylated and total EGFR as well as their downstream effectors across a panel of ESCC
Supporting Information
 Supporting Information M1 macrophage-derived nanovesicles potentiate the anticancer efficacy of immune checkpoint inhibitors Yeon Woong Choo, 1, Mikyung Kang, 2, Han Young Kim, 1 Jin Han, 1 Seokyung Kang,
Supplemental Figures:
 Supplemental Figures: Figure 1: Intracellular distribution of VWF by electron microscopy in human endothelial cells. a) Immunogold labeling of LC3 demonstrating an LC3-positive autophagosome (white arrow)
SUPPLEMENTARY FIG. S2. Representative counting fields used in quantification of the in vitro neural differentiation of pattern of dnscs.
 Supplementary Data SUPPLEMENTARY FIG. S1. Representative counting fields used in quantification of the in vitro neural differentiation of pattern of anpcs. A panel of lineage-specific markers were used
Supplementary Figure 1. Confocal immunofluorescence showing mitochondrial translocation of Drp1. Cardiomyocytes treated with H 2 O 2 were prestained
 Supplementary Figure 1. Confocal immunofluorescence showing mitochondrial translocation of Drp1. Cardiomyocytes treated with H 2 O 2 were prestained with MitoTracker (red), then were immunostained with
Supplementary Fig. 1. GPRC5A post-transcriptionally down-regulates EGFR expression. (a) Plot of the changes in steady state mrna levels versus
 Plot of the changes in steady state mrna levels versus") Supplementary Fig. 1. GPRC5A post-transcriptionally down-regulates EGFR expression. (a) Plot of the changes in steady state mrna levels versus changes in corresponding proteins between wild type and Gprc5a-/-
Supplementary Fig. 1. GPRC5A post-transcriptionally down-regulates EGFR expression. (a) Plot of the changes in steady state mrna levels versus changes in corresponding proteins between wild type and Gprc5a-/-
Supplementary Materials
 Supplementary Materials Figure S1. MTT Cell viability assay. To measure the cytotoxic potential of the oxidative treatment, the MTT [3-(4,5-dimethylthiazol- 2-yl)-2,5-diphenyl tetrazolium bromide] assay
SUPPLEMENTAL EXPERIMENTAL PROCEDURES
 SUPPLEMENTAL EXPERIMENTAL PROCEDURES Crystal violet assay Cells were seeded in 24-well plates and cultured in media supplemented with % FBS for 7 days. Media were then removed, plates were briefly washed
Adiponectin/T-cadherin system enhances exosome biogenesis and decreases cellular
 Supplemental Data Adiponectin/herin system enhances exosome biogenesis and decreases cellular ceramides by exosomal release 5 Yoshinari Obata, Shunbun Kita, *,, Yoshihisa Koyama, Shiro Fukuda, Hiroaki
Electron micrograph of phosphotungstanic acid-stained exosomes derived from murine
 1 SUPPLEMENTARY INFORMATION SUPPLEMENTARY FIGURES Supplementary Figure 1. Physical properties of murine DC-derived exosomes. a, Electron micrograph of phosphotungstanic acid-stained exosomes derived from
Integrin CD11b negatively regulates TLR-triggered inflammatory responses by. activating Syk and promoting MyD88 and TRIF degradation via cbl-b
 Integrin CD11b negatively regulates TLR-triggered inflammatory responses by activating Syk and promoting MyD88 and TRIF degradation via cbl-b Chaofeng Han, Jing Jin, Sheng Xu, Haibo Liu, Nan Li, and Xuetao
SUPPLEMENTARY INFORMATION
 SUPPLEMENTARY INFORMATION Supplementary Figure 1. The expression of ephrin-b2 H2BGFP persists in the post-hearingonset organ of Corti and is specifically restricted to supporting cells. Sox2 immunolabeling
2.5. AMPK activity
 Supplement Fig. A 3 B phos-ampk 2.5 * Control AICAR AMPK AMPK activity (Absorbance at 45 nm) 2.5.5 Control AICAR Supplement Fig. Effects of AICAR on AMPK activation in macrophages. J774. macrophages were
Pharmacologic inhibition of histone demethylation as a therapy for pediatric brainstem glioma
 Supplementary information for: Pharmacologic inhibition of histone demethylation as a therapy for pediatric brainstem glioma Rintaro Hashizume 1, Noemi Andor 2, Yuichiro Ihara 2, Robin Lerner 2, Haiyun
Inhibition of TGFβ enhances chemotherapy action against triple negative breast cancer by abrogation of
 SUPPLEMENTAL DATA Inhibition of TGFβ enhances chemotherapy action against triple negative breast cancer by abrogation of cancer stem cells and interleukin-8 Neil E. Bhola 1, Justin M. Balko 1, Teresa C.
well for 2 h at rt. Each dot represents an individual mouse and bar is the mean ±
 Supplementary data: Control DC Blimp-1 ko DC 8 6 4 2-2 IL-1β p=.5 medium 8 6 4 2 IL-2 Medium p=.16 8 6 4 2 IL-6 medium p=.3 5 4 3 2 1-1 medium IL-1 n.s. 25 2 15 1 5 IL-12(p7) p=.15 5 IFNγ p=.65 4 3 2 1
RAW264.7 cells stably expressing control shrna (Con) or GSK3b-specific shrna (sh-
 or GSK3b-specific shrna (sh-") 1 a b Supplementary Figure 1. Effects of GSK3b knockdown on poly I:C-induced cytokine production. RAW264.7 cells stably expressing control shrna (Con) or GSK3b-specific shrna (sh- GSK3b) were stimulated
1 a b Supplementary Figure 1. Effects of GSK3b knockdown on poly I:C-induced cytokine production. RAW264.7 cells stably expressing control shrna (Con) or GSK3b-specific shrna (sh- GSK3b) were stimulated
Supplementary Figures
 Supplementary Figures Supplementary Figure 1 Increased ABHD5 expression in human colon cancer associated macrophages. (a) Murine peritoneal macrophages were treated with regular culture medium (Ctrl) or
Figure S1. Sorting nexin 9 (SNX9) specifically binds psmad3 and not psmad 1/5/8. Lysates from AKR-2B cells untreated (-) or stimulated (+) for 45 min
 specifically binds psmad3 and not psmad 1/5/8. Lysates from AKR-2B cells untreated (-) or stimulated (+) for 45 min") Figure S1. Sorting nexin 9 (SNX9) specifically binds psmad3 and not psmad 1/5/8. Lysates from AKR2B cells untreated () or stimulated () for 45 min with 5 ng/ml TGFβ or 10 ng/ml BMP4 were incubated with
Figure S1. Sorting nexin 9 (SNX9) specifically binds psmad3 and not psmad 1/5/8. Lysates from AKR2B cells untreated () or stimulated () for 45 min with 5 ng/ml TGFβ or 10 ng/ml BMP4 were incubated with
Supplementary Information and Figure legends
 Supplementary Information and Figure legends Table S1. Primers for quantitative RT-PCR Target Sequence (5 -> 3 ) Target Sequence (5 -> 3 ) DAB2IP F:TGGACGATGTGCTCTATGCC R:GGATGGTGATGGTTTGGTAG Snail F:CCTCCCTGTCAGATGAGGAC
(A) RT-PCR for components of the Shh/Gli pathway in normal fetus cell (MRC-5) and a
 RT-PCR for components of the Shh/Gli pathway in normal fetus cell (MRC-5) and a") Supplementary figure legends Supplementary Figure 1. Expression of Shh signaling components in a panel of gastric cancer. (A) RT-PCR for components of the Shh/Gli pathway in normal fetus cell (MRC-5) and
Supplementary figure legends Supplementary Figure 1. Expression of Shh signaling components in a panel of gastric cancer. (A) RT-PCR for components of the Shh/Gli pathway in normal fetus cell (MRC-5) and
SUPPLEMENTARY INFORMATION
 Supplementary Table 1. Cell sphingolipids and S1P bound to endogenous TRAF2. Sphingolipid Cell pmol/mg TRAF2 immunoprecipitate pmol/mg Sphingomyelin 4200 ± 250 Not detected Monohexosylceramide 311 ± 18
SHREE ET AL, SUPPLEMENTAL MATERIALS. (A) Workflow for tumor cell line derivation and orthotopic implantation.
 Workflow for tumor cell line derivation and orthotopic implantation.") SHREE ET AL, SUPPLEMENTAL MATERIALS SUPPLEMENTAL FIGURE AND TABLE LEGENDS Supplemental Figure 1. Derivation and characterization of TS1-TGL and TS2-TGL PyMT cell lines and development of an orthotopic
SHREE ET AL, SUPPLEMENTAL MATERIALS SUPPLEMENTAL FIGURE AND TABLE LEGENDS Supplemental Figure 1. Derivation and characterization of TS1-TGL and TS2-TGL PyMT cell lines and development of an orthotopic
T H E J O U R N A L O F C E L L B I O L O G Y
 Supplemental material Díaz et al., http://www.jcb.org/cgi/content/full/jcb.201209151/dc1 T H E J O U R N A L O F C E L L B I O L O G Y Figure S1. Hypoxia induces invadopodia formation in different epithelial
Supplementary Information
 Supplementary Information mediates STAT3 activation at retromer-positive structures to promote colitis and colitis-associated carcinogenesis Zhang et al. a b d e g h Rel. Luc. Act. Rel. mrna Rel. mrna
injected subcutaneously into flanks of 6-8 week old athymic male nude mice (LNCaP SQ) and body
 and body") SUPPLEMENTAL FIGURE LEGENDS Figure S1: Generation of ENZR Xenografts and Cell Lines: (A) 1x10 6 LNCaP cells in matrigel were injected subcutaneously into flanks of 6-8 week old athymic male nude mice (LNCaP
SUPPLEMENTAL FIGURE LEGENDS Figure S1: Generation of ENZR Xenografts and Cell Lines: (A) 1x10 6 LNCaP cells in matrigel were injected subcutaneously into flanks of 6-8 week old athymic male nude mice (LNCaP
Fang et al. NMuMG. PyVmT unstained Anti-CCR2-PE MDA-MB MCF MCF10A
 A NMuMG PyVmT 16.5+.5 47.+7.2 Fang et al. unstained Anti-CCR2-PE 4T1 Control 37.6+6.3 56.1+.65 MCF1A 16.1+3. MCF-7 3.1+5.4 MDA-M-231 42.1+5.5 unstained Secondary antibody only Anti-CCR2 SUPPLEMENTAL FIGURE
Supplemental Figure 1
 Supplemental Figure 1 1a 1c PD-1 MFI fold change 6 5 4 3 2 1 IL-1α IL-2 IL-4 IL-6 IL-1 IL-12 IL-13 IL-15 IL-17 IL-18 IL-21 IL-23 IFN-α Mut Human PD-1 promoter SBE-D 5 -GTCTG- -1.2kb SBE-P -CAGAC- -1.kb
SD-1 SD-1: Cathepsin B levels in TNF treated hch
 SD-1 SD-1: Cathepsin B levels in TNF treated hch. A. RNA and B. protein extracts from TNF treated and untreated human chondrocytes (hch) were analyzed via qpcr (left) and immunoblot analyses (right) for
SUPPLEMENTARY INFORMATION
 DOI:.38/ncb3399 a b c d FSP DAPI 5mm mm 5mm 5mm e Correspond to melanoma in-situ Figure a DCT FSP- f MITF mm mm MlanaA melanoma in-situ DCT 5mm FSP- mm mm mm mm mm g melanoma in-situ MITF MlanaA mm mm
Interleukin-6 promotes pancreatic cancer cell migration by rapidly activating the small GTPase CDC42
 Interleukin-6 promotes pancreatic cancer cell migration by rapidly activating the small GTPase CDC42 Gina L. Razidlo, Kevin M. Burton, and Mark A. McNiven SUPPORTING INFORMATION Figure S1. IL-6 promotes
Supplementary Figures
 Supplementary Figures Supplementary Figure 1 Characterization of stable expression of GlucB and sshbira in the CT26 cell line (a) Live cell imaging of stable CT26 cells expressing green fluorescent protein
microrna-200b and microrna-200c promote colorectal cancer cell proliferation via
 Supplementary Materials microrna-200b and microrna-200c promote colorectal cancer cell proliferation via targeting the reversion-inducing cysteine-rich protein with Kazal motifs Supplementary Table 1.
Supplementary Information
 Supplementary Information An orally available, small-molecule interferon inhibits viral replication Hideyuki Konishi 1, Koichi Okamoto 1, Yusuke Ohmori 1, Hitoshi Yoshino 2, Hiroshi Ohmori 1, Motooki Ashihara
Irf1 fold changes (D) 24h 48h. p-p65. t-p65. p-irf3. t-irf3. β-actin SKO TKO 100% 80% 60% 40% 20%
 24h 48h. p-p65. t-p65. p-irf3. t-irf3. β-actin SKO TKO 100% 80% 60% 40% 20%") Irf7 Fold changes 3 1 Irf1 fold changes 3 1 8h h 8h 8h h 8h p-p6 p-p6 t-p6 p-irf3 β-actin p-irf3 t-irf3 β-actin TKO TKO STKO (E) (F) TKO TKO % of p6 nuclear translocation % % 1% 1% % % p6 TKO % of IRF3
Irf7 Fold changes 3 1 Irf1 fold changes 3 1 8h h 8h 8h h 8h p-p6 p-p6 t-p6 p-irf3 β-actin p-irf3 t-irf3 β-actin TKO TKO STKO (E) (F) TKO TKO % of p6 nuclear translocation % % 1% 1% % % p6 TKO % of IRF3
SUPPLEMENTARY INFORMATION
 1. Supplementary Figures and Legends Supplementary Fig. 1. S1P-mediated transcriptional regulation of integrins expressed in OP/monocytoid cells. Real-time quantitative PCR analyses of mrna for two integrins,
Supplementary Figure 1 Expression of Crb3 in mouse sciatic nerve: biochemical analysis (a) Schematic of Crb3 isoforms, ERLI and CLPI, indicating the
 Schematic of Crb3 isoforms, ERLI and CLPI, indicating the") Supplementary Figure 1 Expression of Crb3 in mouse sciatic nerve: biochemical analysis (a) Schematic of Crb3 isoforms, ERLI and CLPI, indicating the location of the transmembrane (TM), FRM binding (FB)
Supplementary Figure 1 Expression of Crb3 in mouse sciatic nerve: biochemical analysis (a) Schematic of Crb3 isoforms, ERLI and CLPI, indicating the location of the transmembrane (TM), FRM binding (FB)
SUPPLEMENTARY FIGURES AND TABLES
 SUPPLEMENTARY FIGURES AND TABLES Supplementary Figure S1: CaSR expression in neuroblastoma models. A. Proteins were isolated from three neuroblastoma cell lines and from the liver metastasis of a MYCN-non
Effective Targeting of Quiescent Chronic Myelogenous
 Cancer Cell, Volume 7 Supplemental Information Effective Targeting of Quiescent Chronic Myelogenous Leukemia Stem Cells by Histone Deacetylase Inhibitors in Combination with Imatinib Mesylate Bin Zhang,
Supplementary Fig. 1 p38 MAPK negatively regulates DC differentiation. (a) Western blot analysis of p38 isoform expression in BM cells, immature DCs
 Western blot analysis of p38 isoform expression in BM cells, immature DCs") Supplementary Fig. 1 p38 MAPK negatively regulates DC differentiation. (a) Western blot analysis of p38 isoform expression in BM cells, immature DCs (idcs) and mature DCs (mdcs). A myeloma cell line expressing
Supplementary Fig. 1 p38 MAPK negatively regulates DC differentiation. (a) Western blot analysis of p38 isoform expression in BM cells, immature DCs (idcs) and mature DCs (mdcs). A myeloma cell line expressing
Supplementary Figures
 Supplementary Figures Supplementary Figure 1 DOT1L regulates the expression of epithelial and mesenchymal markers. (a) The expression levels and cellular localizations of EMT markers were confirmed by
GFP-LC3 +/+ CLU -/- kda CLU GFP. Actin. GFP-LC3 +/+ CLU -/- kda CLU GFP. Actin
 Supplementary Fig. 1 a CQ treatment ScrB OGX11 MG132 I II AZD5363 I II b GFP / / GFP / / GFP / / GFP / / GFP GFP Actin Actin ctrl CQ GFP / / GFP / / GFP / / GFP / / GFP GFP Actin Actin rapamycin rapamycincq
Supplemental Figure 1. Intracranial transduction of a modified ptomo lentiviral vector in the mouse
 Supplemental figure legends Supplemental Figure 1. Intracranial transduction of a modified ptomo lentiviral vector in the mouse hippocampus targets GFAP-positive but not NeuN-positive cells. (A) Stereotaxic
Supplementary Materials for
 advances.sciencemag.org/cgi/content/full/2/12/e1601756/dc1 Supplementary Materials for Syrosingopine sensitizes cancer cells to killing by metformin Don Benjamin, Marco Colombi, Sravanth K. Hindupur, Charles
a. b. c. d. e. f. g. h. i. j. k. l. m. n. o. p.
 a. b. c. d. e. f. g. h. i. j. k. l. 2.5 2 1.5 1.5 IL-1β 12 8 6 4 2 IL-1β 9 8 7 6 4 3 3 2.9 IL-1β m. n. o. p. 1.8 1.6 1.4 1.2 1.8.6.4.2 6h LPS 2 15 1 5 6h LPS 2 6h LPS 6 4 3 6h LPS Supplementary Figure
Hopkins University, Howard Hughes Medical Institute, USA) (27). Cells were maintained in DMEM
 (27). Cells were maintained in DMEM") Supplementary Materials and Methods Cell Culture HCT116 (TP53 +/+ and TP53 -/- ) cells were provided by Dr. Bert Vogelstein (Johns Hopkins University, Howard Hughes Medical Institute, USA) (27). Cells
Supplementary Materials and Methods Cell Culture HCT116 (TP53 +/+ and TP53 -/- ) cells were provided by Dr. Bert Vogelstein (Johns Hopkins University, Howard Hughes Medical Institute, USA) (27). Cells
Supplementary Figure 1: Digitoxin induces apoptosis in primary human melanoma cells but not in normal melanocytes, which express lower levels of the
 Supplementary Figure 1: Digitoxin induces apoptosis in primary human melanoma cells but not in normal melanocytes, which express lower levels of the cardiac glycoside target, ATP1A1. (a) The percentage
File Name: Supplementary Information Description: Supplementary Figures and Supplementary Tables. File Name: Peer Review File Description:
 File Name: Supplementary Information Description: Supplementary Figures and Supplementary Tables File Name: Peer Review File Description: Primer Name Sequence (5'-3') AT ( C) RT-PCR USP21 F 5'-TTCCCATGGCTCCTTCCACATGAT-3'
mtor Inhibition Specifically Sensitizes Colorectal Cancers with KRAS or BRAF Mutations to BCL-2/BCL-
 Supplementary Material for mtor Inhibition Specifically Sensitizes Colorectal Cancers with KRAS or BRAF Mutations to BCL-2/BCL- XL Inhibition by Suppressing MCL-1 Anthony C. Faber 1,2 *, Erin M. Coffee
SUPPLEMENTARY INFORMATION
 b 350 300 250 200 150 100 50 0 E0 E10 E50 E0 E10 E50 E0 E10 E50 E0 E10 E50 Number of organoids per well 350 300 250 200 150 100 50 0 R0 R50 R100 R500 1st 2nd 3rd Noggin 100 ng/ml Noggin 10 ng/ml Noggin
Figure S1 Genetic or pharmacologic COX-2 inhibition led to increased kidney
 SUPPLEMENTAL FIGURE LEGENDS Figure S1 Genetic or pharmacologic COX-2 inhibition led to increased kidney macrophage infiltration. Wild type or COX-2 -/- mice (2 months old, C57/Bl6 background) were treated
Supplementary Information. Tissue-wide immunity against Leishmania. through collective production of nitric oxide
 Supplementary Information Tissue-wide immunity against Leishmania through collective production of nitric oxide Romain Olekhnovitch, Bernhard Ryffel, Andreas J. Müller and Philippe Bousso Supplementary
Supplementary Figure 1. a. b. Relative cell viability. Nature Genetics: doi: /ng SCR shyap1-1 shyap
 Supplementary Figure 1. a. b. p-value for depletion in vehicle (DMSO) 1e-05 1e-03 1e-01 1 0 1000 2000 3000 4000 5000 Genes log2 normalized shrna counts in T0 0 2 4 6 8 sh1 shluc 0 2 4 6 8 log2 normalized
SUPPLEMENTARY INFORMATION
 Supplementary Figure 1. Behavioural effects of ketamine in non-stressed and stressed mice. Naive C57BL/6 adult male mice (n=10/group) were given a single dose of saline vehicle or ketamine (3.0 mg/kg,
Supplementary Figures
 Supplementary Figures Figure S1. Validation of kinase regulators of ONC201 sensitivity. Validation and screen results for changes in cell viability associated with the combination of ONC201 treatment (1
Neocortex Zbtb20 / NFIA / Sox9
 Neocortex / NFIA / Sox9 Supplementary Figure 1. Expression of, NFIA, and Sox9 in the mouse neocortex at. The lower panels are higher magnification views of the oxed area. Arrowheads indicate triple-positive
Self-inflicted DNA double-strand breaks sustain tumorigenicity and stemness of cancer cells
 ORIGINAL ARTICLE Cell Research (2017) 27:764-783. www.nature.com/cr Self-inflicted DNA double-strand breaks sustain tumorigenicity and stemness of cancer cells Xinjian Liu 1, Fang Li 1, Qian Huang 2, Zhengxiang
Supplementary Figure 1. Expression of CUGBP1 in non-parenchymal liver cells treated with TGF-β
 Supplementary Figures Supplementary Figure 1. Expression of CUGBP1 in non-parenchymal liver cells treated with TGF-β and LPS. Non-parenchymal liver cells were isolated and treated with or without TGF-β
An epithelial-to-mesenchymal transition-inducing potential of. granulocyte macrophage colony-stimulating factor in colon. cancer
 An epithelial-to-mesenchymal transition-inducing potential of granulocyte macrophage colony-stimulating factor in colon cancer Yaqiong Chen, Zhi Zhao, Yu Chen, Zhonglin Lv, Xin Ding, Renxi Wang, He Xiao,
Supplementary Figure 1: STAT3 suppresses Kras-induced lung tumorigenesis
 Supplementary Figure 1: STAT3 suppresses Kras-induced lung tumorigenesis (a) Immunohistochemical (IHC) analysis of tyrosine 705 phosphorylation status of STAT3 (P- STAT3) in tumors and stroma (all-time
Supplementary Figure S1: Tanycytes are restricted to the central/posterior hypothalamus
 Supplementary Figure S1: Tanycytes are restricted to the central/posterior hypothalamus a: Expression of Vimentin, GFAP, Sox2 and Nestin in anterior, central and posterior hypothalamus. In the anterior
Nature Immunology: doi: /ni.3866
 Nature Immunology: doi:10.1038/ni.3866 Supplementary Figure 1 The effect of TIPE2 on chemotaxis. a, The expression of TIPE2 in dhl-60c, dhl-60t, TIPE2-expressing and 15/16Q-expressing dhl-60t neutrophils
Supplementary Figure 1. Deletion of Smad3 prevents B16F10 melanoma invasion and metastasis in a mouse s.c. tumor model.
 A B16F1 s.c. Lung LN Distant lymph nodes Colon B B16F1 s.c. Supplementary Figure 1. Deletion of Smad3 prevents B16F1 melanoma invasion and metastasis in a mouse s.c. tumor model. Highly invasive growth
Supporting Information. FADD regulates NF-кB activation and promotes ubiquitination of cflip L to induce. apoptosis
 1 2 Supporting Information 3 4 5 FADD regulates NF-кB activation and promotes ubiquitination of cflip L to induce apoptosis 6 7 Kishu Ranjan and Chandramani Pathak* 8 9 Department of Cell Biology, School
Control GST GST-RAP. α2-mg. 170 kda. b-actin. 42 kda LRP-1
 % of max Supplementary Figure 1 Control GST GST-RP 17 kda α2-mg 42 kda b-actin Gate: CD11c+ (DCs) Gate: F4/8+ (Mfs) IgG Cd11cCre + Lrp1 fl/fl LRP-1 Supplementary figure 1. () MDCs were pretreated with
Supplementary Figure 1. The mir-182 binding site of SMAD7 3 UTR and the. mutated sequence.
 Supplementary Figure 1. The mir-182 binding site of SMAD7 3 UTR and the mutated sequence. 1 Supplementary Figure 2. Expression of mir-182 and SMAD7 in various cell lines. (A) Basal levels of mir-182 expression
Supplementary Figure 1. HOPX is hypermethylated in NPC. (a) Methylation levels of HOPX in Normal (n = 24) and NPC (n = 24) tissues from the
 Methylation levels of HOPX in Normal (n = 24) and NPC (n = 24) tissues from the") Supplementary Figure 1. HOPX is hypermethylated in NPC. (a) Methylation levels of HOPX in Normal (n = 24) and NPC (n = 24) tissues from the genome-wide methylation microarray data. Mean ± s.d.; Student
Supplementary Figure 1. HOPX is hypermethylated in NPC. (a) Methylation levels of HOPX in Normal (n = 24) and NPC (n = 24) tissues from the genome-wide methylation microarray data. Mean ± s.d.; Student
Figure S1, related to Figure 1. Escaper p38a-expressing cancer cells repopulate the tumors (A) Scheme of the mt/mg reporter that expresses a
 Scheme of the mt/mg reporter that expresses a") Cancer Cell, Volume 33 Supplemental Information Targeting p38a Increases DNA Damage, Chromosome Instability, and the Anti-tumoral Response to Taxanes in Breast Cancer Cells Begoña Cánovas, Ana Igea, Alessandro
Cancer Cell, Volume 33 Supplemental Information Targeting p38a Increases DNA Damage, Chromosome Instability, and the Anti-tumoral Response to Taxanes in Breast Cancer Cells Begoña Cánovas, Ana Igea, Alessandro
Supplementary Fig. 1: ATM is phosphorylated in HER2 breast cancer cell lines. (A) ATM is phosphorylated in SKBR3 cells depending on ATM and HER2
 ATM is phosphorylated in SKBR3 cells depending on ATM and HER2") Supplementary Fig. 1: ATM is phosphorylated in HER2 breast cancer cell lines. (A) ATM is phosphorylated in SKBR3 cells depending on ATM and HER2 activity. Upper panel: Representative histograms for FACS
Supplementary Fig. 1: ATM is phosphorylated in HER2 breast cancer cell lines. (A) ATM is phosphorylated in SKBR3 cells depending on ATM and HER2 activity. Upper panel: Representative histograms for FACS
Pathologic Stage. Lymph node Stage
 ASC ASC a c Patient ID BMI Age Gleason score Non-obese PBMC 1 22.1 81 6 (3+3) PBMC 2 21.9 6 6 (3+3) PBMC 3 22 84 8 (4+4) PBMC 4 24.6 68 7 (3+4) PBMC 24. 6 (3+3) PBMC 6 24.7 73 7 (3+4) PBMC 7 23. 67 7 (3+4)
Figure S1. Western blot analysis of clathrin RNA interference in human DCs Human immature DCs were transfected with 100 nm Clathrin SMARTpool or
 Figure S1. Western blot analysis of clathrin RNA interference in human DCs Human immature DCs were transfected with 100 nm Clathrin SMARTpool or control nontargeting sirnas. At 90 hr after transfection,
D CD8 T cell number (x10 6 )
") IFNγ Supplemental Figure 1. CD T cell number (x1 6 ) 18 15 1 9 6 3 CD CD T cells CD6L C CD5 CD T cells CD6L D CD8 T cell number (x1 6 ) 1 8 6 E CD CD8 T cells CD6L F Log(1)CFU/g Feces 1 8 6 p
IFNγ Supplemental Figure 1. CD T cell number (x1 6 ) 18 15 1 9 6 3 CD CD T cells CD6L C CD5 CD T cells CD6L D CD8 T cell number (x1 6 ) 1 8 6 E CD CD8 T cells CD6L F Log(1)CFU/g Feces 1 8 6 p
B16-F10 (Mus musculus skin melanoma), NCI-H460 (human non-small cell lung cancer
, NCI-H460 (human non-small cell lung cancer") Electronic Supplementary Material (ESI) for ChemComm. This journal is The Royal Society of Chemistry 2017 Experimental Methods Cell culture B16-F10 (Mus musculus skin melanoma), NCI-H460 (human non-small
Electronic Supplementary Material (ESI) for ChemComm. This journal is The Royal Society of Chemistry 2017 Experimental Methods Cell culture B16-F10 (Mus musculus skin melanoma), NCI-H460 (human non-small