Hepatic overexpression of CD36 improves glycogen homeostasis and attenuates high-fat
|
|
|
- Jeffry Baldwin
- 6 years ago
- Views:
Transcription
1 MCB Accepted Manuscript Posted Online 15 August 2016 Mol. Cell. Biol. doi: /mcb Copyright 2016, American Society for Microbiology. All Rights Reserved. 1 2 Hepatic overexpression of CD36 improves glycogen homeostasis and attenuates high-fat diet induced hepatic steatosis and insulin resistance Wojciech G. Garbacz 1, Peipei Lu 1 Tricia M. Miller 2, Samuel M. Poloyac 2, Nicholas S. Eyre 3, Graham Mayrhofer 3, Meishu Xu 1, Songrong Ren 1, Wen Xie 1,4,# 1 Center for Pharmacogenetics and Department of Pharmaceutical Sciences, University of Pittsburgh, Pittsburgh, Pennsylvania 2 Department of Pharmaceutical Sciences, University of Pittsburgh, Pittsburgh, Pennsylvania 3 School of Biological Sciences, The University of Adelaide, Adelaide, Australia Department of Pharmacology and Chemical Biology, University of Pittsburgh, Pittsburgh, Pennsylvania #Corresponding author: Center for Pharmacogenetics, 306 Salk Pavilion, University of Pittsburgh, Pittsburgh, PA wex6@pitt.edu Running Title: CD36 regulates hepatic glycogen homeostasis Key Words: fatty acid translocase; fatty liver; glycogen homeostasis; insulin resistance; transgenic mice Abbreviations: AA, arachidonic acid; AMPK, AMP-activated protein kinase; ANGPTL4: angiopoietin like 4; ATGL: adipose triglyceride lipase; CD36Tg, CD36 transgenic mice; CPT1: carnitine palmitoyltransferase I; Dox, doxycycline; FAT/CD36, fatty acid translocase; G6P, glucose-6-phosphate; GP, glycogen phosphorylase; GS, glycogen synthase; GTT, glucose tolerance test; G6Pase: glucose 6-phosphatase; GLUT4: glucose transporter type 4; HSL: hormone sensitive lipase; 20-HETE, 20-hydroxyeicosatetraenoic acid; HFD, high-fat diet; ITT, insulin tolerance test; PGs, prostaglandins; PP1, protein phosphatase 1; PPARα: peroxisome proliferator-activated receptor α; PPARγ: peroxisome proliferator-activated receptor γ; PGC1α: PPARγ coactivator 1α; PEPCK: phosphoenolpyruvate carboxykinase; VLDL, very-low density lipoprotein 35 1
2 Abstract The common complications in obesity and type 2 diabetes include hepatic steatosis and disruption of the glucose-glycogen homeostasis, leading to hyperglycemia. The fatty acid translocase (FAT/CD36), whose expression is inducible in obesity, is known for its function in fatty acid uptake. Previous work by us and others suggested that CD36 plays an important role in hepatic lipid homeostasis, but the results have been conflicting and the mechanisms were not well understood. In this study, by using the CD36 over-expressing transgenic (CD36Tg) mice, we uncovered a surprising function of CD36 in regulating glycogen homeostasis. Overexpression of CD36 promoted glycogen synthesis and as a result, CD36Tg mice were protected from fasting hypoglycemia. When challenged with high-fat diet (HFD), CD36Tg mice showed unexpected attenuation of hepatic steatosis, increased very-low density lipoprotein (VLDL) secretion, and improved glucose tolerance and insulin sensitivity. The HFD-fed CD36Tg mice also showed decreased levels of pro-inflammatory hepatic prostaglandins and 20- hydroxyeicosatetraenoic acid (20-HETE), a potent vasoconstrictive and pro-inflammatory arachidonic acid metabolite. We propose that CD36 functions as a protective metabolic sensor in the liver under the lipid overload and metabolic stress. CD36 may be explored as a valuable therapeutic target for the management of metabolic syndrome. 2
3 Introduction Individuals with metabolic syndrome or type 2 diabetes are susceptible to non-alcoholic fatty liver disease (41) and disruption of hepatic glucose and glycogen homeostasis (20). Hepatic steatosis is defined as an excess accumulation of fat in the hepatocytes. Previous reports suggested that the fatty acid translocase (FAT/CD36) plays an important role in hepatic lipid homeostasis (12, 17, 39, 50). CD36 is a multi-ligand class B scavenger receptor with high affinity towards lipids and lipid-containing ligands. CD36 is known for its lipid uptake function in the macrophages, skeletal muscle and heart. However, the role of CD36 in hepatic lipid metabolism is still not well understood, and the available evidence is often conflicting, partly due to the lack of a reliable in vivo liver-specific gain of function model to specifically evaluate the function of CD36 in the liver The basal expression of CD36 in the liver is low, however it is highly inducible by a high fat diet (12). The hepatic expression of CD36 is under the transcriptional control of the nuclear receptors: liver X receptor (LXR), pregnane X receptor (PXR), peroxisome proliferator-activated receptors (PPARs), and the aryl hydrocarbon receptor (AhR) (17). Some studies suggested that hepatic CD36, by functioning as a fatty acid transporter, has a role in the pathogenesis of hepatic steatosis (12), obesity (2, 25) and age-related hepatic steatosis (39). Furthermore, we and others reported that induction of CD36 was a common factor in fatty liver following the activation of LXR and PXR (49, 50). On the other hand, recent reports suggested that CD36 signaling might actually be beneficial in preventing fatty liver by promoting the formation and secretion of lipoprotein particles (27). It is conceivable that an in vivo model, in which CD36 expression can 3
4 75 76 be temporally and liver specially regulated, will help to establish the function of CD36 in hepatic lipid metabolism and help to explain the discrepancies arising from earlier studies With CD36 emerging as a key player or even perceived as a causative factor in fatty liver and the associated metabolic syndrome, we hypothesize that CD36 may play an important role in energy metabolism in the liver, including the homeostasis of glycogen, which is known to debilitate in diabetes and contribute to the manifestation of dysglycemia (6, 7, 14). Glycogen is formed in the liver primarily in the postprandial high blood glucose state. The three key enzymes that are involved in hepatic glycogen turnover are glycogenin, glycogen synthase (GS) and glycogen phosphorylase (GP). Glycogenin initiates glycogen synthesis, whereas GS catalyzes the elongation of glycogen chains. GP catalyzes the breakdown of glycogen. GS and GP are enzymatically activated by dephosphorylation and phosphorylation, respectively. The activities of these enzymes are also subjected to allosteric regulation (45). The phosphorylation of GP is catalyzed by several upstream kinases such as the glycogen synthase kinase 3β (GSK3β) and AMP-activated protein kinase (AMPK), whereas the dephosphorylation of GS is facilitated by protein phosphatase 1 (PP1) coupled with the glycogen-targeting regulatory subunits (48) During diabetes and obesity, metabolism of glycogen in the liver is affected when triglyceride accumulation reaches levels that manifest pathologically as fatty liver (7, 34). The GS activity often becomes dysregulated in steatosis, exacerbating the already existing dysglycemia (7, 11, 42). Recent reports showed that hepatic over-expression of the G regulatory subunits of protein phosphatase 1 (PP1) increased hepatic glycogen accumulation, protected mice from fasting hypoglycemia, and accelerated postprandial blood glucose clearance in mice fed with chow diet 4
5 or HFD, or in streptozotocin-induced diabetic rats (19, 31, 48). Given the potential effect of CD36 on steatosis and the link between the homeostasis of glycogen and triglyceride, it is unclear whether CD36 has a direct effect on the homeostasis of glycogen, especially when the animals are under metabolic stresses In this study, we uncovered a surprising function of CD36 in regulating glycogen homeostasis. Over-expression of CD36 in transgenic mice promoted glycogen synthesis and as a result, the CD36Tg mice were protected from fasting hypoglycemia. We also showed that the CD36Tg mice were protected from HFD-induced hepatic steatosis and type 2 diabetes. 5
6 Materials and Methods Mice: To generate the tetracycline inducible Tet-off TetRE-CD36/FABP-tTA transgenic mice, a tetracycline transactivator (tta)-responsive TetRE-CD36 expression construct was assembled consisting of the P tight Tet-responsive promoter (from ptre-tight; Clontech), rat CD36 cdna, SV40 polya signal, loxp-flanked murine phosphoglycerate kinase (Pgk) promoter, neomycin resistance gene (neo r ) cdna, SV40 polya signal and a 3 splice donor sequence flanked by loxp. To generate a gene-targeting construct, the above expression construct was inserted between 5 and 3 homology arms from the murine ROSA26 locus. C57BL/6 Bruce4 embryonic stem cells were subjected to gene targeting by Ozgene (Bentley, Australia) and a single line of TetRE-CD36 knock-in/transgenic mice carrying a single copy of the expression construct targeted to the ROSA26 locus were identified. The TetRE-CD36 mice were then crossed with the hepatocyte-specific LAP-tTA transgenic mice expressing tta under the control of the LAP (C/EBPβ) gene promoter (51) to generate TetRE-CD36/LAP-tTA double-transgenic mice. The CD36Tg mice and the age- and sex-matched WT control mice were in the C56BL/6 background. The LAP-tTA transgenic mice (Strain name B6.Cg-Tg(Cebpb-tTA)5Bjd/) in the C56BL/6 background were purchased from the Jackson Laboratory Fasting of animals: WT and CD36Tg mice maintained on normal chow diet were subjected to 0h, 6h, and 16h fasting to examine the dynamics of hepatic glycogen contents. Ten-week old mice were used for this experiment to ensure the mice have sufficient body weight and size for the 16h fasting
7 Treatment with high-fat diet (HFD) and doxycycline (Dox): WT and CD36Tg mice were subjected to HFD feeding (60% calories from fat) starting at 6-7 weeks of age, fed at libitum for 13 weeks. When necessary, C36Tg mice were treated with Dox by supplementing Dox in the drinking water at the concentration of 1 mg/l Glucose tolerance test (GTT), insulin tolerance test (ITT), and euglycemichyperinsulinemic clamp: GTT were performed on HFD-fed, 16-h fasted mice with an intraperitoneal injection of D-glucose at 1-2 g/kg body weight. ITT was performed on HFD-fed, 6-h fasted mice with an intraperitoneal injection of insulin at 0.75 unit/kg body weight as we have previously described (21). Euglycemic-hyperinsulinemic clamp were performed on HFDfed 16-h fasted mice as we have previously described (10). Mice were constantly infused with [ 3 H]-glucose at 0.05 uci/min through a right jugular vein catheter at the basal state. During the clamp state, mice were infused with a primed dose of human insulin from Novo Nordisk (Princeton, NJ) at 300 milliunits/kg body weight, followed by a constant insulin infusion at 2.5 milliunits/ kg/min. [ 3 H]-glucose were infused at 0.1 uci/min. A variable rate of 20% glucose was infused at the same time to maintain a blood glucose range between 120 and 140 mg/dl. Blood glucose levels were monitored every 10 min. Twenty µl of blood were sampled at the end of the basal state and clamp state for plasma [ 3 H]-glucose measurement. The liver, skeletal muscle and adipose tissues were harvested at the end of the clamp experiment to assess the insulin signaling as we have previously described (10) Measurement of VLDL-triglyceride secretion rate: VLDL secretion rate in vivo were measured as we previously described (17). Briefly, 16-h fasted mice were injected with Triton 7
8 WR1339 (500 mg/kg in saline), a lipoprotein lipase inhibitor that inhibits VLDL hydrolysis, via the tail vein. Plasma samples were collected at 0 and 90 min after injection, and measured for the triglyceride levels. VLDL secretion rate was calculated by subtracting triglyceride levels at 0 min from their counterpart levels at 90 min Liver tissue lipid analysis: This was performed using the chloroform/methanol Folch extraction method (8). The lipid pellets were dissolved in a mixture of 60 μl of tert-butyl alcohol and 40 μl of Triton X-114/ methanol (2:1) mixture. Triglyceride and cholesterol levels were measured using the assay kits from Stanbio (Boerne, TX) Hepatic prostaglandins and arachidonic acid metabolite analysis: Hepatic prostaglandins including PEGF2α, PGE2, PGD2, 6-kPGF1 and 20-HETE and their precursor arachidonic acid were measured by using a MSQ single quadrupole mass spectrometer from Thermo-Finnigan (San Jose, CA, USA) as we have previously described (33, 43) Body composition: The animal s body composition including fat mass, lean mass and water mass was measured by EchoMRI (Houston, TX) Primary hepatocyte preparation and in vitro glycogen synthesis assay: Primary mouse hepatocytes were isolated by collagenase perfusion as we have previously described (17). For the glycogen synthesis assay, primary hepatocytes were washed with PBS three times, and then incubated with DMEM medium without glucose and pyruvate for 2h to deplete glycogen. After 2h, the control cells (for the measurement of basal glycogen) were washed with PBS three times 8
9 and frozen in -20 ⁰C until further analysis. The remaining cells were incubated with DMEM+25 mm glucose and 100 nm insulin for 2h. Cells were washed with PBS three times and 400 µl of 2 M HCl was added per well, then the cells were scrapped and incubated in 95⁰C to hydrolyze glycogen into free glucose. Duplicates of the cells were treated with 400 µl of 2 M NaOH, scrapped and incubated in 95⁰C for 1h for free glucose control. After incubation, HCl was neutralized with an equal volume of 2 M NaOH, and the NaOH samples were neutralized with an equal volume of 2M HCl. Glucose concentrations were measured by a glucose kit from Sigma and the results were normalized by protein concentrations (32) Liver tissue glycogen content analysis: Ten mg frozen liver tissues from control and fasted mice fed with chow diet or HFD were pulverized in liquid nitrogen and then used in subsequent extraction and quantification of liver glycogen levels as previously described (18). The liver glycogen levels were also evaluated by periodic acid Schiff (PAS) glycogen staining Northern blot, real-time PCR, and Western blot analysis: Total RNA was isolated using the Trizol reagent from Invitrogen (Carlsbad, CA). Northern hybridization using 32 P-labeled cdna probe was performed as we previously described (51). SYBR Green-based real-time PCR was performed with the ABI 7300 Real-Time PCR System. Data was normalized against cyclophilin. For Western blot analysis, 3 μl (100 μg of protein) of plasma or 30 μg of protein extracts were separated on SDS-PAGE gels and transferred onto nitrocellulose or PVDF membrane. The primary antibodies used are anti-apob100 (H-15) and anti-apob48 (S-18) from Santa Cruz (Dallas, TX), anti-cd36 (NB ) from Novus (Littleton, CO), anti-pp1cγ (ab134947) from Abcam (Cambridge, MA), anti-ampkα, phospho-ampkα (Thr172), anti-glycogen synthase 9
10 (#3886), anti-phospho-glycogen synthase Ser641 (#3891) and anti-α-tubulin (#2144) from Cell Signaling (Boston, MA), anti-gsk3β (sc-9166), anti-phospho GSK-3β (ser9) (sc-11757), anti- glycogen phosphorylase (sc-46347) from Santa Cruz and anti-β-actin (A1978) from Sigma Histology and oil-red O staining: The general histology was evaluated by H&E staining. For the oil-red O staining, liver tissues were embedded in optimal cutting temperature compound and sectioned into 5-µm-thick cryosections and stained with Oil Red O (0.5% in isopropanol) from Sigma-Aldrich Statistics: Statistical analysis was performed using the unpaired Student t test in GraphPad Prism software (San Diego, CA). Statistical significance threshold was set at P<0.05. Data represent mean ± SD Study approval: The Central Animal Facility of the University of Pittsburgh is fully accredited by AALAC. All procedures were performed in accordance with relevant federal guidelines and with the approval of the University of Pittsburgh ethical committee. 10
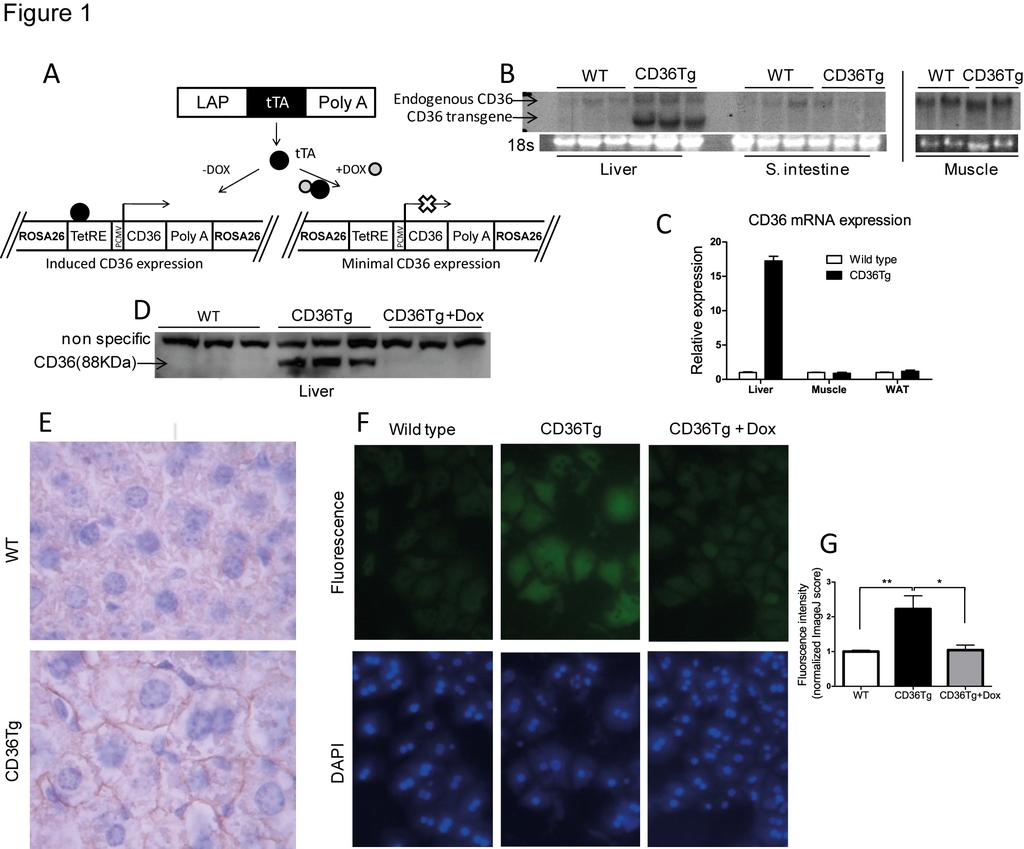
11 Results Creation of CD36 transgenic (CD36Tg) mice that overexpress CD36 in the liver To study the hepatic function of CD36 in vivo, we generated the inducible and liver specific CD36Tg mice using the Tet-Off system as outlined in Fig. 1A. A single copy of the tetracycline response element (TetRE)-CD36 transgene was site-specifically knocked into the mouse ROSA26 gene locus via homologous recombination. The resulting TetRE-CD36 transgenic mice were then bred with the liver-specific LAP-tTA transgenic mice expressing the tetracycline transactivator (tta) under the control of the LAP (C/EBPβ) gene promoter (51). The liver/hepatocyte-specific expression of the CD36 transgene was confirmed by Northern blotting (Fig. 1B) and real-time PCR analysis (Fig. 1C). The transgene expression was undetectable in extrahepatic tissues, such as the small intestine, skeletal muscle and white adipose tissue (Fig. 1B and 1C). The protein expression from the transgene was verified by Western blotting and as expected, treatment of the CD36Tg mice with Dox silenced the transgene expression (Fig. 1D). The CD36 transgenic protein expression was estimated to be 16 fold of the endogenous CD36 level when mice were maintained in chow diet (Fig. 1D). Immunohistochemistry showed that the over-expressed CD36 had a predominant hepatocyte membrane distribution (Fig. 1E), which renders the CD36 protein into a functional translocase (2). The functionality of the transgenic CD36 protein was confirmed in primary hepatocytes, where the uptake of BODIPY-C16, a fluorescent fatty acid analogue and substrate of CD36 (17), was higher in CD36Tg hepatocytes compared to the WT or CD36Tg hepatocytes treated with Dox (Fig. 1F and 1G) Over-expression of CD36 attenuated the fasting-induced steatosis, hypoglycemia and depletion of hepatic glycogen 11
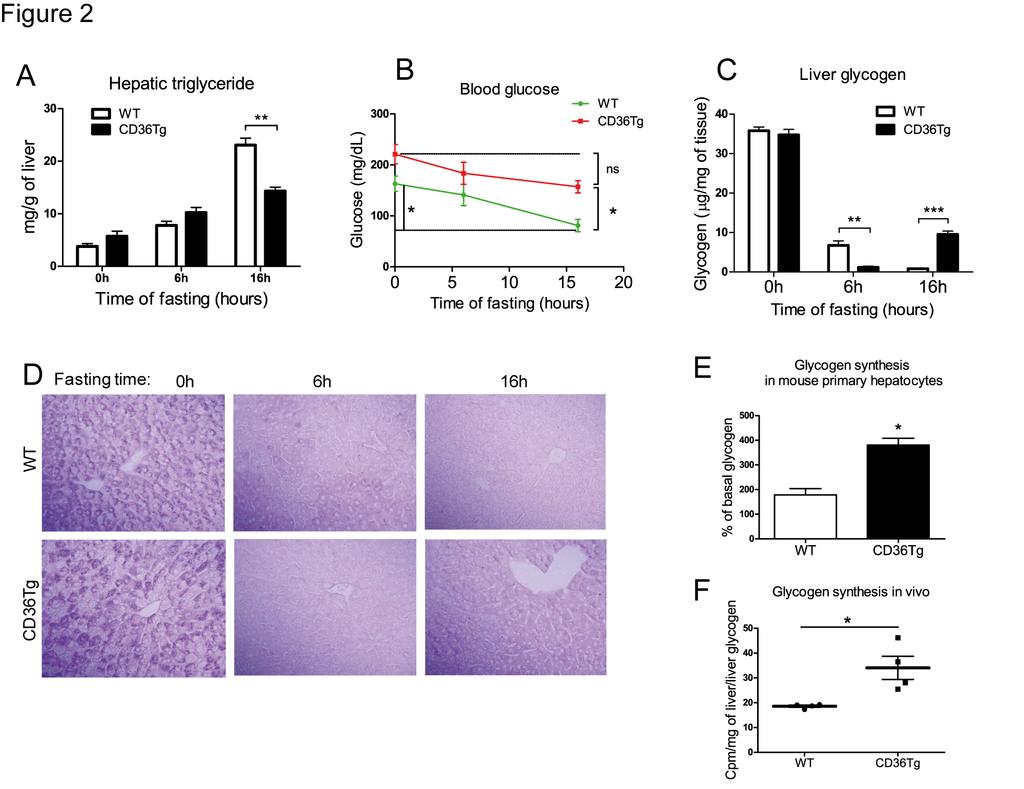
12 Surprisingly, the CD36Tg mice maintained on chow diet did not show obvious signs of fatty liver. We then subjected mice to the metabolic stress of fasting, which is known to induce acute hepatic steatosis (26), and compared the steatotic phenotype to the WT mice. Under the basal condition and after 6h of fasting, CD36Tg mice had marginally higher levels of liver triglycerides than their WT counterparts (Fig. 2A). However, after 16h fasting, CD36Tg mice had significantly lower hepatic triglyceride levels (Fig. 2A), which was not associated with an increased VLDL secretion (data not shown). Fasting is also known to induce hypoglycemia and depletion of hepatic glycogen (46). As expected, WT mice showed significantly decreased blood glucose levels upon the 16h fasting (Fig. 2B). In contrast, the fasting-responsive fall in blood glucose in the CD36Tg mice was not significant, and they were significantly higher than their WT counterparts (Fig. 2B). The fed glucose levels in CD36Tg mice appeared to be higher than in WT animals, but the difference was not statistically significant (Fig. 2B) The fasting response is dependent on glycogen dynamics, and a hallmark of fasting response is glycogen depletion (24). The basal levels of hepatic glycogen were not different between the chow-fed WT and CD36Tg mice (Fig. 2C). After fasting for 6h, liver glycogen was almost completely depleted in the livers of CD36Tg, whereas in the WT mice, glycogen levels were reduced by approximately 80%, but a substantial amount still remained. After fasting for 16h, glycogen was essentially exhausted in the WT mice, while in contrast it had been restored to approximately 35% of the pre-fasting levels in the CD36Tg mice (Fig. 2C). The dynamics of fasting glycogen levels were confirmed by the Periodic Acid Schiff s staining (Fig. 2D). These results suggested that over-expression of CD36 in hepatocytes promoted glycogen synthesis during prolonged starvation and led to partial recovery of this important energy store. 12
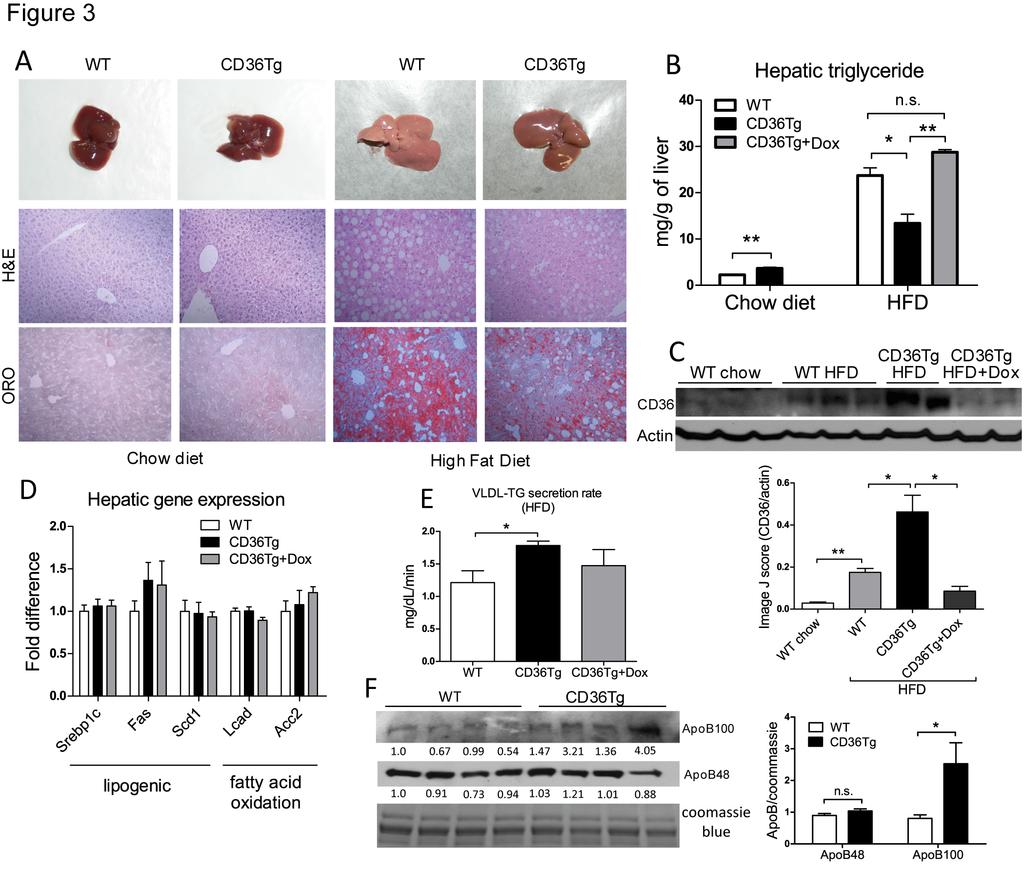
13 To determine whether over-expression of CD36 was sufficient to induce glycogen synthesis, we went on to directly measure glycogen synthesis in isolated primary hepatocytes in vitro. Insulin is known to promote hepatic glucose uptake and glycogen synthesis (3). In response to high glucose and insulin stimulation, glycogen synthesis in primary hepatocytes from CD36Tg mice was twice of those in hepatocytes from WT mice (Fig. 2E). Although this in vitro glycogen synthesis model does not mimic the fasting condition, our results suggested that CD36 overexpression or ablation was sufficient to affect the glycogen synthesis. CD36Tg mice also showed an increased glycogen synthesis in vivo, because under the euglycemic-hyperinsulinemic clamp condition, the hepatic synthesis of glycogen was higher in CD36Tg mice than in WT mice (Fig. 2F) CD36Tg mice were protected from high-fat diet (HFD) induced hepatic steatosis We then challenged mice with a HFD, another metabolic stress and a model of fatty liver, obesity and type 2 diabetes. When mice were maintained on chow diet, there were no obvious differences in the gross appearance and histology of the liver between the WT and CD36Tg mice (Fig. 3A, left). Upon a 19-week HFD feeding, the CD36Tg liver appeared less fatty, which was confirmed by H&E and Oil-red O staining (Fig. 3A, right). Indeed, CD36Tg mice had a modest but significant increase in liver triglyceride levels when maintained on chow diet. Upon the HFD feeding, the liver triglyceride levels in CD36Tg mice were significantly lower than their WT counterparts and this effect was abolished by the Dox treatment (Fig. 3B). When the expression of CD36 was examined, we found the expression of hepatic CD36 in WT mice was induced by HFD feeding (Fig. 3C), consistent with a previous report (12). The hepatic expression of CD36 13
14 in the HFD-fed CD36Tg mice was approximately 2.5 fold of that in the HFD-fed WT mice (Fig. 3C). These results suggested that the elevated expression of hepatic CD36 is not a sufficient explanation for the HFD-responsive steatosis. It was noted that the HFD effect on the expression of endogenous CD36 was somehow diminished in Dox-treated CD36Tg mice, perhaps through a yet to be defined feedback regulation of the endogenous CD In investigating the molecular basis for the attenuated HFD-induced steatosis in CD36Tg mice, we found the expression of major genes involved in de novo lipogenesis and fatty acid β- oxidation was not different between the HFD-fed CD36Tg and WT mice (Fig. 3D). Instead, the VLDL-triglyceride secretion rate in the HFD-fed CD36Tg mice was significantly higher than the WT mice, and this effect was attenuated by the Dox treatment (Fig. 3E). The serum level of lipoprotein protein ApoB100 (liver origin), an essential component of the VLDL particles, was increased; whereas the serum level of ApoB48 (intestine origin) was not affected (Fig. 3F). These results suggested that an increased liver triglyceride export might have contributed to the overall attenuation of the HFD-induced steatosis in the CD36Tg mice. The increase of VLDL secretion in the CD36Tg mice was also consistent with the reduction of VLDL secretion recently reported for the CD36-/- mice (27) Analysis of serum biochemistry revealed decreased levels of alanine aminotransferase (ALT) and aspartate aminotransferase (AST) in HFD-fed CD36Tg mice in a transgene-dependent manner (Table 1), consistent with the relief of hepatic steatosis in this genotype. The triglyceride level was not affected by the transgene despite the increased VLDL secretion, suggesting an increased clearance of triglycerides from the circulation. CD36Tg mice also showed a transgene- 14
15 dependent increase in total serum cholesterol, the mechanism of which remains to be understood. The fasting blood glucose, serum free fatty acid and fasting insulin levels were not significantly affected by the transgene in the HFD groups (Table 1) Over-expression of CD36 attenuated HFD-induced insulin resistance When treated with HFD, the CD36 transgene had little effect on the body weight gain (Fig. 4A), fat mass gain (Fig. 4B), or food intake (Fig. 4C). Metabolic cage analysis showed that the CD36Tg mice had increased oxygen consumption during the dark phase (Fig. 4D). However, the respiratory exchange ratio (RER) (Fig. 4E) and locomotive movement (Fig. 4F) were not affected. The heat generated (Fig. 4G) showed a trend of increase, but the difference did not reach statistical significance. In addition, the HFD-fed CD36Tg mice showed significantly improved performance in the glucose tolerance test (GTT) (Fig. 4H) and insulin tolerance test (ITT) compared with WT mice (Fig. 4I), and both benefits were abolished upon the Dox treatment To assess the effects of CD36 on hepatic and peripheral insulin sensitivity, we performed the hyperinsulinemic euglycemic clamp experiment on HFD-fed mice. Compared to the WT mice, the CD36Tg mice required an approximately double amount of glucose infusion to maintain euglycemia (Fig. 5A), indicating enhanced insulin-stimulated glucose uptake and metabolism in this genotype. When the glucose production was measured, the CD36Tg mice exhibited a dramatic suppression of hepatic glucose production during the insulin-stimulated clamp state (Fig. 5B), suggesting an enhancement of hepatic insulin sensitivity. Additionally, the glucose disposal rate during the clamp state was significantly higher in the CD36Tg mice (Fig 5C). To 15
16 directly assess the insulin effect, we i.p. injected mice with insulin, and liver was collected for the measurement of Akt phosphorylation by Western blotting. As shown in Fig. 5D, the CD36Tg mice showed increased basal and insulin responsive Akt phosphorylation in the liver. Consistent with their increased glucose tolerance (Fig. 4H) and insulin sensitivity (Fig. 4I and Fig. 5A-5C) and decreased glucose production during the hyperinsulinemic euglycemic clamp (Fig. 5B), the CD36Tg mice showed an overall suppression of hepatic genes that are involved in gluconeogenesis, including the significant inhibition of peroxisome proliferator-activated receptor γ coactivator 1α (PGC1α) and glucose 6-phosphatase (G6Pase) gene expression, which was abolished upon the Dox treatment (Fig. 5E) Interestingly, the metabolic benefit of the transgene was also observed in the skeletal muscle, despite the lack of transgene targeting in this tissue. The basal Akt phosphorylation in the skeletal muscle was markedly increased in the CD36Tg mice, but acute treatment with insulin did not lead to a further increase (Fig. 5D). The skeletal muscle tissues harvested upon the clamp (i.e., under continuous insulin infusion) also showed a higher level of Akt phosphorylation in the CD36Tg mice (data not shown). The metabolic benefits of the transgene in the skeletal muscle were also supported by the decreased tissue triglyceride levels (Fig. 5F), decreased expression of lipogenic Srebp-1c gene, increased expression of fatty acid oxidative long-chain fatty acid Acyl CoA dehydrogenase (Lcad) (Fig. 5G), and decreased expression of genes indicative of inflammation such as TNFα (data not shown). The muscle expression of carnitine palmitoyltransferase I (Cpt1) and peroxisome proliferator-activated receptor α (PPARα) also tended to be higher (Fig. 5G). Meanwhile, the muscle mrna expression of lipoprotein lipase (LPL), which hydrolyzes triglycerides, was significantly increased in CD36Tg mice, whereas the 16
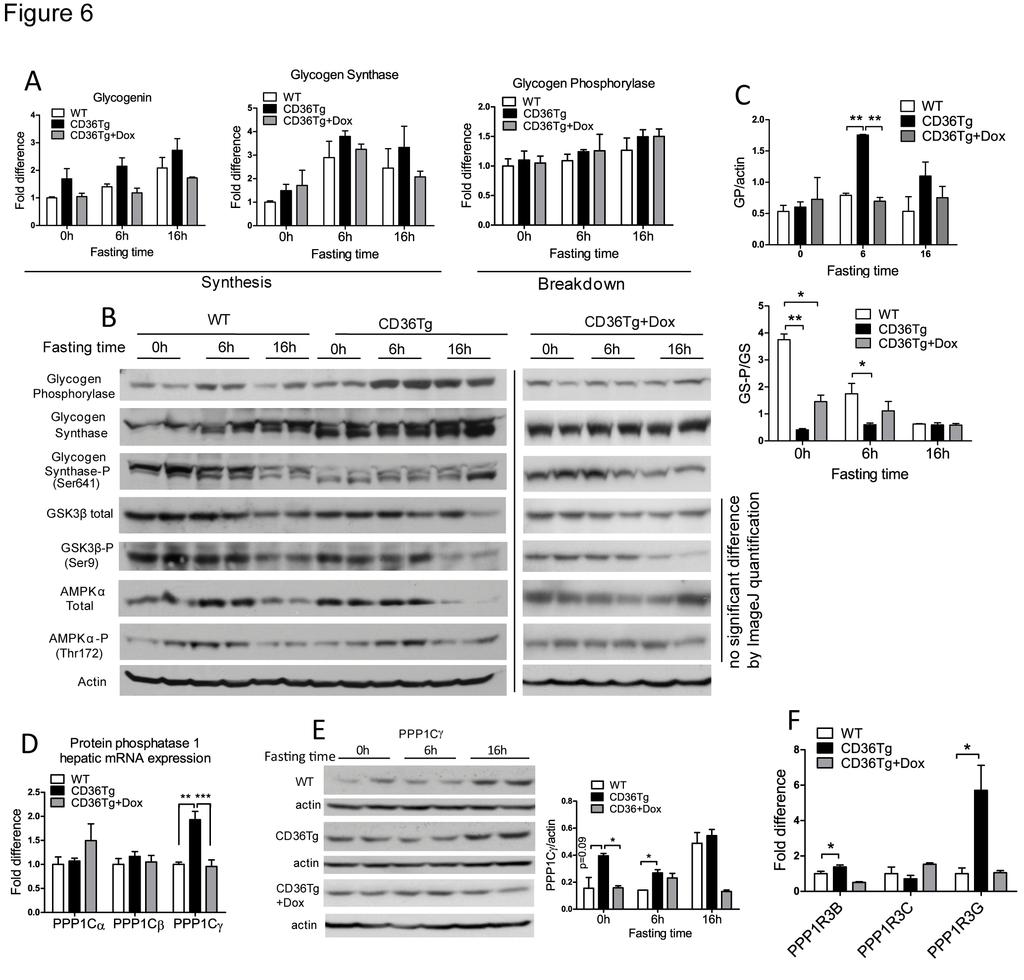
17 expression of glucose uptake transporter GLUT4 was not affected (Fig. 5H). In the skeletal muscle, the glycogen contents were not different between the WT and CD36Tg mice (Fig. 5I), suggesting that the glycogen phenotype was liver specific The induction of LPL appeared to be skeletal muscle specific, because the expression of LPL in WAT was not affected by the transgene (Fig. 5J). The adipose expression of hormone sensitive lipase (HSL), adipose triglyceride lipase (ATGL), angiopoietin like 4 (ANGPTL4), perilipin and adiponectin tended to be higher in CD36Tg mice, but the differences did not reach statistical significance (Fig. 5J). The morphology of adipocytes in WAT was not affected (data not shown) Molecular mechanism for the promotion of glycogen synthesis by CD36 To understand how glycogen synthesis was enhanced in the CD36Tg mice, we first examined the mrna expression of genes that are involved in glycogen synthesis and breakdown during fasting. Glycogenin initiates the synthesis of glycogen polymers from the glucose molecules, whereas glycogen synthase (GS) is the rate-limiting enzyme for glycogen synthesis. As expected, the expression of both genes tended to increase during fasting, but the relative levels of expression were not statistically different between WT, CD36Tg, or CD36Tg+Dox (Fig. 6A). Glycogen phosphorylase (GP) is responsible for the breakdown of glycogen and release of glucose. The expression of GP was largely unaffected by either the fasting or the genotype (Fig. 6A). These results suggested that the promoting effect of CD36 on glycogen dynamics might not occur at the transcriptional level. When the protein expression of GP was measured, we found the hepatic GP was significantly higher in the CD36Tg mice after 6h of fasting (Fig. 6B), likely through a yet to be defined post-transcriptional mechanism. The levels of GP in Dox-treated 17
18 CD36Tg mice were similar to those of the WT mice. Since the activity of GP is also regulated by phosphorylation, we cannot simply conclude that the increased GP protein expression has contributed to the accelerated glycogen breakdown, or resistance to the fasting-induced hypoglycemia in CD36Tg mice The activity of GS is known to be regulated by phosphorylation (30) and partly by allosteric interactions with glucose-6-phosphate (G6P) (45). The phosphorylation of GS was dramatically different between WT and CD36Tg mice. In WT mice, the expression of GS protein increased steadily with the fasting time, and this was mirrored by the decrease in Ser641 phosphorylation of GS, rendering the enzyme to be more active (Fig. 6B). However, in the livers of CD36Tg mice, the GS protein was not only higher in abundance, but also constitutively dephosphorylated (and thus activated) regardless of fasting time (Fig. 6B). The decreased phosphorylation of GS in CD36Tg mice was attenuated upon the Dox treatment (Fig. 6B). The densitometric quantifications for the protein expression of GP and GS-P/GS are shown in Fig 6C. The phosphorylation of GS is primarily mediated by GSK3β at Ser641, but it can also be mediated by AMPK and PKA. The activities of these kinases are also regulated by phosphorylation (44). We found the total protein and phosphorylation of GSK3β and AMPKα were not significantly affected by the CD36 genotype (Fig. 6B) The lack of evidence that upstream kinase is responsible for the altered GS phosphorylation during fasting, prompted us to examine the effect of the CD36 transgene on the expression of protein phosphatase 1 (PP1). PP1 is responsible for the dephosphorylation and activation of GS (4, 13). PP1 consists of three catalytic subunits, Cα, Cβ and Cγ. We found the basal mrna 18
19 expression of PPP1Cγ was significantly up-regulated in the liver of the CD36Tg mice, but the expression of two other catalytic subunits was not significantly affected (Fig. 6D). The higher expression of PPP1Cγ protein in the CD36Tg mice was confirmed by Western blotting (Fig. 6E). The substrate specificity of PP1 is achieved by its association with regulatory subunits, such as PPP1R3B, PPP1R3C, and PPP1R3G (4, 48). The hepatic mrna expression of PPP1R3B and PPP1R3G was significantly up-regulated in the CD36Tg mice in a transgene-dependent manner, but the expression of PPP1R3C was not affected (Fig. 6F) Over-expression of CD36 affected arachidonic acid metabolism and decreased hepatic levels of prostaglandins and 20-HETE Prostaglandins (PGs) are catabolic metabolites of arachidonic acid (AA). The CD36 signaling has been suggested to play a role in the liberation of AA and subsequent formation of PGs (15). Increased levels of hepatic PGs can negatively affect the hepatic export of VLDL (27, 28). We found the HFD-fed CD36Tg mice had significantly reduced hepatic levels of PGE2, PGF2α, and 6-keto-PGF1 when compared to their WT controls and the CD36Tg+Dox group (Fig. 7A). The decreased PG levels were not due to the lack of AA substrate because the levels of AA were similar in WT and CD36Tg mice (Fig. 6B), but rather was associated with a decreased expression of cyclooxygenase 2 (Cox2) in the liver (Fig. 7C). In addition to the formation of PGs, terminal hydroxylation of AA yields the potent vasoconstrictive and pro-inflammatory eicosanoid 20-hydroxyeicosatetraenoic acid (20-HETE) (33). 20-HETE can induce hyperglycemia through the camp/pka-phk-gp pathway (16), and the 20-HETE levels have been positively associated with liver cirrhosis (37). We found the hepatic level of 20-HETE was significantly reduced in the CD36Tg mice, but it was restored to the WT level upon the Dox 19
20 treatment (Fig. 7D). The metabolism of AA to 20-HETE is catalyzed by the CYP4A/4F enzymes. We found the expression of Cyp4a14 was significantly lower in the CD36Tg mice (Fig. 7E)
21 Discussion Despite the well documented function of CD36 in fatty acid uptake (40) and several reports that associate hepatic CD36 signaling with an increased risk of developing liver steatosis (12, 25, 39, 47, 50), we showed that over-expression of CD36 in the liver of our transgenic mice did not worsen metabolic functions, but rather protected mice from the detrimental metabolic changes caused by HFD feeding and prolonged fasting. The anti-steatotic effect of CD36 is consistent with a report that whole body CD36 ablation exacerbated hepatic steatosis in the ob/ob background (27), but is opposite to a recent study showing that liver-specific knockout of CD36 reduced liver lipid content when the mice were challenged with HFD (47). Future studies are necessary to explain the discrepancies in the fatty liver phenotype between the whole body and liver-specific CD36 knockout models Another intriguing finding is the anti-diabetic effect of the CD36 transgene, which might have been accounted for by the improved liver glycogen dynamics, as evidenced by the constitutive activation of GS, improved glycemic control, and increased insulin sensitivity in our CD36Tg mice. Hepatic glycogen homeostasis under metabolic stress is known to have a profound effect on the whole body energy homeostasis (6, 23). To explain the increased glycogen synthesis, we found the GS protein in the CD36Tg liver was not only higher in abundance, but also constitutively dephosphorylated and thus activated. The increased expression of the catalytic (PP1Cγ) and regulatory (PPP1R3G) subunits of PP1 might have also contributed to the increased glycogen synthesis in the CD36Tg mice. Indeed, modulation of GS (35) or over-expression of the regulatory subunits of PP1 has been shown to relieve diabetes, obesity (19, 48) and steatosis (48). The mechanism by which CD36 affects the expression of PP1Cγ and PPP1R3G remains to 21
22 be defined. Nevertheless, the improved glycogen homeostasis in the CD36Tg mice might explain their protection from fasting-induced hypoglycemia, because liver glycogen breakdown and synthesis is essential in controlling blood glucose (36). In addition to the improved liver glycogen dynamics, the suppression of hepatic gluconeogenesis and the metabolic benefit in the skeletal muscle may have also contributed to the anti-diabetic phenotype in our CD36Tg mice. Since the CD36 transgene was specifically targeted to the hepatocytes, we speculate the metabolic benefit in the skeletal muscle might be secondary to the improved liver metabolism. Although there were no changes in the respiratory exchange ratio (Fig. 4E) and locomotive movement (Fig. 4F), the oxygen consumption during dark phase was clearly increased in the transgenic mice (Fig. 4D). The CD36Tg mice also showed a tendency of increased heat generation (Fig. 4G). The overall phenotype of the CD36Tg mice might reflect a compensatory mechanism caused by increased triglyceride shift from the liver to the peripheral tissues, such as the skeletal muscle and brown adipose tissue, in which the preferred energy source is lipids. Interestingly, despite their anti-diabetic phenotype, the CD36Tg mice showed little changes in body mass (Fig. 4A), fat mass (Fig. 4B) or food intake (Fig. 4C), which was consistent with the notion that animal models with enhanced glycogen synthesis revealed little changes in body weight (19, 22, 31, 48) We also observed the inhibition of hepatic prostaglandin formation in our CD36Tg mice, which may have contributed to the increased glycogen synthesis. Prostaglandins such as PGE 2 and PGF 2 were reported to have inhibitory effects on GS (9). However, it is noted that the effect of prostaglandins on glycogen synthesis has been controversial. For example, Okumura and colleagues reported that PGE 2 can actually stimulate glycogen synthesis in rat hepatocytes, and 22
23 this effect might depend on the concentrations of calcium in the incubation medium (9). Interestingly, the intracellular concentrations of calcium can be regulated by CD36 (15). Additionally, PGE 2 was reported to decrease glucagon-stimulation of GP activity (34), which may help to explain the fast depletion of glycogen in CD36Tg mice during the early phase of fasting and the consequent protection from the fast responsive hypoglycemia. Meanwhile, the constitutive activation of GS in the CD36Tg mice restores the glycogen deposits more efficiently in these mice than in the WT mice. The sources of glycogen replenishment are most likely the gluconeogenic precursors or glycerol released during lipolysis (5, 29). However, we cannot exclude the possibility that mechanisms other than the inhibition of prostaglandin formation may have accounted for the increased glycogen synthesis in our CD36Tg mice. Due to the lack of PG phosphorylation results, we cannot exclude the possibility that changes in the rate of glycogen breakdown may have also contributed to the overall improvement in glycogen homeostasis. Moreover, in the absence of an unbiased metabolomics analysis, it is not our intention to attribute changes in the prostaglandins levels as the driving force for the metabolic phenotypes of our CD36Tg mice The suppression of PGs may have contributed to the increased VLDL secretion, because PGs are known to inhibit VLDL secretion from the liver (1, 27). The suppressed PG production and increased VLDL secretion in our CD36Tg mice were both consistent with the increased PG levels and decreased VLDL secretion reported for the ob/ob-cd36 -/- mice (27). It is noted that the whole body knockout of CD36 was used in the ob/ob-cd36 -/- study, so we cannot exclude the possibility that a loss of CD36 in extrahepatic tissues may have contributed to the PG phenotype. Nevertheless, it is likely that in our CD36Tg mice, amelioration of diet- or fasting- 23
24 induced steatosis resulted from a synergistic effect of enhanced glycogen turnover and increased VLDL secretion, supporting our hypothesis that CD36 functions as a protective fatty acid sensor in the liver. In addition to the reduction of PGs, we showed the hepatic level of 20-HETE was also decreased in the CD36Tg mice without affecting the level of the parent arachidonic acid. The decreased formation of 20-HETE may have also contributed to the overall improvement of metabolic function, because this arachidonic acid metabolite has been shown to induce hyperglycemia (16) In summary, we have uncovered a novel function of CD36 in regulating glycogen homeostasis and fasting hypoglycemia, although the mechanism by which CD36 affects glycogen homeostasis is yet to be clearly defined. Over-expression of CD36 in the liver conferred resistance to fasting hypoglycemia and metabolic harms caused by HFD feeding. We propose that CD36 serves as a protective fatty acid sensor in the liver. Rather than being a causative factor of steatosis, the induction of CD36 under HFD feeding or obesity may represent a protective response against metabolic stress and lipid overload. Manipulation of the expression or activity of hepatic CD36 may represent a novel approach to manage metabolic syndrome Funding information The study was supported in part by NIH grants DK and DK Author contributions Participated in research design: W. G. Garbacz, N. Eyre, G. Mayrhofer, W. Xie. Conducted experiments: W. G. Garbacz, P. Lu, T. C. Miller, N. Eyre, M. Xu, S. Ren. Performed data 24
25 analysis: W. G. Garbacz, S. M. Poloyac, W. Xie. Wrote or contributed to writing of the manuscript: W. G. Garbacz, S. M. Poloyac, N. Eyre, G. Mayrhofer, W. Xie. Acquired funding: W. Xie Conflict of interest statement The authors have declared that no conflict of interest exists
26 Chow Diet HFD WT (n=5) CD36Tg (n=4) CD36Tg+d ox (n=4) WT (n=7) CD36Tg (n=6) CD36Tg+d ox (n=4) Total cholesterol (mg/dl) 114.3± ± ± ± ±15.6 * * 137.9±14.5 Triglyceride (mg/dl) 51.8± ± ± ±20.0 # 75.0± ±7.7 Free fatty acids (μm) 318.5± ± ± ±94.7 ## 526.5± ± ALT (U/L) 26.4± ± ± ±6.7 ## 45.7±17.4 * 82.5±30.0 AST (U/L) 62.9± ± ± ±38.8 ## 166.4±17. 6 * 265.9±65.1 Fasting blood glucose (mg/dl) 128.7± ± ± ±35.6 # 190.1± ±23.3 Fasting insulin (ng/ml) 0.4± ± ± ±4.08 ## 12.4± ± Table 1. Serum biochemistry of WT, CD36Tg and CD36Tg+Dox mice fed chow diet or HFD for 19 weeks. *, P<0.05; ** P<0.01, compared to the WT within the diet group. #, P<0.05; ## P<0.01, compared WT/HFD to the WT/Chow to validate the HFD model
27 Figure Legends Figure 1. Creation of CD36Tg mice that overexpress CD36 in the liver. (A) The Tet-off transgenic system to express CD36 in the liver. (B and C) The mrna expression of endogenous and transgenic CD36 (B) and transgenic CD36 (C) was detected by Northern blotting and realtime PCR, respectively. The Northern blotting probe detects both the endogenous and transgenic CD36, whereas the real-time PCR detects specifically the transgenic CD36. (D) Protein expression of the transgene and its silencing by doxycycline (Dox) was measured by Western blotting. (E) Immunohistochemical staining of CD36. (F) Uptake of fluorescent fatty acid analogue BODIPY-C16 by hepatocytes isolated from WT mice and CD36Tg mice treated with or without Dox. (G) Fluorometric quantification of the BODIPY-C16 uptake in. All mice were maintained on chow diet. *, P<0.05; **, P< Figure 2. Over-expression of CD36 attenuated the fasting-induced steatosis, hypoglycemia and depletion of hepatic glycogen. (A to D) Mice maintained on chow diet were subjected to 6h and 16h fasting before measurement of liver triglyceride levels (A), blood glucose (B), liver glycogen level (C), and liver Periodic Acid Schiff s (PAS) staining (D). n=4 for all groups. (E) Insulin and glucose-stimulated glycogen synthesis rate in primary mouse hepatocytes. (F) Incorporation of [ 3 H]-glucose into hepatic glycogen during the euglycemic-hyperinsulinemic clamp. WT, n=7; CD36Tg, n=6. *, P<0.05; **, P<0.01; ***, P<0.001; ns, statistically not significant Figure 3. CD36Tg mice were protected from HFD induced hepatic steatosis. (A) Gross appearance (top) and histology (bottom, H&E and Oil-red O staining) of livers of mice 27
28 maintained on chow diet (left) and mice that have been fed with HFD for 19 weeks (right). (B) Hepatic triglyceride levels in mice maintained on chow diet and those that have been fed with HFD for 19 weeks in the absence or presence of Dox. n=5. (C) Expression of liver CD36 as measured by Western blotting. Shown below are the densitometric quantifications of the blots. (D) The hepatic expression of genes involved in lipogenesis and fatty acid oxidation in HFD-fed mice was measured by real-time PCR. n=5. (E) The very-low density lipoprotein triglyceride (VLDL-TG) secretion rate in HFD-fed WT, CD36Tg and CD36Tg+Dox mice. n=4. (F) The serum levels of ApoB100 and ApoB48 were measured by Western blotting. The serum samples were run on two parallel gels, one was used for coomassie blue staining as a loading control and the second gel was used for ApoB100/48 Western blotting. The densitometric intensity was normalized to the coomassie blue staining. The densitometric scores for individual lanes are labeled and shown on the right is the statistical analysis of the densitometric quantification. *, P<0.05; **, P<0.01; n.s., statistically not significant Figure 4. CD36 over-expression improved glucose homeostasis and increased oxygen consumption. All mice were fed with HFD for 19 weeks. (A to C) HFD-responsive dynamics of body weight gain (A), fat mass gain as measured by MRI (B), and food intake (C) in WT mice and CD36Tg mice treated without or with Dox. n=7-9. (D) Oxygen consumption throughout the light-dark cycle. n=4. (E to G) Metabolic cage analysis of respiratory exchange ratio (RER, E), locomotive movement (F) and heat generated (G). n=4. (H and I) Glucose tolerance test (GTT, H) and insulin tolerance test (ITT, I) in WT mice and CD36Tg mice treated without or with Dox. The area under the curve (AUC) was used to quantify the GTT results. n=5. */#, P<0.05; **/##, 28
29 P<0.01; n.s., statistically not significant. The asterisks and hash tags are comparisons between WT and CD36Tg and CD36Tg and CD36Tg+Dox, respectively Figure 5. Hepatic over-expression of CD36 attenuated HFD-induced insulin resistance. Mice are the same as described in Figure 4. (A to C) Euglycemic-hyperinsulinemic clamp measurements of glucose infusion rate (A) endogenous glucose production (B) and glucose disposal rate (C) in HFD-fed WT mice and CD36Tg mice. n=6-7. (D) The basal and insulinstimulated Akt phosphorylation in the liver and skeletal muscle as measured by Western blotting. Shown on the right are the densitometric quantifications of the blots. When necessary, mice were i.p. injected with insulin (0.75 U/kg) 17 min before tissue harvesting. (E) The hepatic mrna expression of gluconeogenic genes. n=6. (F-I) The triglyceride level (F), the expression of genes involved in lipogenesis and fatty acid oxidation (G), expression of glucose transporter GLUT4 and lipoprotein lipase (LPL) (H), and glycogen contents (I) in the skeletal muscle. n=6. (J) White adipose tissue (WAT) mrna expression of genes indicative of adipocyte remodeling and metabolism. n=6. *, P<0.05; **, P<0.01; n.s., statistically not significant Figure 6. Molecular mechanism for the promoting of glycogen synthesis by CD36. WT, CD36Tg and CD36Tg+Dox mice maintained on chow diet were subjected to 6h and 16h fasting. (A) The hepatic mrna expression of glycogenin (left), glycogen synthase (GS, middle) and glycogen phosphorylase (right) genes was measured by real-time PCR. (B) The protein expression of GP, total and Ser641 phosphorylated GS, total and Ser9 phosphorylated GSK3β, and total and phosphorylated AMPKα was measured by Western blotting. (C) Densitometric quantifications of the GP and GS-P/GS expression. (D) The mrna expression of PP1 catalytic 29
30 subunits (PPP1Cs). (E) The protein expression of PPP1Cγ as measured by Western blotting. Shown on the right are the densitometric quantifications of the blots. (F) The mrna expression of PPP1R3B, PPP1R3C and PPP1R3G regulatory glycogen targeting subunits of PP1. n=4 for all groups. *, P<0.05; **, P<0.01; n.s., statistically not significant Figure 7. Over-expression of CD36 affected arachidonic acid metabolism and decreased hepatic levels of prostaglandins and 20-HETE. All mice were fed with HFD for 19 weeks, and the CD36Tg mice were treated without or with Dox. (A) Hepatic prostaglandin levels. (B) Hepatic arachidonic acid level. (C) Hepatic expression of Cox-1 and Cox-2. (D) Hepatic 20- HETE level. (E) Hepatic expression of 20-HETE producing Cyp4a/4f enzymes. n=6 for all groups. *, P<0.05; **, P<0.01; n.s., statistically not significant
31 References 1. Bjornsson, O. G., J. D. Sparks, C. E. Sparks, and G. F. Gibbons Prostaglandins suppress VLDL secretion in primary rat hepatocyte cultures: relationships to hepatic calcium metabolism. J Lipid Res 33: Buque, X., A. Cano, M. E. Miquilena-Colina, C. Garcia-Monzon, B. Ochoa, and P. Aspichueta High insulin levels are required for FAT/CD36 plasma membrane translocation and enhanced fatty acid uptake in obese Zucker rat hepatocytes. Am J Physiol Endocrinol Metab 303:E Cohen, P., H. G. Nimmo, and C. G. Proud How does insulin stimulate glycogen synthesis? Biochem Soc Symp: Cohen, P. T Protein phosphatase 1--targeted in many directions. J Cell Sci 115: de Souza, H. M., G. R. Borba-Murad, R. B. Ceddia, R. Curi, M. Vardanega-Peicher, and R. B. Bazotte Rat liver responsiveness to gluconeogenic substrates during insulin-induced hypoglycemia. Braz J Med Biol Res 34: Deng, B., M. A. Sullivan, J. Li, X. Tan, C. Zhu, B. L. Schulz, and R. G. Gilbert Molecular structure of glycogen in diabetic liver. Glycoconj J 32: Ferrannini, E., A. Lanfranchi, F. Rohner-Jeanrenaud, G. Manfredini, and G. Van de Werve Influence of long-term diabetes on liver glycogen metabolism in the rat. Metabolism 39: Folch, J., M. Lees, and G. H. Sloane Stanley A simple method for the isolation and purification of total lipides from animal tissues. J Biol Chem 226: Gomez-Foix, A. M., J. E. Rodriguez-Gil, J. J. Guinovart, and F. Bosch Prostaglandins E2 and F2 alpha affect glycogen synthase and phosphorylase in isolated hepatocytes. Biochem J 261: Jiang, M., J. He, H. Kucera, N. W. Gaikwad, B. Zhang, M. Xu, R. M. O'Doherty, K. W. Selcer, and W. Xie Hepatic overexpression of steroid sulfatase ameliorates mouse models of obesity and type 2 diabetes through sex-specific mechanisms. J Biol Chem 289: Julian, M. T., N. Alonso, I. Ojanguren, E. Pizarro, E. Ballestar, and M. Puig- Domingo Hepatic glycogenosis: An underdiagnosed complication of diabetes mellitus? World J Diabetes 6: Koonen, D. P., R. L. Jacobs, M. Febbraio, M. E. Young, C. L. Soltys, H. Ong, D. E. Vance, and J. R. Dyck Increased hepatic CD36 expression contributes to dyslipidemia associated with diet-induced obesity. Diabetes 56: Korrodi-Gregorio, L., S. L. Esteves, and M. Fardilha Protein phosphatase 1 catalytic isoforms: specificity toward interacting proteins. Transl Res 164: Krssak, M., A. Brehm, E. Bernroider, C. Anderwald, P. Nowotny, C. Dalla Man, C. Cobelli, G. W. Cline, G. I. Shulman, W. Waldhausl, and M. Roden Alterations in postprandial hepatic glycogen metabolism in type 2 diabetes. Diabetes 53: Kuda, O., C. M. Jenkins, J. R. Skinner, S. H. Moon, X. Su, R. W. Gross, and N. A. Abumrad CD36 protein is involved in store-operated calcium flux, phospholipase A2 activation, and production of prostaglandin E2. J Biol Chem 286: Lai, G., J. Wu, X. Liu, and Y. Zhao HETE induces hyperglycemia through the camp/pka-phk-gp pathway. Mol Endocrinol 26:
32 Lee, J. H., T. Wada, M. Febbraio, J. He, T. Matsubara, M. J. Lee, F. J. Gonzalez, and W. Xie A novel role for the dioxin receptor in fatty acid metabolism and hepatic steatosis. Gastroenterology 139: Lo, S., J. C. Russell, and A. W. Taylor Determination of glycogen in small tissue samples. J Appl Physiol 28: Lopez-Soldado, I., D. Zafra, J. Duran, A. Adrover, J. Calbo, and J. J. Guinovart Liver glycogen reduces food intake and attenuates obesity in a high-fat diet-fed mouse model. Diabetes 64: Lu, B., D. Bridges, Y. Yang, K. Fisher, A. Cheng, L. Chang, Z. X. Meng, J. D. Lin, M. Downes, R. T. Yu, C. Liddle, R. M. Evans, and A. R. Saltiel Metabolic crosstalk: molecular links between glycogen and lipid metabolism in obesity. Diabetes 63: Lu, P., J. Yan, K. Liu, W. G. Garbacz, P. Wang, M. Xu, X. Ma, and W. Xie Activation of aryl hydrocarbon receptor dissociates fatty liver from insulin resistance by inducing fibroblast growth factor 21. Hepatology 61: Luo, X., Y. Zhang, X. Ruan, X. Jiang, L. Zhu, X. Wang, Q. Ding, W. Liu, Y. Pan, Z. Wang, and Y. Chen Fasting-induced protein phosphatase 1 regulatory subunit contributes to postprandial blood glucose homeostasis via regulation of hepatic glycogenesis. Diabetes 60: Macauley, M., F. E. Smith, P. E. Thelwall, K. G. Hollingsworth, and R. Taylor Diurnal variation in skeletal muscle and liver glycogen in humans with normal health and Type 2 diabetes. Clin Sci (Lond) 128: Magnusson, I., D. L. Rothman, B. Jucker, G. W. Cline, R. G. Shulman, and G. I. Shulman Liver glycogen turnover in fed and fasted humans. Am J Physiol 266:E Miquilena-Colina, M. E., E. Lima-Cabello, S. Sanchez-Campos, M. V. Garcia- Mediavilla, M. Fernandez-Bermejo, T. Lozano-Rodriguez, J. Vargas-Castrillon, X. Buque, B. Ochoa, P. Aspichueta, J. Gonzalez-Gallego, and C. Garcia-Monzon Hepatic fatty acid translocase CD36 upregulation is associated with insulin resistance, hyperinsulinaemia and increased steatosis in non-alcoholic steatohepatitis and chronic hepatitis C. Gut 60: Mustonen, A. M., R. Kakela, T. Halonen, V. Karja, E. Vartiainen, and P. Nieminen Fatty acid mobilization in voles--model species for rapid fasting response and fatty liver. Comp Biochem Physiol A Mol Integr Physiol 163: Nassir, F., O. L. Adewole, E. M. Brunt, and N. A. Abumrad CD36 deletion reduces VLDL secretion, modulates liver prostaglandins, and exacerbates hepatic steatosis in ob/ob mice. J Lipid Res 54: Nauli, A. M., F. Nassir, S. Zheng, Q. Yang, C. M. Lo, S. B. Vonlehmden, D. Lee, R. J. Jandacek, N. A. Abumrad, and P. Tso CD36 is important for chylomicron formation and secretion and may mediate cholesterol uptake in the proximal intestine. Gastroenterology 131: Newgard, C. B., L. J. Hirsch, D. W. Foster, and J. D. McGarry Studies on the mechanism by which exogenous glucose is converted into liver glycogen in the rat. A direct or an indirect pathway? J Biol Chem 258: Nuttall, F. Q., D. P. Gilboe, M. C. Gannon, C. B. Niewoehner, and A. W. Tan Regulation of glycogen synthesis in the liver. Am J Med 85:
33 O'Doherty, R. M., P. B. Jensen, P. Anderson, J. G. Jones, H. K. Berman, D. Kearney, and C. B. Newgard Activation of direct and indirect pathways of glycogen synthesis by hepatic overexpression of protein targeting to glycogen. J Clin Invest 105: Parniak, M. A., and N. Kalant Enhancement of glycogen concentrations in primary cultures of rat hepatocytes exposed to glucose and fructose. Biochem J 251: Poloyac, S. M., Y. Zhang, R. R. Bies, P. M. Kochanek, and S. H. Graham Protective effect of the 20-HETE inhibitor HET0016 on brain damage after temporary focal ischemia. J Cereb Blood Flow Metab 26: Puschel, G. P., C. Kirchner, A. Schroder, and K. Jungermann Glycogenolytic and antiglycogenolytic prostaglandin E2 actions in rat hepatocytes are mediated via different signalling pathways. Eur J Biochem 218: Ros, S., M. Garcia-Rocha, J. Calbo, and J. J. Guinovart Restoration of hepatic glycogen deposition reduces hyperglycaemia, hyperphagia and gluconeogenic enzymes in a streptozotocin-induced model of diabetes in rats. Diabetologia 54: Rui, L Energy metabolism in the liver. Compr Physiol 4: Sacerdoti, D., M. Balazy, P. Angeli, A. Gatta, and J. C. McGiff Eicosanoid excretion in hepatic cirrhosis. Predominance of 20-HETE. J Clin Invest 100: Schlein, C., S. Talukdar, M. Heine, A. W. Fischer, L. M. Krott, S. K. Nilsson, M. B. Brenner, J. Heeren, and L. Scheja FGF21 Lowers Plasma Triglycerides by Accelerating Lipoprotein Catabolism in White and Brown Adipose Tissues. Cell Metab 23: Sheedfar, F., M. M. Sung, M. Aparicio-Vergara, N. J. Kloosterhuis, M. E. Miquilena-Colina, J. Vargas-Castrillon, M. Febbraio, R. L. Jacobs, A. de Bruin, M. Vinciguerra, C. Garcia-Monzon, M. H. Hofker, J. R. Dyck, and D. P. Koonen Increased hepatic CD36 expression with age is associated with enhanced susceptibility to nonalcoholic fatty liver disease. Aging (Albany NY) 6: Silverstein, R. L., and M. Febbraio CD36, a scavenger receptor involved in immunity, metabolism, angiogenesis, and behavior. Sci Signal 2:re Stefan, N., K. Kantartzis, and H. U. Haring Causes and metabolic consequences of Fatty liver. Endocr Rev 29: Taylor, A. J., J. M. Ye, and C. Schmitz-Peiffer Inhibition of glycogen synthesis by increased lipid availability is associated with subcellular redistribution of glycogen synthase. J Endocrinol 188: Theken, K. N., Y. Deng, R. N. Schuck, A. Oni-Orisan, T. M. Miller, M. A. Kannon, S. M. Poloyac, and C. R. Lee Enalapril reverses high-fat diet-induced alterations in cytochrome P450-mediated eicosanoid metabolism. Am J Physiol Endocrinol Metab 302:E Viollet, B., S. Horman, J. Leclerc, L. Lantier, M. Foretz, M. Billaud, S. Giri, and F. Andreelli. AMPK inhibition in health and disease. Crit Rev Biochem Mol Biol 45: von Wilamowitz-Moellendorff, A., R. W. Hunter, M. Garcia-Rocha, L. Kang, I. Lopez-Soldado, L. Lantier, K. Patel, M. W. Peggie, C. Martinez-Pons, M. Voss, J. Calbo, P. T. Cohen, D. H. Wasserman, J. J. Guinovart, and K. Sakamoto
34 Glucose-6-phosphate-mediated activation of liver glycogen synthase plays a key role in hepatic glycogen synthesis. Diabetes 62: Wapnir, R. A., and F. Lifshitz Fasting-induced hypoglycemia in experimentally malnourished rats. J Nutr 107: Wilson, C. G., J. L. Tran, D. M. Erion, N. B. Vera, M. Febbraio, and E. J. Weiss Hepatocyte-Specific Disruption of CD36 Attenuates Fatty Liver and Improves Insulin Sensitivity in HFD-Fed Mice. Endocrinology 157: Zhang, Y., D. Xu, H. Huang, S. Chen, L. Wang, L. Zhu, X. Jiang, X. Ruan, X. Luo, P. Cao, W. Liu, Y. Pan, Z. Wang, and Y. Chen Regulation of glucose homeostasis and lipid metabolism by PPP1R3G-mediated hepatic glycogenesis. Mol Endocrinol 28: Zhang, Y. L., A. Hernandez-Ono, P. Siri, S. Weisberg, D. Conlon, M. J. Graham, R. M. Crooke, L. S. Huang, and H. N. Ginsberg Aberrant hepatic expression of PPARgamma2 stimulates hepatic lipogenesis in a mouse model of obesity, insulin resistance, dyslipidemia, and hepatic steatosis. J Biol Chem 281: Zhou, J., M. Febbraio, T. Wada, Y. Zhai, R. Kuruba, J. He, J. H. Lee, S. Khadem, S. Ren, S. Li, R. L. Silverstein, and W. Xie Hepatic fatty acid transporter Cd36 is a common target of LXR, PXR, and PPARgamma in promoting steatosis. Gastroenterology 134: Zhou, J., Y. Zhai, Y. Mu, H. Gong, H. Uppal, D. Toma, S. Ren, R. M. Evans, and W. Xie A novel pregnane X receptor-mediated and sterol regulatory element-binding protein-independent lipogenic pathway. J Biol Chem 281:
35
36
37
38
39
40
General Laboratory methods Plasma analysis: Gene Expression Analysis: Immunoblot analysis: Immunohistochemistry:
 General Laboratory methods Plasma analysis: Plasma insulin (Mercodia, Sweden), leptin (duoset, R&D Systems Europe, Abingdon, United Kingdom), IL-6, TNFα and adiponectin levels (Quantikine kits, R&D Systems
control kda ATGL ATGLi HSL 82 GAPDH * ** *** WT/cTg WT/cTg ATGLi AKO/cTg AKO/cTg ATGLi WT/cTg WT/cTg ATGLi AKO/cTg AKO/cTg ATGLi iwat gwat ibat
 body weight (g) tissue weights (mg) ATGL protein expression (relative to GAPDH) HSL protein expression (relative to GAPDH) ### # # kda ATGL 55 HSL 82 GAPDH 37 2.5 2. 1.5 1..5 2. 1.5 1..5.. Supplementary
Supporting Information Table of content
 Supporting Information Table of content Supporting Information Fig. S1 Supporting Information Fig. S2 Supporting Information Fig. S3 Supporting Information Fig. S4 Supporting Information Fig. S5 Supporting
SUPPLEMENTARY INFORMATION
 SUPPLEMENTARY INFORMATION FOR Liver X Receptor α mediates hepatic triglyceride accumulation through upregulation of G0/G1 Switch Gene 2 (G0S2) expression I: SUPPLEMENTARY METHODS II: SUPPLEMENTARY FIGURES
Supplementary Fig. 1 eif6 +/- mice show a reduction in white adipose tissue, blood lipids and normal glycogen synthesis. The cohort of the original
 Supplementary Fig. 1 eif6 +/- mice show a reduction in white adipose tissue, blood lipids and normal glycogen synthesis. The cohort of the original phenotypic screening was n=40. For specific tests, the
Supplemental Table 1 Primer sequences (mouse) used for real-time qrt-pcr studies
 used for real-time qrt-pcr studies") Supplemental Table 1 Primer sequences (mouse) used for real-time qrt-pcr studies Gene symbol Forward primer Reverse primer ACC1 5'-TGAGGAGGACCGCATTTATC 5'-GCATGGAATGGCAGTAAGGT ACLY 5'-GACACCATCTGTGATCTTG
Supplemental Table 1 Primer sequences (mouse) used for real-time qrt-pcr studies Gene symbol Forward primer Reverse primer ACC1 5'-TGAGGAGGACCGCATTTATC 5'-GCATGGAATGGCAGTAAGGT ACLY 5'-GACACCATCTGTGATCTTG
SUPPLEMENTARY INFORMATION
 SUPPLEMENTARY INFORMATION doi:10.1038/nature11464 Supplemental Figure S1. The expression of Vegfb is increased in obese and diabetic mice as compared to lean mice. a-b, Body weight and postprandial blood
HIV VPR alters fat metabolism. Dorothy E Lewis PhD/Ashok Balasubramanyam MD
 HIV VPR alters fat metabolism Dorothy E Lewis PhD/Ashok Balasubramanyam MD Old Dogma for HIV associated lipodystrophy Differentiation Block (PI) Lipoatrophy Apoptosis (NRTI) Stem cell Preadipocyte Adipocyte
Integration Of Metabolism
 Integration Of Metabolism Metabolism Consist of Highly Interconnected Pathways The basic strategy of catabolic metabolism is to form ATP, NADPH, and building blocks for biosyntheses. 1. ATP is the universal
SUPPLEMENTARY DATA. Supplementary Table 1. Primers used in qpcr
 Supplementary Table 1. Primers used in qpcr Gene forward primer (5'-3') reverse primer (5'-3') β-actin AGAGGGAAATCGTGCGTGAC CAATAGTGATGACCTGGCCGT Hif-p4h-2 CTGGGCAACTACAGGATAAAC GCGTCCCAGTCTTTATTTAGATA
AdPLA ablation increases lipolysis and prevents obesity induced by high fat feeding or leptin deficiency
 AdPLA AdPLA ablation increases lipolysis and prevents obesity induced by high fat feeding or leptin deficiency Kathy Jaworski, Maryam Ahmadian, Robin E. Duncan, Eszter Sarkadi-Nagy, Krista A. Va rady,
3-Thia Fatty Acids A New Generation of Functional Lipids?
 Conference on Food Structure and Food Quality 3-Thia Fatty Acids A New Generation of Functional Lipids? Rolf K. Berge rolf.berge@med.uib.no Fatty acids- Essential cellular metabolites Concentrations must
Supplementary Figure S1. Effect of Glucose on Energy Balance in WT and KHK A/C KO
 Supplementary Figure S1. Effect of Glucose on Energy Balance in WT and KHK A/C KO Mice. WT mice and KHK-A/C KO mice were provided drinking water containing 10% glucose or tap water with normal chow ad
UNIVERSITY OF PNG SCHOOL OF MEDICINE AND HEALTH SCIENCES DIVISION OF BASIC MEDICAL SCIENCES DISCIPLINE OF BIOCHEMISTRY AND MOLECULAR BIOLOGY
 1 UNIVERSITY OF PNG SCHOOL OF MEDICINE AND HEALTH SCIENCES DIVISION OF BASIC MEDICAL SCIENCES DISCIPLINE OF BIOCHEMISTRY AND MOLECULAR BIOLOGY GLUCOSE HOMEOSTASIS An Overview WHAT IS HOMEOSTASIS? Homeostasis
Supplementary Table 1. Primer Sequences Used for Quantitative Real-Time PCR
 Supplementary Table 1. Primer Sequences Used for Quantitative Real-Time PCR Gene Forward Primer (5-3 ) Reverse Primer (5-3 ) cadl CTTGGGGGCGCGTCT CTGTTCTTTTGTGCCGTTTCG cyl-coenzyme Dehydrogenase, very
Metabolic integration and Regulation
 Metabolic integration and Regulation 109700: Graduate Biochemistry Trimester 2/2016 Assistant Prof. Dr. Panida Khunkaewla kpanida@sut.ac.th School of Chemistry Suranaree University of Technology 1 Overview
Metabolism of cardiac muscle. Dr. Mamoun Ahram Cardiovascular system, 2013
 Metabolism of cardiac muscle Dr. Mamoun Ahram Cardiovascular system, 2013 References This lecture Mark s Basic Medical Biochemistry, 4 th ed., p. 890-891 Hand-out Why is this topic important? Heart failure
What systems are involved in homeostatic regulation (give an example)?
?") 1 UNIVERSITY OF PNG SCHOOL OF MEDICINE AND HEALTH SCIENCES DIVISION OF BASIC MEDICAL SCIENCES DISCIPLINE OF BIOCHEMISTRY AND MOLECULAR BIOLOGY GLUCOSE HOMEOSTASIS (Diabetes Mellitus Part 1): An Overview
1 UNIVERSITY OF PNG SCHOOL OF MEDICINE AND HEALTH SCIENCES DIVISION OF BASIC MEDICAL SCIENCES DISCIPLINE OF BIOCHEMISTRY AND MOLECULAR BIOLOGY GLUCOSE HOMEOSTASIS (Diabetes Mellitus Part 1): An Overview
AMPK. Tomáš Kučera.
 AMPK (AMP- ACTIVATED PROTEIN KINASE ) Tomáš Kučera tomas.kucera@lfmotol.cuni.cz Department of Medical Chemistry and Clinical Biochemistry 2nd Faculty of Medicine, Charles University in Prague and Motol
Over-expression of MKP-3 and knockdown of MKP-3 and FOXO1 in primary rat. day, cells were transduced with adenoviruses expressing GFP, MKP-3 or shgfp,
 SUPPLEMENTAL METHODS Over-expression of MKP-3 and knockdown of MKP-3 and FOXO1 in primary rat hepatocytes Primary rat hepatocytes were seeded as described in experimental procedures. The next day, cells
Oxidation of Long Chain Fatty Acids
 Oxidation of Long Chain Fatty Acids Dr NC Bird Oxidation of long chain fatty acids is the primary source of energy supply in man and animals. Hibernating animals utilise fat stores to maintain body heat,
Intermediary metabolism. Eva Samcová
 Intermediary metabolism Eva Samcová Metabolic roles of tissues Four major tissues play a dominant role in fuel metabolism : liver, adipose, muscle, and brain. These tissues do not function in isolation.
Supplementary Figure 1.
 Supplementary Figure 1. FGF21 does not exert direct effects on hepatic glucose production. The liver explants from C57BL/6J mice (A, B) or primary rat hepatocytes (C, D) were incubated with rmfgf21 (2
Supplementary Figure 1. DNA methylation of the adiponectin promoter R1, Pparg2, and Tnfa promoter in adipocytes is not affected by obesity.
 Supplementary Figure 1. DNA methylation of the adiponectin promoter R1, Pparg2, and Tnfa promoter in adipocytes is not affected by obesity. (a) Relative amounts of adiponectin, Ppar 2, C/ebp, and Tnf mrna
Males- Western Diet WT KO Age (wks) Females- Western Diet WT KO Age (wks)
 Females- Western Diet WT KO Age (wks)") Relative Arv1 mrna Adrenal 33.48 +/- 6.2 Skeletal Muscle 22.4 +/- 4.93 Liver 6.41 +/- 1.48 Heart 5.1 +/- 2.3 Brain 4.98 +/- 2.11 Ovary 4.68 +/- 2.21 Kidney 3.98 +/-.39 Lung 2.15 +/-.6 Inguinal Subcutaneous
Relative Arv1 mrna Adrenal 33.48 +/- 6.2 Skeletal Muscle 22.4 +/- 4.93 Liver 6.41 +/- 1.48 Heart 5.1 +/- 2.3 Brain 4.98 +/- 2.11 Ovary 4.68 +/- 2.21 Kidney 3.98 +/-.39 Lung 2.15 +/-.6 Inguinal Subcutaneous
Role of fatty acids in the development of insulin resistance and type 2 diabetes mellitus
 Emerging Science Role of fatty acids in the development of insulin resistance and type 2 diabetes mellitus George Wolf Insulin resistance is defined as the reduced responsiveness to normal circulating
Integrative Metabolism: Significance
 Integrative Metabolism: Significance Energy Containing Nutrients Carbohydrates Fats Proteins Catabolism Energy Depleted End Products H 2 O NH 3 ADP + Pi NAD + NADP + FAD + Pi NADH+H + NADPH+H + FADH2 Cell
Supplementary Materials
 Supplementary Materials 1 Supplementary Table 1. List of primers used for quantitative PCR analysis. Gene name Gene symbol Accession IDs Sequence range Product Primer sequences size (bp) β-actin Actb gi
GPR120 *** * * Liver BAT iwat ewat mwat Ileum Colon. UCP1 mrna ***
 a GPR120 GPR120 mrna/ppia mrna Arbitrary Units 150 100 50 Liver BAT iwat ewat mwat Ileum Colon b UCP1 mrna Fold induction 20 15 10 5 - camp camp SB202190 - - - H89 - - - - - GW7647 Supplementary Figure
Metformin inhibits hepatic gluconeogenesis in mice independently of the LKB1/AMPK pathway via a decrease in hepatic energy state
 Related Commentary, page 2267 Research article Metformin inhibits hepatic gluconeogenesis in mice independently of the LKB1/AMPK pathway via a decrease in hepatic energy state Marc Foretz, 1,2 Sophie Hébrard,
Requires Signaling though Akt2 Independent of the. Transcription Factors FoxA2, FoxO1, and SREBP1c
 Cell Metabolism, Volume 14 Supplemental Information Postprandial Hepatic Lipid Metabolism Requires Signaling though Akt2 Independent of the Transcription Factors FoxA2, FoxO1, and SREBP1c Min Wan, Karla
A Hepatocyte Growth Factor Receptor (Met) Insulin Receptor hybrid governs hepatic glucose metabolism SUPPLEMENTARY FIGURES, LEGENDS AND METHODS
 Insulin Receptor hybrid governs hepatic glucose metabolism SUPPLEMENTARY FIGURES, LEGENDS AND METHODS") A Hepatocyte Growth Factor Receptor (Met) Insulin Receptor hybrid governs hepatic glucose metabolism Arlee Fafalios, Jihong Ma, Xinping Tan, John Stoops, Jianhua Luo, Marie C. DeFrances and Reza Zarnegar
A Hepatocyte Growth Factor Receptor (Met) Insulin Receptor hybrid governs hepatic glucose metabolism Arlee Fafalios, Jihong Ma, Xinping Tan, John Stoops, Jianhua Luo, Marie C. DeFrances and Reza Zarnegar
Energy metabolism - the overview
 Energy metabolism - the overview Josef Fontana EC - 40 Overview of the lecture Important terms of the energy metabolism The overview of the energy metabolism The main pathways of the energy metabolism
Final Review Sessions. 3/16 (FRI) 126 Wellman (4-6 6 pm) 3/19 (MON) 1309 Surge 3 (4-6 6 pm) Office Hours
 126 Wellman (4-6 6 pm) 3/19 (MON) 1309 Surge 3 (4-6 6 pm) Office Hours") Final Review Sessions 3/16 (FRI) 126 Wellman (4-6 6 pm) 3/19 (MON) 1309 Surge 3 (4-6 6 pm) Office ours 3/14 (WED) 9:30 11:30 am (Rebecca) 3/16 (FRI) 9-11 am (Abel) Final ESSENTIALS Posted Lecture 20 ormonal
Final Review Sessions 3/16 (FRI) 126 Wellman (4-6 6 pm) 3/19 (MON) 1309 Surge 3 (4-6 6 pm) Office ours 3/14 (WED) 9:30 11:30 am (Rebecca) 3/16 (FRI) 9-11 am (Abel) Final ESSENTIALS Posted Lecture 20 ormonal
Supplementary Figure 1. DJ-1 modulates ROS concentration in mouse skeletal muscle.
 Supplementary Figure 1. DJ-1 modulates ROS concentration in mouse skeletal muscle. (a) mrna levels of Dj1 measured by quantitative RT-PCR in soleus, gastrocnemius (Gastroc.) and extensor digitorum longus
Supplementary Information
 Supplementary Information Akt regulates hepatic metabolism by suppressing a Foxo1 dependent global inhibition of adaptation to nutrient intake Mingjian Lu 1, Min Wan 1, Karla F. Leavens 1, Qingwei Chu
In The Name Of God. In The Name Of. EMRI Modeling Group
 In The Name Of God In The Name Of God EMRI Modeling Group Cells work together in functionally related groups called tissues Types of tissues: Epithelial lining and covering Connective support Muscle movement
5.0 HORMONAL CONTROL OF CARBOHYDRATE METABOLISM
 5.0 HORMONAL CONTROL OF CARBOHYDRATE METABOLISM Introduction: Variety of hormones and other molecules regulate the carbohydrates metabolism. Some of these have already been cited in previous sections.
Metabolic Syndrome. DOPE amines COGS 163
 Metabolic Syndrome DOPE amines COGS 163 Overview - M etabolic Syndrome - General definition and criteria - Importance of diagnosis - Glucose Homeostasis - Type 2 Diabetes Mellitus - Insulin Resistance
Dr. Mohnen s notes on GLUCONEOGENESIS
 Dr. Mohnen s notes on GLUCONEOGENESIS Note: Even though we did not get through all of these slides during lecture, I advise you to look them all through because they will be helpful to you as you learn
MBB317. Dr D MANGNALL OBESITY. Lecture 2
 MBB317 Dr D MANGNALL OBESITY Lecture 2 When the structure of the insulin receptor was first discovered it was assumed that the active beta subunit tyrosine kinase would phosphorylate some intracellular
AAV-TBGp-Cre treatment resulted in hepatocyte-specific GH receptor gene recombination
 AAV-TBGp-Cre treatment resulted in hepatocyte-specific GH receptor gene recombination Supplementary Figure 1. Generation of the adult-onset, liver-specific GH receptor knock-down (alivghrkd, Kd) mouse
Figure S1. Generation of inducible PTEN deficient mice and the BMMCs (A) B6.129 Pten loxp/loxp mice were mated with B6.
 B6.129 Pten loxp/loxp mice were mated with B6.") Figure S1. Generation of inducible PTEN deficient mice and the BMMCs (A) B6.129 Pten loxp/loxp mice were mated with B6.129-Gt(ROSA)26Sor tm1(cre/ert2)tyj /J mice. To induce deletion of the Pten locus,
Figure S1. Generation of inducible PTEN deficient mice and the BMMCs (A) B6.129 Pten loxp/loxp mice were mated with B6.129-Gt(ROSA)26Sor tm1(cre/ert2)tyj /J mice. To induce deletion of the Pten locus,
Defective Hepatic Autophagy in Obesity Promotes ER Stress and Causes Insulin Resistance
 Cell Metabolism, Volume 11 Supplemental Information Defective Hepatic Autophagy in Obesity Promotes ER Stress and Causes Insulin Resistance Ling Yang, Ping Li, Suneng Fu, Ediz S. Calay, and Gökhan S. Hotamisligil
Integration Of Metabolism
 Integration Of Metabolism Metabolism Consist of Highly Interconnected Pathways The basic strategy of catabolic metabolism is to form ATP, NADPH, and building blocks for biosyntheses. 1. ATP is the universal
SUPPLEMENTARY INFORMATION
 doi:10.1038/nature12652 Supplementary Figure 1. PRDM16 interacts with endogenous EHMT1 in brown adipocytes. Immunoprecipitation of PRDM16 complex by flag antibody (M2) followed by Western blot analysis
AMPK. Tomáš Kuc era. Ústav lékar ské chemie a klinické biochemie 2. lékar ská fakulta, Univerzita Karlova v Praze
 AMPK (AMP- ACTIVATED PROTEIN KINASE ) Tomáš Kuc era Ústav lékar ské chemie a klinické biochemie 2. lékar ská fakulta, Univerzita Karlova v Praze 2013 AMPK AMP-ACTIVATED PROTEIN KINASE present in all eukaryotic
Multiple choice: Circle the best answer on this exam. There are 12 multiple choice questions, each question is worth 3 points.
 CHEM 4420 Exam 4 Spring 2015 Dr. Stone Page 1 of 6 Name Use complete sentences when requested. There are 120 possible points on this exam. Therefore there are 20 bonus points. Multiple choice: Circle the
Effects of growth hormone secretagogue receptor agonist and antagonist in nonobese type 2 diabetic MKR mice
 Effects of growth hormone secretagogue receptor agonist and antagonist in nonobese type 2 diabetic MKR mice Rasha Mosa (MBCHC, M.D, PhD candidate) School of Biomedical Sciences University of Queensland
Successful completion of Phase I clinical trial of AMPK activator O304
 Successful completion of Phase I clinical trial of AMPK activator O304 O304 is safe and very well tolerated in young healthy subjects, in middle aged obese subjects, and in type 2 diabetics in combination
Male 30. Female. Body weight (g) Age (weeks) Age (weeks) Atg7 f/f Atg7 ΔCD11c
 Age (weeks) Age (weeks) Atg7 f/f Atg7 ΔCD11c") ody weight (g) ody weight (g) 34 3 Male 3 27 Female 26 24 22 18 7 9 11 13 15 17 19 21 23 21 18 15 7 9 11 13 15 17 19 21 23 Age (weeks) Age (weeks) Supplementary Figure 1. Lean phenotypes in mice regardless
ody weight (g) ody weight (g) 34 3 Male 3 27 Female 26 24 22 18 7 9 11 13 15 17 19 21 23 21 18 15 7 9 11 13 15 17 19 21 23 Age (weeks) Age (weeks) Supplementary Figure 1. Lean phenotypes in mice regardless
Integration of Metabolism 1. made by: Noor M. ALnairat. Sheet No. 18
 Integration of Metabolism 1 made by: Noor M. ALnairat Sheet No. 18 Data :24/11/2016 SLIDE 2: Metabolism Consist of Highly Interconnected Pathways The basic strategy of catabolic metabolism is to form ATP,
Supplementary Figure 1: Additional metabolic parameters of obesity mouse models and controls. (a) Body weight, (b) blood glucose and (c) insulin
 Body weight, (b) blood glucose and (c) insulin") Supplementary Figure 1: Additional metabolic parameters of obesity mouse models and controls. (a) Body weight, (b) blood glucose and (c) insulin resistance index of homeostatic model assessment (HOMA IR)
Supplementary Figure 1: Additional metabolic parameters of obesity mouse models and controls. (a) Body weight, (b) blood glucose and (c) insulin resistance index of homeostatic model assessment (HOMA IR)
A Central Role of MG53 in Metabolic Syndrome. and Type-2 Diabetes
 A Central Role of MG53 in Metabolic Syndrome and Type-2 Diabetes Yan Zhang, Chunmei Cao, Rui-Ping Xiao Institute of Molecular Medicine (IMM) Peking University, Beijing, China Accelerated Aging in China
Metabolism of acylglycerols and sphingolipids. Martina Srbová
 Metabolism of acylglycerols and sphingolipids Martina Srbová Types of glycerolipids and sphingolipids 1. Triacylglycerols function as energy reserves adipose tissue (storage of triacylglycerol), lipoproteins
SUPPLEMENTARY INFORMATION
 DOI: 10.1038/ncb2211 a! mir-143! b! mir-103/107! let-7a! mir-144! mir-122a! mir-126-3p! mir-194! mir-27a! mir-30c! Figure S1 Northern blot analysis of mir-143 expression dependent on feeding conditions.
Glycogen Metabolism. BCH 340 lecture 9
 Glycogen Metabolism BC 340 lecture 9 Structure of glycogen Glycogen is homopolysaccharide formed of branched D-glucose units The primary glycosidic bond is 1-4-linkage Each branch is made of 6-12 glucose
Supplementary Figure S I: Effects of D4F on body weight and serum lipids in apoe -/- mice.
 Supplementary Figures: Supplementary Figure S I: Effects of D4F on body weight and serum lipids in apoe -/- mice. Male apoe -/- mice were fed a high-fat diet for 8 weeks, and given PBS (model group) or
Niacin Metabolism: Effects on Cholesterol
 Niacin Metabolism: Effects on Cholesterol By Julianne R. Edwards For Dr. William R. Proulx, PhD, RD Associate Professor of Nutrition and Dietetics In partial fulfillments for the requirements of NUTR342
Supplementary Table 1. Metabolic parameters in GFP and OGT-treated mice
 Supplementary Table 1. Metabolic parameters in GFP and OGT-treated mice Fasted Refed GFP OGT GFP OGT Liver G6P (mmol/g) 0.03±0.01 0.04±0.02 0.60±0.04 0.42±0.10 A TGs (mg/g of liver) 20.08±5.17 16.29±0.8
Supplementary Figure 1
 Supplementary Figure 1 A B mir-141, human cell lines mir-2c, human cell lines mir-141, hepatocytes mir-2c, hepatocytes Relative RNA.1.8.6.4.2 Relative RNA.3.2.1 Relative RNA 1.5 1..5 Relative RNA 2. 1.5
Supporting Information. Supporting Tables. S-Table 1 Primer pairs for RT-PCR. Product size. Gene Primer pairs
 Supporting Information Supporting Tables S-Table 1 Primer pairs for RT-PCR. Gene Primer pairs Product size (bp) FAS F: 5 TCTTGGAAGCGATGGGTA 3 429 R: 5 GGGATGTATCATTCTTGGAC 3 SREBP-1c F: 5 CGCTACCGTTCCTCTATCA
By: Dr Hadi Mozafari 1
 By: Dr Hadi Mozafari 1 Gluconeogenesis is the process of converting noncarbohydrate precursors to glucose or glycogen. The major substrates are the glucogenic amino acids, and lactate, glycerol, and propionate.
Biochemistry: A Short Course
 Tymoczko Berg Stryer Biochemistry: A Short Course Second Edition CHAPTER 28 Fatty Acid Synthesis 2013 W. H. Freeman and Company Chapter 28 Outline 1. The first stage of fatty acid synthesis is transfer
Role of the ventromedial hypothalamic Steroidogenic Factor 1/ Adrenal 4. glucose metabolism in mice.
 Role of the ventromedial hypothalamic Steroidogenic Factor 1/ Adrenal 4 Binding Protein neurons in the regulation of whole body energy and glucose metabolism in mice. Eulalia Coutinho Department of Physiological
For pair feeding, mice were fed 2.7g of HFD containing tofogliflozin
 Materials and Methods Pair Feeding Experiment For pair feeding, mice were fed 2.7g of HFD containing tofogliflozin (0.005%), which is average daily food intake of mice fed control HFD ad libitum at week
Supplementary Figure 1
 VO (ml kg - min - ) VCO (ml kg - min - ) Respiratory exchange ratio Energy expenditure (cal kg - min - ) Locomotor activity (x count) Body temperature ( C) Relative mrna expression TA Sol EDL PT Heart
Supplementary Figure S1
 Lipidomic-based investigation into the regulatory effect of Schisandrin B on palmitic acid level in non-alcoholic steatotic livers Hiu Yee Kwan 1,2, Xuyan Niu 3, Wenlin Dai 4, Tiejun Tong 4, Xiaojuan Chao
Hepatic insulin signaling regulates VLDL secretion and atherogenesis in mice
 Hepatic insulin signaling regulates VLDL secretion and atherogenesis in mice Seongah Han,, Domenico Accili, Alan R. Tall J Clin Invest. 2009;119(4):1029-1041. https://doi.org/10.1172/jci36523. Research
Central insulin action regulates peripheral glucose and fat metabolism in mice
 Research article Central insulin action regulates peripheral glucose and fat metabolism in mice Linda Koch, 1 F. Thomas Wunderlich, 1 Jost Seibler, 2 A. Christine Könner, 1 Brigitte Hampel, 1 Sigrid Irlenbusch,
Supplemental Information. Increased 4E-BP1 Expression Protects. against Diet-Induced Obesity and Insulin. Resistance in Male Mice
 Cell Reports, Volume 16 Supplemental Information Increased 4E-BP1 Expression Protects against Diet-Induced Obesity and Insulin Resistance in Male Mice Shih-Yin Tsai, Ariana A. Rodriguez, Somasish G. Dastidar,
Supplementary Table 2. Plasma lipid profiles in wild type and mutant female mice submitted to a HFD for 12 weeks wt ERα -/- AF-1 0 AF-2 0
 Supplementary Table 1. List of specific primers used for gene expression analysis. Genes Primer forward Primer reverse Hprt GCAGTACAGCCCCAAAATGG AACAAAGTCTGGCCTGTATCCA Srebp-1c GGAAGCTGTCGGGGTAGCGTC CATGTCTTCAAATGTGCAATCCAT
BIOL212 Biochemistry of Disease. Metabolic Disorders - Obesity
 BIOL212 Biochemistry of Disease Metabolic Disorders - Obesity Obesity Approx. 23% of adults are obese in the U.K. The number of obese children has tripled in 20 years. 10% of six year olds are obese, rising
2.5. AMPK activity
 Supplement Fig. A 3 B phos-ampk 2.5 * Control AICAR AMPK AMPK activity (Absorbance at 45 nm) 2.5.5 Control AICAR Supplement Fig. Effects of AICAR on AMPK activation in macrophages. J774. macrophages were
AN ABSTRACT OF THE DISSERTATION OF. Sasmita Tripathy for the Doctor of Philosophy in Nutrition presented on July 11, 2012.
 AN ABSTRACT OF THE DISSERTATION OF Sasmita Tripathy for the Doctor of Philosophy in Nutrition presented on July 11, 2012. Title: Polyunsaturated Fatty Acid Synthesis and Type 2 Diabetes Complications Abstract
Supplementary Materials for
 www.sciencesignaling.org/cgi/content/full/8/407/ra127/dc1 Supplementary Materials for Loss of FTO in adipose tissue decreases Angptl4 translation and alters triglyceride metabolism Chao-Yung Wang,* Shian-Sen
Dietary α-linolenic acid-rich flaxseed oil prevents against alcoholic hepatic steatosis
 Dietary α-linolenic acid-rich flaxseed oil prevents against alcoholic hepatic steatosis via ameliorating lipid homeostasis at adipose tissue-liver axis in mice Meng Wang a, Xiao-Jing Zhang a, Kun Feng
Supplemental Information Supplementary Table 1. Tph1+/+ Tph1 / Analyte Supplementary Table 2. Tissue Vehicle LP value
 Supplemental Information Supplementary Table. Urinary and adipose tissue catecholamines in Tph +/+ and Tph / mice fed a high fat diet for weeks. Tph +/+ Tph / Analyte ewat ibat ewat ibat Urine (ng/ml)
SUPPLEMENTARY DATA. Supplementary Table 1. Primer sequences for qrt-pcr
 Supplementary Table 1. Primer sequences for qrt-pcr Gene PRDM16 UCP1 PGC1α Dio2 Elovl3 Cidea Cox8b PPARγ AP2 mttfam CyCs Nampt NRF1 16s-rRNA Hexokinase 2, intron 9 β-actin Primer Sequences 5'-CCA CCA GCG
Glucose. Glucose. Insulin Action. Introduction to Hormonal Regulation of Fuel Metabolism
 Glucose Introduction to Hormonal Regulation of Fuel Metabolism Fasting level 3.5-5 mmol (1 mmol = 18 mg/dl) Postprandial 6-10 mmol Amount of glucose in circulation is dependent on: Absorption from the
SUPPLEMENTARY INFORMATION
 Supplementary Figures Supplementary Figure S1. Binding of full-length OGT and deletion mutants to PIP strips (Echelon Biosciences). Supplementary Figure S2. Binding of the OGT (919-1036) fragments with
number Done by Corrected by Doctor Nayef Karadsheh
 number 13 Done by Asma Karameh Corrected by Saad hayek Doctor Nayef Karadsheh Gluconeogenesis This lecture covers gluconeogenesis with aspects of: 1) Introduction to glucose distribution through tissues.
The antiparasitic drug ivermectin is a novel FXR ligand that regulates metabolism
 Supplementary Information The antiparasitic drug ivermectin is a novel FXR ligand that regulates metabolism Address correspondence to Yong Li (yongli@xmu.edu.cn, Tel: 86-592-218151) GW464 CDCA Supplementary
a b c Physical appearance of mice Lean mass Adipocyte size d e f
 LFD HFD LFD HFD Area under curve (GTT) HFD-VSL#3 LFD HFD Area under curve (ITT) HFD-VSL#3 Liver TG content (% l) HFD-VSL#3 LFD HFD HFD-VSL#3 LFD HFD HFD-VSL#3 LFD HFD HFD + VSL#3 Lean mass (gm) Mean adipocyte
Lecture 34. Carbohydrate Metabolism 2. Glycogen. Key Concepts. Biochemistry and regulation of glycogen degradation
 Lecture 34 Carbohydrate Metabolism 2 Glycogen Key Concepts Overview of Glycogen Metabolism Biochemistry and regulation of glycogen degradation Biochemistry and regulation of glycogen synthesis What mechanisms
Pathogenesis of Diabetes Mellitus
 Pathogenesis of Diabetes Mellitus Young-Bum Kim, Ph.D. Associate Professor of Medicine Harvard Medical School Definition of Diabetes Mellitus a group of metabolic diseases characterized by hyperglycemia
Supplementary Information. Glycogen shortage during fasting triggers liver-brain-adipose. neurocircuitry to facilitate fat utilization
 Supplementary Information Glycogen shortage during fasting triggers liver-brain-adipose neurocircuitry to facilitate fat utilization Supplementary Figure S1. Liver-Brain-Adipose neurocircuitry Starvation
SUPPLEMENTARY INFORMATION
 DOI: 10.1038/ncb3461 In the format provided by the authors and unedited. Supplementary Figure 1 (associated to Figure 1). Cpeb4 gene-targeted mice develop liver steatosis. a, Immunoblot displaying CPEB4
AMPK Phosphorylation Assay Kit
 AMPK Phosphorylation Assay Kit Catalog Number KA3789 100 assays Version: 02 Intended for research use only www.abnova.com Table of Contents Introduction... 3 Intended Use... 3 Background... 3 Principle
TIGAR's promiscuity Bolaños, Juan P.
 TIGAR's promiscuity Bolaños, Juan P. TIGAR [TP53 (tumour protein 53)-induced glycolysis and apoptosis regulator] is an important survival factor for cancer cells. The enzymatic activity supported by sequence
Lecture 36. Key Concepts. Overview of lipid metabolism. Reactions of fatty acid oxidation. Energy yield from fatty acid oxidation
 Lecture 36 Lipid Metabolism 1 Fatty Acid Oxidation Ketone Bodies Key Concepts Overview of lipid metabolism Reactions of fatty acid oxidation Energy yield from fatty acid oxidation Formation of ketone bodies
Fig. S1. REGN1500 reduces plasma levels of cholesterol, TG and NEFA in WT and Ldlr -/- mice. (A) WT
 WT") Figure Legends for Supplementary Figures. Fig. S1. REGN15 reduces plasma levels of cholesterol, TG and NEF in WT and Ldlr -/- mice. () WT and Ldlr -/- mice were injected with control IgG or REGN15 (1 mg/kg)
Figure Legends for Supplementary Figures. Fig. S1. REGN15 reduces plasma levels of cholesterol, TG and NEF in WT and Ldlr -/- mice. () WT and Ldlr -/- mice were injected with control IgG or REGN15 (1 mg/kg)
18s AAACGGCTACCACATCCAAG CCTCCAATGGATCCTCGTTA. 36b4 GTTCTTGCCCATCAGCACC AGATGCAGCAGATCCGCAT. Acc1 AGCAGATCCGCAGCTTG ACCTCTGCTCGCTGAGTGC
 Supplementary Table 1. Quantitative PCR primer sequences Gene symbol Sequences (5 to 3 ) Forward Reverse 18s AAACGGCTACCACATCCAAG CCTCCAATGGATCCTCGTTA 36b4 GTTCTTGCCCATCAGCACC AGATGCAGCAGATCCGCAT Acc1
ANSC/NUTR 618 LIPIDS & LIPID METABOLISM. Triacylglycerol and Fatty Acid Metabolism
 ANSC/NUTR 618 LIPIDS & LIPID METABOLISM II. Triacylglycerol synthesis A. Overall pathway Glycerol-3-phosphate + 3 Fatty acyl-coa à Triacylglycerol + 3 CoASH B. Enzymes 1. Acyl-CoA synthase 2. Glycerol-phosphate
Salt-inducible kinase 2 links transcriptional coactivator p300 phosphorylation to the prevention of ChREBP-dependent hepatic steatosis in mice
 Salt-inducible kinase 2 links transcriptional coactivator p300 phosphorylation to the prevention of ChREBP-dependent hepatic steatosis in mice Julien Bricambert,, Catherine Postic, Renaud Dentin J Clin
Lipid Metabolism. Remember fats?? Triacylglycerols - major form of energy storage in animals
 Remember fats?? Triacylglycerols - major form of energy storage in animals Your energy reserves: ~0.5% carbs (glycogen + glucose) ~15% protein (muscle, last resort) ~85% fat Why use fat for energy? 1 gram
Interplay between FGF21 and insulin action in the liver regulates metabolism
 Research article Interplay between FGF21 and insulin action in the liver regulates metabolism Brice Emanuelli, 1 Sara G. Vienberg, 1 Graham Smyth, 1 Christine Cheng, 2 Kristin I. Stanford, 1 Manimozhiyan
ENERGY FROM INGESTED NUTREINTS MAY BE USED IMMEDIATELY OR STORED
 QUIZ/TEST REVIEW NOTES SECTION 1 SHORT TERM METABOLISM [METABOLISM] Learning Objectives: Identify primary energy stores of the body Differentiate the metabolic processes of the fed and fasted states Explain
Moh Tarek. Razi Kittaneh. Jaqen H ghar
 14 Moh Tarek Razi Kittaneh Jaqen H ghar Naif Karadsheh Gluconeogenesis is making glucose from non-carbohydrates precursors. Although Gluconeogenesis looks like Glycolysis in many steps, it is not the simple
Implications of mitochondrial skeletal muscle metabolism on diabetes and obesity before and after weight loss
 GG2 Implications of mitochondrial skeletal muscle metabolism on diabetes and obesity before and after weight loss Dr Giacomo Gastaldi CHRU Montpellier Folie 1 GG2 19.10.2009 GG_PC; 12.10.2009 Plan Introduction