Supplementary Information
|
|
|
- Jeffrey Joseph
- 5 years ago
- Views:
Transcription
1 Supplementary Information Akt regulates hepatic metabolism by suppressing a Foxo1 dependent global inhibition of adaptation to nutrient intake Mingjian Lu 1, Min Wan 1, Karla F. Leavens 1, Qingwei Chu 1, Bobby R. Monks 1, Sully Fernandez 1, Rexford S. Ahima 1, Kohjiro Ueki 2, C. Ronald Kahn 3, and Morris J. Birnbaum 1, * 1 The Institute for Diabetes, Obesity, and Metabolism, Perelman School of Medicine, University of Pennsylvania, Philadelphia, PA 1914, USA 2 Department of Diabetes and Metabolic Diseases, Graduate School of Medicine, The University of Tokyo, Tokyo, Japan 3 Research Division, Joslin Diabetes Center, Harvard Medical School, Boston, MA 2215, USA * Address correspondence to: Morris J. Birnbaum, M.D. Ph.D. Room TRC 34 Civic Center Blvd., Bldng. 421 Philadelphia PA birnbaum@mail.med.upenn.edu
2 Supplementary Figure 1 a b 2LWT 2LKO 2LWT 2LKO 2LWT 2LKO p Akt S473 Akt2 Tubulin Fasted Refed Insulin Relative p Akt S473 Fasted 2LWT 2LKO Refed Insulin Supplementary Figure 1. Akt phosphorylation in the control and 2LKO livers four hours after feeding and 2 minutes after insulin injection. 2LWT or 2LKO mice were fasted overnight (fasted), followed by four hours feeding (refed) or injection with insulin at 2 mu g 1 (insulin). For insulin-injected mice, livers were harvested 2 minutes after injection. Liver lysates were subjected to Western blot with indicated antibodies (a). The p Akt S473 image intensity was quantitated with NIH Image J program, and shown in (b). Assuming that all Akt1 (16% of total Akt) was phosphorylated after insulin injection, we estimated that less than 4% of total Akt was phosphorylated 4 hours after feeding in the control livers.
3 Supplementary Figure 2 Glycogen (mg g 1 liver) LWT Fasted Refed 2LKO * DLWT DLKO *** Supplementary Figure 2. Defective postprandial glycogen storage in the DLKO livers. Mice were fasted overnight, or fasted overnight and refed for four hours. Glycogen content in the livers was measured. The glycogen in fed livers was slightly but significantly lower in the 2LKO livers than the 2LWT livers. (* P <.5, *** P <.1).
4 Supplementary Figure 3 Glucose uptake, muscle (nmol g 1 min 1 ) DLWT *** DLKO glucose uptake, WAT (nmol g 1 min 1 ) DLWT *** DLKO Supplementary Figure 3. Defective glucose uptake in skeletal muscle and adipose tissues of the DLKO mice. After the hyperinsulinemic euglycemic clamp, 2 deoxyglucose uptake in skeletal muscle and epididymal adipose tissues (WAT) were measured. (*** P <.1).
5 Supplementary Figure 4 a Relative expression Foxo1 b 2 1 Control Foxo1 / c Fasting blood glucose (mg dl 1 ) d Control *** Foxo1 / Control Foxo1 / Foxo1 Akt2 Feeding blood glucose (mg dl 1 ) Control Foxo1 / Supplementary Figure 4. Acute deletion of Foxo1 in mouse livers resulted in fasting hypoglycemia. Foxo1 loxp/loxp mice 1 were injected with AAV-Tbg-Cre (Foxo1 / ) or AAV-Tbg-GFP (control). (a) Two weeks after virus injection, mice were sacrificed, total RNA was isolated from whole livers and Foxo1 mrna was quantitated with real time PCR as described 2 (n = 8). In (b), protein extracts from hepatocytes isolated from the control mice and Foxo1 / mice were resolved in a SDS PAGE gel and probed for Foxo1 and Akt2. (c) Blood glucose level after overnight fasting (n = 16, 17, *** P <.1). (d) Blood glucose level after overnight fasting followed by four hours feeding (n = 7, 9).
6 Supplementary Figure 5 Glycogen (mg g 1 liver) *** 4 Fasted Refed 3 NS 2 1 LWT DLKO TLKO Supplementary Figure 5. Defective postprandial glycogen storage in the DLKO and the TLKO livers. Mice were fasted overnight, or fasted overnight and refed for four hours. Liver glycogen content was measured. The difference in glycogen content after feeding between the DLKO livers and the TLKO livers did not reach statistical significance (*** P <.1, NS: not significant, n = 7,8).
7 Supplementary Figure 6 G d 6,6 / G d LWT DLKO TLKO Time (min) Supplementary Figure 6. Defective glucose cycling in the DLKO livers but not in the TLKO livers. The glucose G 6 P cycling was measured as previously reported 3. Briefly, mice were fasted overnight, orally given a mixture of glucose either singlelabeled at 2 position or double-labeled at 6-position with deuterium. If glucose goes through the glucose à glucokinaseà G 6 P à G 6 phosphatase à glucose cycle, the label at 2 position is preferentially lost, increasing the ratio of d 6,6 double label glucose to the d 2 single-labeled glucose. In the experiment, serum was collected at 3, 6, and 12 minutes after glucose gavage. The enrichment of the d 6,6 double-label glucose and the d 2 single-labeled glucose was determined by Mass Spectrometry. As shown in the figure, the glucose G 6 P cycling was indistinguishable between the LWT livers and the TLKO livers and undetected in the DLKO mice.
8 Supplementary Figure 7 WT Akt3 / Brain lysate Chow LWT DLKO TLKO Liver lysate Akt3 Akt2 Foxo1 Tubulin Supplementary Figure 7. Akt3 was not increased in either the DLKO livers or the TLKO livers. Liver lysates from the control (LWT), DLKO, or the TLKO mice were subjected to SDS PAGE and Western blotting for Akt3, Akt2, Foxo1 and tubulin (as loading control). Brain lysates with the same amount of total protein from the wild type mice (WT) or Akt3 knockout mice (Akt3 / ) were used as positive control and negative control, respectively, for Akt3.
9 Supplementary Figure 8 Relative expression Sgk LWT DLKO TLKO Fasted Refed Supplementary Figure 8. Sgk1 expression increased in the DLKO but not the TLKO livers. Mice in each genotype were fasted overnight. For the refed groups, mice were fed for four hours after fasting. Relative expression of Sgk1 in livers was quantitated by real time PCR.
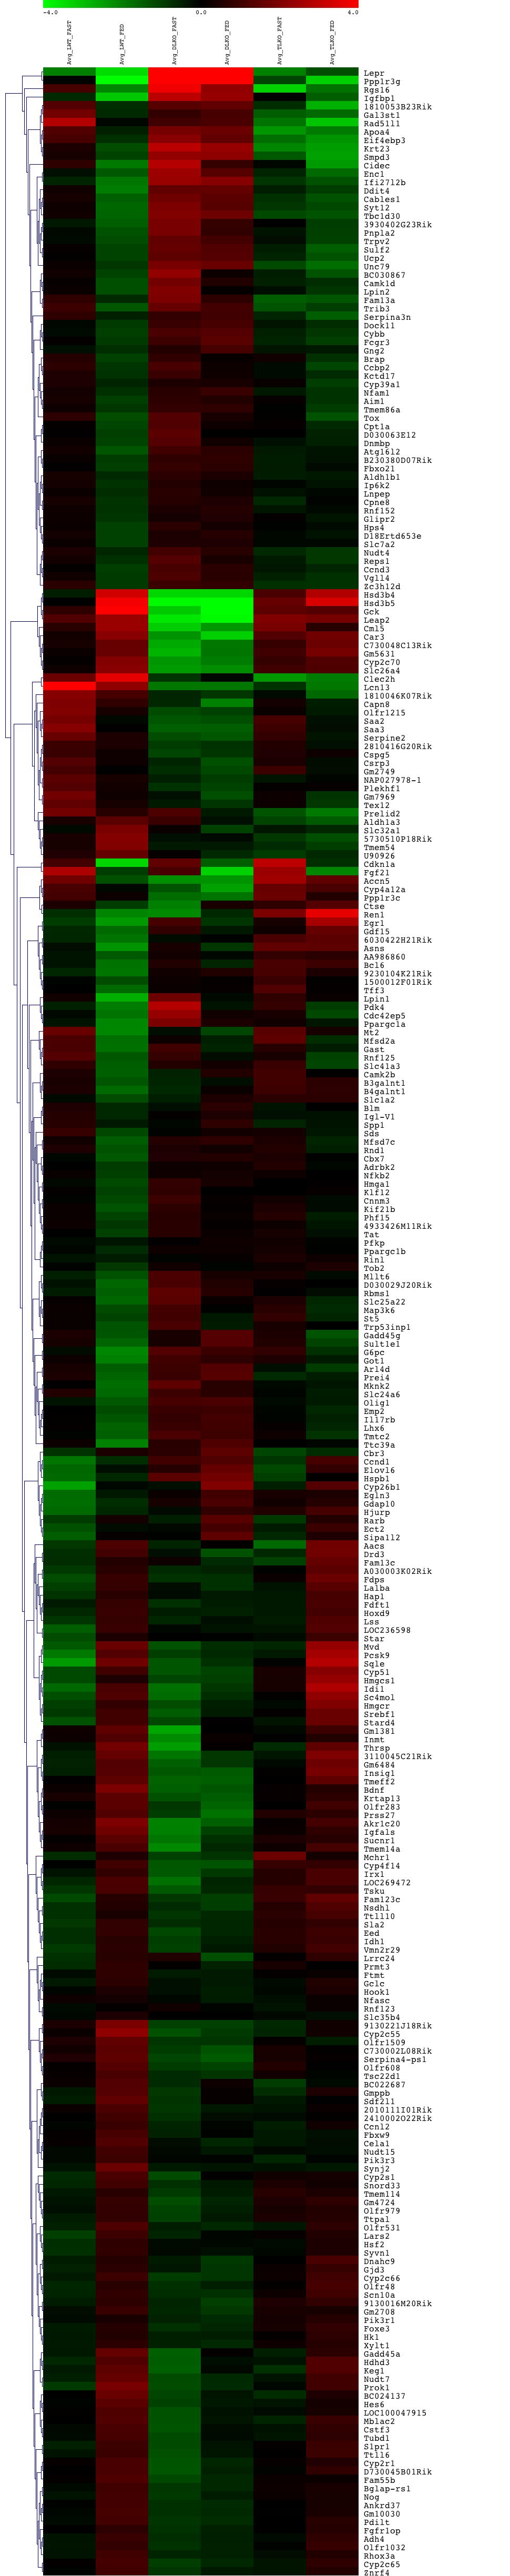
10 Supplementary Figure 9
11 Supplementary Figure 9. Unrestrained Foxo1 activity suppresses the metabolic transition from fasting to feeding. Heatmap of the expression of the 298 metabolically responsive genes in control, DLKO and TLKO livers in response to the fasting to feeding transition. Column 1: LWT, fasted. Column 2: LWT, fed. Column 3: DLKO, fasted. Column 4: DLKO, fasted. Column 5: TLKO, fasted. Column 6: TLKO, fed. Note that in the DLKO livers, the expression profile in both the fasted and fed states resembled that in the fasted state in the control livers, and the block of the transition from fasting to feeding is at least partially reversed in the TLKO livers. The metabolically responsive genes were defined as those with at least 2 fold change from fasting to feeding.

12 Supplementary Figure 1 Fasted Fed Irs1, Irs2 DKO, log 2 (DKO/WT) Akt1, Akt2 DLKO, log 2 (DLKO/LWT) Supplementary Figure 1. Correlation in gene expression between the Akt1/Akt2 DLKO livers and the Irs1/Irs2 DKO livers under fasting and fed conditions. The ratio of gene expression in the Akt1;Akt2 DLKO to control livers was compared the ratio of Irs1;Irs2 DKO to control livers under fasting and fasting/refed conditions (AffyexpressE- MEXP 1649). The X axis and the Y axis are the M values ( log 2 (test/control) ) from the arrays for Akt DLKO and Irs DKO, respectively. The graph is a density plot which shows the density of points when they are close together, the dark dots indicate that these is only one single point in a density drop and were used to highlight individual points when they are farther apart. The R values in the graph are the Pearson's correlation value. The large number of genes in the upper right and lower left quadrants indicates that the deletion of Akt and Irs in liver altered expression of the same genes and the proximity to the diagonal shows that the magnitudes of the changes were similar. The correlation is statistically significant (P < 2e 16).

13 Supplementary Figure 11 Supplementary Figure 11. Schematic illustration of regulation of liver glucose metabolism by Akt and Foxo1. In the canonical model, Akt activation-dependent Foxo1 suppression is responsible for the decreased expression of Pck1 and G6pc and liver glucose output. In the proposed new model, in addition to the Aktà Foxo1 axis, there is another Akt and Foxo1 independent pathway that regulates liver glucose output and the expression of G6pc and Pck1 in response to insulin and nutrients, and this pathway is repressed by unrestrained Foxo1 activation. In the absence of Akt, Foxo1 increases liver glucose output by directly inducing G6pc and Pck1 expression and by repressing the parallel pathway. In livers lacking both Akt and Foxo1, the parallel pathway is fully functional and sufficient to signal the response to feeding, both in terms of the expression of G6pc and Pck1 and glucose output. Ex vivo, primary hepatocytes behave as would be predicted if only the canonical pathway exists.
14 Supplementary reference 1. Matsumoto, M., Pocai, A., Rossetti, L., Depinho, R.A. & Accili, D. Impaired regulation of hepatic glucose production in mice lacking the forkhead transcription factor Foxo1 in liver. Cell Metab 6, (27). 2. Haeusler, R.A., Kaestner, K.H. & Accili, D. FoxOs function synergistically to promote glucose production. The Journal of biological chemistry 285, (21). 3. Xu, J., et al. Decreased hepatic futile cycling compensates for increased glucose disposal in the Pten heterodeficient mouse. Diabetes 55, (26).
Requires Signaling though Akt2 Independent of the. Transcription Factors FoxA2, FoxO1, and SREBP1c
 Cell Metabolism, Volume 14 Supplemental Information Postprandial Hepatic Lipid Metabolism Requires Signaling though Akt2 Independent of the Transcription Factors FoxA2, FoxO1, and SREBP1c Min Wan, Karla
18s AAACGGCTACCACATCCAAG CCTCCAATGGATCCTCGTTA. 36b4 GTTCTTGCCCATCAGCACC AGATGCAGCAGATCCGCAT. Acc1 AGCAGATCCGCAGCTTG ACCTCTGCTCGCTGAGTGC
 Supplementary Table 1. Quantitative PCR primer sequences Gene symbol Sequences (5 to 3 ) Forward Reverse 18s AAACGGCTACCACATCCAAG CCTCCAATGGATCCTCGTTA 36b4 GTTCTTGCCCATCAGCACC AGATGCAGCAGATCCGCAT Acc1
AAV-TBGp-Cre treatment resulted in hepatocyte-specific GH receptor gene recombination
 AAV-TBGp-Cre treatment resulted in hepatocyte-specific GH receptor gene recombination Supplementary Figure 1. Generation of the adult-onset, liver-specific GH receptor knock-down (alivghrkd, Kd) mouse
Supplementary Figure 1
 Supplementary Figure 1 how HFD how HFD Epi WT p p Hypothalamus p p Inguinal WT T Liver Lean mouse adipocytes p p p p p p Obese mouse adipocytes Kidney Muscle Spleen Heart p p p p p p p p Extracellular
Supplementary Figure 1
 Supplementary Figure 1 Supplementary Figure 1 Schematic depiction of the tandem Fc GDF15. Supplementary Figure 2 Supplementary Figure 2 Gfral mrna levels in the brains of both wild-type and knockout Gfral
SUPPLEMENTARY INFORMATION
 doi:10.1038/nature12652 Supplementary Figure 1. PRDM16 interacts with endogenous EHMT1 in brown adipocytes. Immunoprecipitation of PRDM16 complex by flag antibody (M2) followed by Western blot analysis
Supplementary Materials for
 www.sciencesignaling.org/cgi/content/full/8/407/ra127/dc1 Supplementary Materials for Loss of FTO in adipose tissue decreases Angptl4 translation and alters triglyceride metabolism Chao-Yung Wang,* Shian-Sen
Supplementary Figure 1. DNA methylation of the adiponectin promoter R1, Pparg2, and Tnfa promoter in adipocytes is not affected by obesity.
 Supplementary Figure 1. DNA methylation of the adiponectin promoter R1, Pparg2, and Tnfa promoter in adipocytes is not affected by obesity. (a) Relative amounts of adiponectin, Ppar 2, C/ebp, and Tnf mrna
General Laboratory methods Plasma analysis: Gene Expression Analysis: Immunoblot analysis: Immunohistochemistry:
 General Laboratory methods Plasma analysis: Plasma insulin (Mercodia, Sweden), leptin (duoset, R&D Systems Europe, Abingdon, United Kingdom), IL-6, TNFα and adiponectin levels (Quantikine kits, R&D Systems
Expanded View Figures
 Expanded View Figures A B C D E F G H I J K L Figure EV1. The dysregulated lipid metabolic phenotype of mouse models of metabolic dysfunction is most pronounced in the fasted state. A L Male 12-weeks-old
Adiponectin suppresses gluconeogenic gene expression in mouse hepatocytes independent of LKB1-AMPK signaling
 Adiponectin suppresses gluconeogenic gene expression in mouse hepatocytes independent of LKB1-AMPK signaling Russell A. Miller,, Benoit Viollet, Morris J. Birnbaum J Clin Invest. 2011;121(6):2518-2528.
Supplemental Table 1. Plasma NEFA and liver triglyceride levels in ap2-hif1ako and ap2-hif2ako mice under control and high fat diets.
 Supplemental Table 1. Plasma NEFA and liver triglyceride levels in Hif1aKO and Hif2aKO mice under control and high fat diets. Hif1a (n=6) Hif1aK O (n=6) Hif2a Hif2aK O Hif1a (n=5) Hif1aKO (n=5) Hif2a Hif2aK
Supplemental Information. Increased 4E-BP1 Expression Protects. against Diet-Induced Obesity and Insulin. Resistance in Male Mice
 Cell Reports, Volume 16 Supplemental Information Increased 4E-BP1 Expression Protects against Diet-Induced Obesity and Insulin Resistance in Male Mice Shih-Yin Tsai, Ariana A. Rodriguez, Somasish G. Dastidar,
Supplementary Table 1. Metabolic parameters in GFP and OGT-treated mice
 Supplementary Table 1. Metabolic parameters in GFP and OGT-treated mice Fasted Refed GFP OGT GFP OGT Liver G6P (mmol/g) 0.03±0.01 0.04±0.02 0.60±0.04 0.42±0.10 A TGs (mg/g of liver) 20.08±5.17 16.29±0.8
Supplementary Information. Glycogen shortage during fasting triggers liver-brain-adipose. neurocircuitry to facilitate fat utilization
 Supplementary Information Glycogen shortage during fasting triggers liver-brain-adipose neurocircuitry to facilitate fat utilization Supplementary Figure S1. Liver-Brain-Adipose neurocircuitry Starvation
Supplementary Information. Protectin DX alleviates insulin resistance by activating a myokine-liver glucoregulatory axis.
 Supplementary Information Protectin DX alleviates insulin resistance by activating a myokine-liver glucoregulatory axis. Phillip J. White, Philippe St-Pierre, Alexandre Charbonneau, Patricia Mitchell,
Supplementary Information
 Supplementary Information GADD34-deficient mice develop obesity, nonalcoholic fatty liver disease, hepatic carcinoma and insulin resistance Naomi Nishio and Ken-ichi Isobe Department of Immunology, Nagoya
Defective Hepatic Autophagy in Obesity Promotes ER Stress and Causes Insulin Resistance
 Cell Metabolism, Volume 11 Supplemental Information Defective Hepatic Autophagy in Obesity Promotes ER Stress and Causes Insulin Resistance Ling Yang, Ping Li, Suneng Fu, Ediz S. Calay, and Gökhan S. Hotamisligil
Over-expression of MKP-3 and knockdown of MKP-3 and FOXO1 in primary rat. day, cells were transduced with adenoviruses expressing GFP, MKP-3 or shgfp,
 SUPPLEMENTAL METHODS Over-expression of MKP-3 and knockdown of MKP-3 and FOXO1 in primary rat hepatocytes Primary rat hepatocytes were seeded as described in experimental procedures. The next day, cells
Supplementary Fig. 1 eif6 +/- mice show a reduction in white adipose tissue, blood lipids and normal glycogen synthesis. The cohort of the original
 Supplementary Fig. 1 eif6 +/- mice show a reduction in white adipose tissue, blood lipids and normal glycogen synthesis. The cohort of the original phenotypic screening was n=40. For specific tests, the
GPR120 *** * * Liver BAT iwat ewat mwat Ileum Colon. UCP1 mrna ***
 a GPR120 GPR120 mrna/ppia mrna Arbitrary Units 150 100 50 Liver BAT iwat ewat mwat Ileum Colon b UCP1 mrna Fold induction 20 15 10 5 - camp camp SB202190 - - - H89 - - - - - GW7647 Supplementary Figure
FH- FH+ DM. 52 Volunteers. Oral & IV Glucose Tolerance Test Hyperinsulinemic Euglycemic Clamp in Non-DM Subjects ACADSB MYSM1. Mouse Skeletal Muscle
 A 52 Volunteers B 6 5 4 3 2 FH- FH+ DM 1 Oral & IV Glucose Tolerance Test Hyperinsulinemic Euglycemic Clamp in Non-DM Subjects ZYX EGR2 NR4A1 SRF target TPM1 ACADSB MYSM1 Non SRF target FH- FH+ DM2 C SRF
Role of the ventromedial hypothalamic Steroidogenic Factor 1/ Adrenal 4. glucose metabolism in mice.
 Role of the ventromedial hypothalamic Steroidogenic Factor 1/ Adrenal 4 Binding Protein neurons in the regulation of whole body energy and glucose metabolism in mice. Eulalia Coutinho Department of Physiological
SUPPLEMENTARY INFORMATION
 SUPPLEMENTARY INFORMATION doi:10.1038/nature11464 Supplemental Figure S1. The expression of Vegfb is increased in obese and diabetic mice as compared to lean mice. a-b, Body weight and postprandial blood
Males- Western Diet WT KO Age (wks) Females- Western Diet WT KO Age (wks)
 Females- Western Diet WT KO Age (wks)") Relative Arv1 mrna Adrenal 33.48 +/- 6.2 Skeletal Muscle 22.4 +/- 4.93 Liver 6.41 +/- 1.48 Heart 5.1 +/- 2.3 Brain 4.98 +/- 2.11 Ovary 4.68 +/- 2.21 Kidney 3.98 +/-.39 Lung 2.15 +/-.6 Inguinal Subcutaneous
Relative Arv1 mrna Adrenal 33.48 +/- 6.2 Skeletal Muscle 22.4 +/- 4.93 Liver 6.41 +/- 1.48 Heart 5.1 +/- 2.3 Brain 4.98 +/- 2.11 Ovary 4.68 +/- 2.21 Kidney 3.98 +/-.39 Lung 2.15 +/-.6 Inguinal Subcutaneous
ACC ELOVL MCAD. CPT1α 1.5 *** 0.5. Reverbα *** *** 0.5. Fasted. Refed
 Supplementary Figure A 8 SREBPc 6 5 FASN ELOVL6.5.5.5 ACC.5.5 CLOCK.5.5 CRY.5.5 PPARα.5.5 ACSL CPTα.5.5.5.5 MCAD.5.5 PEPCK.5.5 G6Pase 5.5.5.5 BMAL.5.5 Reverbα.5.5 Reverbβ.5.5 PER.5.5 PER B Fasted Refed
SUPPLEMENTARY INFORMATION
 DOI: 10.1038/ncb3461 In the format provided by the authors and unedited. Supplementary Figure 1 (associated to Figure 1). Cpeb4 gene-targeted mice develop liver steatosis. a, Immunoblot displaying CPEB4
Supplementary Information
 Supplementary Information mediates STAT3 activation at retromer-positive structures to promote colitis and colitis-associated carcinogenesis Zhang et al. a b d e g h Rel. Luc. Act. Rel. mrna Rel. mrna
Explain how the normal mice prevented their blood glucose concentration falling when they had not eaten for 48 hours
 Q1.Scientists investigated the control of blood glucose concentration in mice. They kept a group of normal mice without food for 48 hours. After 48 hours, the blood glucose concentrations of the mice were
Role of fatty acids in the development of insulin resistance and type 2 diabetes mellitus
 Emerging Science Role of fatty acids in the development of insulin resistance and type 2 diabetes mellitus George Wolf Insulin resistance is defined as the reduced responsiveness to normal circulating
Resveratrol activates duodenal Sirt1 to reverse insulin resistance in rats through a neuronal network
 Resveratrol activates duodenal Sirt1 to reverse insulin resistance in rats through a neuronal network Clémence D. Côté, Brittany A. Rasmussen, Frank A. Duca, Melika Zadeh-Tahmasebi, Joseph A. Baur, Mira
IL METABOLISMO EPATICO DEI CARBOIDRATI IN FISIOLOGIA E PATOLOGIA
 UNIGASTRO Il fegato come centrale metabolica e i fattori di danno oltre ai virus epatitici IL METABOLISMO EPATICO DEI CARBOIDRATI IN FISIOLOGIA E PATOLOGIA Dr Elisabetta Bugianesi Divisione di Gastro-Epatologia
SUPPLEMENTARY INFORMATION
 DOI: 10.1038/ncb2211 a! mir-143! b! mir-103/107! let-7a! mir-144! mir-122a! mir-126-3p! mir-194! mir-27a! mir-30c! Figure S1 Northern blot analysis of mir-143 expression dependent on feeding conditions.
Metabolic ER stress and inflammation in white adipose tissue (WAT) of mice with dietary obesity.
 of mice with dietary obesity.") Supplementary Figure 1 Metabolic ER stress and inflammation in white adipose tissue (WAT) of mice with dietary obesity. Male C57BL/6J mice were fed a normal chow (NC, 10% fat) or a high-fat diet (HFD,
Supplementary Figure 1 Metabolic ER stress and inflammation in white adipose tissue (WAT) of mice with dietary obesity. Male C57BL/6J mice were fed a normal chow (NC, 10% fat) or a high-fat diet (HFD,
Supplementary Figure 1
 Combination index (CI) Supplementary Figure 1 2. 1.5 1. Ishikawa AN3CA Nou-1 Hec-18.5...2.4.6.8 1. Fraction affected (Fa) Supplementary Figure 1. The synergistic effect of PARP inhibitor and PI3K inhibitor
Akt and mtor pathways differentially regulate the development of natural and inducible. T H 17 cells
 Akt and mtor pathways differentially regulate the development of natural and inducible T H 17 cells Jiyeon S Kim, Tammarah Sklarz, Lauren Banks, Mercy Gohil, Adam T Waickman, Nicolas Skuli, Bryan L Krock,
SUPPLEMENTARY INFORMATION
 doi:10.1038/nature12215 Supplementary Figure 1. The effects of full and dissociated GR agonists in supporting BFU-E self-renewal divisions. BFU-Es were cultured in self-renewal medium with indicated GR
Supplemental Table 1: Demographics and characteristics of study participants. Male, n (%) 3 (20%) 6 (50%) Age, years [mean ± SD] 33.3 ± ± 9.
![Supplemental Table 1: Demographics and characteristics of study participants. Male, n (%) 3 (20%) 6 (50%) Age, years [mean ± SD] 33.3 ± ± 9.](/thumbs/90/103696086.jpg "Supplemental Table 1: Demographics and characteristics of study participants. Male, n (%) 3 (20%) 6 (50%) Age, years [mean ± SD] 33.3 ± ± 9.") SUPPLEMENTAL DATA Supplemental Table 1: Demographics and characteristics of study participants Lean (n=15) Obese (n=12) Male, n (%) 3 (20%) 6 (50%) Age, years [mean ± SD] 33.3 ± 9.5 44.8 ± 9.1 White, n
SUPPLEMENTAL DATA Supplemental Table 1: Demographics and characteristics of study participants Lean (n=15) Obese (n=12) Male, n (%) 3 (20%) 6 (50%) Age, years [mean ± SD] 33.3 ± 9.5 44.8 ± 9.1 White, n
Supplementary Materials
 Supplementary Materials 1 Supplementary Table 1. List of primers used for quantitative PCR analysis. Gene name Gene symbol Accession IDs Sequence range Product Primer sequences size (bp) β-actin Actb gi
Loss of Pdk1-Foxo1 Signaling in Myeloid Cells Predisposes to Adipose Tissue Inflammation and Insulin Resistance
 ORIGINAL ARTICLE Loss of Pdk1-Foxo1 Signaling in Myeloid Cells Predisposes to Adipose Tissue Inflammation and Insulin Resistance Yoshinaga Kawano, 1 Jun Nakae, 1 Nobuyuki Watanabe, 2 Shiho Fujisaka, 3
BMP6 treatment compensates for the molecular defect and ameliorates hemochromatosis in Hfe knockout mice
 SUPPLEMENTARY MATERIALS BMP6 treatment compensates for the molecular defect and ameliorates hemochromatosis in Hfe knockout mice Elena Corradini, Paul J. Schmidt, Delphine Meynard, Cinzia Garuti, Giuliana
Ct=28.4 WAT 92.6% Hepatic CE (mg/g) P=3.6x10-08 Plasma Cholesterol (mg/dl)
 P=3.6x10-08 Plasma Cholesterol (mg/dl)") a Control AAV mtm6sf-shrna8 Ct=4.3 Ct=8.4 Ct=8.8 Ct=8.9 Ct=.8 Ct=.5 Relative TM6SF mrna Level P=.5 X -5 b.5 Liver WAT Small intestine Relative TM6SF mrna Level..5 9.6% Control AAV mtm6sf-shrna mtm6sf-shrna6
a Control AAV mtm6sf-shrna8 Ct=4.3 Ct=8.4 Ct=8.8 Ct=8.9 Ct=.8 Ct=.5 Relative TM6SF mrna Level P=.5 X -5 b.5 Liver WAT Small intestine Relative TM6SF mrna Level..5 9.6% Control AAV mtm6sf-shrna mtm6sf-shrna6
FOR REVIEW. BMB Reports - Manuscript Submission. Manuscript Draft. Manuscript Number: BMB
 BMB Reports - Manuscript Submission Manuscript Draft Manuscript Number: BMB-18-095 Title: Insulin Receptor Substrate 2:A Bridge between Hippo and AKT Pathways Article Type: Perspective (Invited Only) Keywords:
SUPPLEMENTARY INFORMATION
 doi: 1.138/nature7221 Brown fat selective genes 12 1 Control Q-RT-PCR (% of Control) 8 6 4 2 Ntrk3 Cox7a1 Cox8b Cox5b ATPase b2 ATPase f1a1 Sirt3 ERRα Elovl3/Cig3 PPARα Zic1 Supplementary Figure S1. stimulates
Supplementary Fig. 1. Delivery of mirnas via Red Fluorescent Protein.
 prfp-vector RFP Exon1 Intron RFP Exon2 prfp-mir-124 mir-93/124 RFP Exon1 Intron RFP Exon2 Untransfected prfp-vector prfp-mir-93 prfp-mir-124 Supplementary Fig. 1. Delivery of mirnas via Red Fluorescent
a b c d e C 3 ]Aspartate [ 20 minutes C 3 ]Hexose-P * * *
![a b c d e C 3 ]Aspartate [ 20 minutes C 3 ]Hexose-P * * *](/thumbs/92/110334219.jpg "a b c d e C 3 ]Aspartate [ 20 minutes C 3 ]Hexose-P * * *") Supplemental Figure 1 Metabolic flux with [U- C]Lactate - [ 12 C]Glutamine in primary hepatocytes a b c d e [ C 3 ]Pyruvate [ C 3 ]Malate [ C 3 ]Aspartate [ C 3 ]Citrate [ C 2 ] -Ketoglutarate f g h [
Supplemental Figure 1 Metabolic flux with [U- C]Lactate - [ 12 C]Glutamine in primary hepatocytes a b c d e [ C 3 ]Pyruvate [ C 3 ]Malate [ C 3 ]Aspartate [ C 3 ]Citrate [ C 2 ] -Ketoglutarate f g h [
BMI risk SNPs associate with increased CADM1 and CADM2 expression in the cerebellum of human subjects.
 Supplementary Figure 1 BMI risk SNPs associate with increased CADM1 and CADM2 expression in the cerebellum of human subjects. Boxplots show the 25% and 75% quantiles of normalized mrna expression levels
ChREBP regulates fructose-induced glucose production independently of insulin signaling
 ChREBP regulates fructose-induced glucose production independently of insulin signaling Mi-Sung Kim, 1 Sarah A. Krawczyk, 1 Ludivine Doridot, 1 Alan J. Fowler, 1 Jennifer X. Wang, 2 Sunia A. Trauger, 2
BRaf V600E cooperates with Pten silencing to elicit metastatic melanoma (Nature Genetics Supplementary Information)
") BRaf V600E cooperates with Pten silencing to elicit metastatic melanoma (Nature Genetics Supplementary Information) David Dankort, David P. Curley, Robert A. Cartlidge, Betsy Nelson, Anthony N. Karnezis,
BRaf V600E cooperates with Pten silencing to elicit metastatic melanoma (Nature Genetics Supplementary Information) David Dankort, David P. Curley, Robert A. Cartlidge, Betsy Nelson, Anthony N. Karnezis,
Analysis of AVP functions via V1a and V1b receptors with knockout mice. Akito Tanoue
 Analysis of AVP functions via V1a and V1b receptors with knockout mice Akito Tanoue Department of Pharmacology, National Research Institute for Child Health and Development Arginine-Vasopressin (AVP) is
A Central Role of MG53 in Metabolic Syndrome. and Type-2 Diabetes
 A Central Role of MG53 in Metabolic Syndrome and Type-2 Diabetes Yan Zhang, Chunmei Cao, Rui-Ping Xiao Institute of Molecular Medicine (IMM) Peking University, Beijing, China Accelerated Aging in China
Interplay between FGF21 and insulin action in the liver regulates metabolism
 Research article Interplay between FGF21 and insulin action in the liver regulates metabolism Brice Emanuelli, 1 Sara G. Vienberg, 1 Graham Smyth, 1 Christine Cheng, 2 Kristin I. Stanford, 1 Manimozhiyan
Supplementary Figure 1: Additional metabolic parameters of obesity mouse models and controls. (a) Body weight, (b) blood glucose and (c) insulin
 Body weight, (b) blood glucose and (c) insulin") Supplementary Figure 1: Additional metabolic parameters of obesity mouse models and controls. (a) Body weight, (b) blood glucose and (c) insulin resistance index of homeostatic model assessment (HOMA IR)
Supplementary Figure 1: Additional metabolic parameters of obesity mouse models and controls. (a) Body weight, (b) blood glucose and (c) insulin resistance index of homeostatic model assessment (HOMA IR)
Regulation of Systemic Energy Balance and Glucose Homeostasis by Protein-Tyrosine Phosphatase 1B
 Regulation of Systemic Energy Balance and Glucose Homeostasis by Protein-Tyrosine Phosphatase 1B Fawaz G. Haj Associate Professor Diagnosed Obesity and Diabetes for Adults aged 20 years in United States
SUPPLEMENTARY MATERIAL
 SUPPLEMENTARY MATERIAL IL-1 signaling modulates activation of STAT transcription factors to antagonize retinoic acid signaling and control the T H 17 cell it reg cell balance Rajatava Basu 1,5, Sarah K.
Increased hepatic glucose production in diabetes has
 ORIGINAL ARTICLE Endoplasmic Reticulum Stress Inhibits STAT3-Dependent Suppression of Hepatic Gluconeogenesis via Dephosphorylation and Deacetylation Kumi Kimura, 1 Tomoko Yamada, 1,2 Michihiro Matsumoto,
Supplementary Figure 1
 Supplementary Figure 1 A B mir-141, human cell lines mir-2c, human cell lines mir-141, hepatocytes mir-2c, hepatocytes Relative RNA.1.8.6.4.2 Relative RNA.3.2.1 Relative RNA 1.5 1..5 Relative RNA 2. 1.5
1,8 1,6 1,4 1,2 1. EE/g lean mass 0,8 0,6 0,4 0,2. Ambulatory locomotor activity. (beam brakes/48h) V MCH MCHpf 0,86 0,85 0,84 0,83 0,82 0,81 0,8
 V MCH MCHpf 0,86 0,85 0,84 0,83 0,82 0,81 0,8") Supplementary figure 1 vehicle A -pf Energy expenditure (kcal/kg/48h) 25 2 15 1 5 V pf EE/g lean mass 1,8 1,6 1,4 1,2 1,8,6,4,2 Total locomotor activity (beam brakes/48h) C D E 7 6 5 4 3 2 1 V pf Ambulatory
Supplementary figure 1 vehicle A -pf Energy expenditure (kcal/kg/48h) 25 2 15 1 5 V pf EE/g lean mass 1,8 1,6 1,4 1,2 1,8,6,4,2 Total locomotor activity (beam brakes/48h) C D E 7 6 5 4 3 2 1 V pf Ambulatory
Supplemental Figure 1
 Supplemental Figure 1 1a 1c PD-1 MFI fold change 6 5 4 3 2 1 IL-1α IL-2 IL-4 IL-6 IL-1 IL-12 IL-13 IL-15 IL-17 IL-18 IL-21 IL-23 IFN-α Mut Human PD-1 promoter SBE-D 5 -GTCTG- -1.2kb SBE-P -CAGAC- -1.kb
Inactivation of Hepatic Foxo1 by Insulin Signaling Is Required for Adaptive Nutrient Homeostasis and Endocrine Growth Regulation
 Article Inactivation of Hepatic Foxo1 by Insulin Signaling Is Required for Adaptive Nutrient Homeostasis and Endocrine Growth Regulation Xiaocheng C. Dong, 1 Kyle D. Copps, 1 Shaodong Guo, 1 Yedan Li,
SUPPLEMENTARY INFORMATION
 Supplementary Figures Supplementary Figure S1. Binding of full-length OGT and deletion mutants to PIP strips (Echelon Biosciences). Supplementary Figure S2. Binding of the OGT (919-1036) fragments with
Supplementary Table 2. Plasma lipid profiles in wild type and mutant female mice submitted to a HFD for 12 weeks wt ERα -/- AF-1 0 AF-2 0
 Supplementary Table 1. List of specific primers used for gene expression analysis. Genes Primer forward Primer reverse Hprt GCAGTACAGCCCCAAAATGG AACAAAGTCTGGCCTGTATCCA Srebp-1c GGAAGCTGTCGGGGTAGCGTC CATGTCTTCAAATGTGCAATCCAT
PKCδ regulates hepatic insulin sensitivity and hepatosteatosis in mice and humans
 Research article PKCδ regulates hepatic insulin sensitivity and hepatosteatosis in mice and humans Olivier Bezy, 1 Thien T. Tran, 1 Jussi Pihlajamäki, 2 Ryo Suzuki, 1 Brice Emanuelli, 1 Jonathan Winnay,
Metformin activates a duodenal Ampk-dependent pathway to lower hepatic glucose production
 activates a duodenal Ampk-dependent pathway to lower hepatic glucose Frank A. Duca, Clémence D. Côté, Brittany A. Rasmussen, Melika Zadeh-Tahmasebi, Guy A. Rutter, Beatrice M. Filippi & Tony K.T. Lam Supplementary
supplementary information
 DOI: 1.138/ncb1 Control Atg7 / NAC 1 1 1 1 (mm) Control Atg7 / NAC 1 1 1 1 (mm) Lamin B Gstm1 Figure S1 Neither the translocation of into the nucleus nor the induction of antioxidant proteins in autophagydeficient
SUPPLEMENTARY DATA. Supplementary Table 1. Primers used in qpcr
 Supplementary Table 1. Primers used in qpcr Gene forward primer (5'-3') reverse primer (5'-3') β-actin AGAGGGAAATCGTGCGTGAC CAATAGTGATGACCTGGCCGT Hif-p4h-2 CTGGGCAACTACAGGATAAAC GCGTCCCAGTCTTTATTTAGATA
Control. csarnt -/- Cre, f/f
 ody weight (g) A re,f/f re x f/f f/+ re, f/+ re,f/+ f/f x f/f f/+ cs -/- re, f/f re f/f re, f/f Normal chow Tamoxifen Tamoxifen Tamoxifen W 4W re f/f re, re/ff f/f re f/f re, re/ff f/f Normal chow Tamoxifen
Supplemental Information Supplementary Table 1. Tph1+/+ Tph1 / Analyte Supplementary Table 2. Tissue Vehicle LP value
 Supplemental Information Supplementary Table. Urinary and adipose tissue catecholamines in Tph +/+ and Tph / mice fed a high fat diet for weeks. Tph +/+ Tph / Analyte ewat ibat ewat ibat Urine (ng/ml)
Nature Immunology: doi: /ni Supplementary Figure 1. Characteristics of SEs in T reg and T conv cells.
 Supplementary Figure 1 Characteristics of SEs in T reg and T conv cells. (a) Patterns of indicated transcription factor-binding at SEs and surrounding regions in T reg and T conv cells. Average normalized
Title: Obesity in mice with adipocyte-specific deletion of clock component Bmal1
 Title: Obesity in mice with adipocyte-specific deletion of clock component Bmal1 Authors: Georgios K. Paschos, Salam Ibrahim, Wen-Liang Song, Takeshige Kunieda, Gregory Grant, Teresa M. Reyes, Christopher
Adiponectin suppresses gluconeogenic gene expression in mouse hepatocytes independent of LKB1-AMPK signaling
 Research article Adiponectin suppresses gluconeogenic gene expression in mouse hepatocytes independent of LKB1-AMPK signaling Russell A. Miller, 1 Qingwei Chu, 1 John Le Lay, 1 Philipp E. Scherer, 2 Rexford
Supplementary Figure 1.TRIM33 binds β-catenin in the nucleus. a & b, Co-IP of endogenous TRIM33 with β-catenin in HT-29 cells (a) and HEK 293T cells
 and HEK 293T cells") Supplementary Figure 1.TRIM33 binds β-catenin in the nucleus. a & b, Co-IP of endogenous TRIM33 with β-catenin in HT-29 cells (a) and HEK 293T cells (b). TRIM33 was immunoprecipitated, and the amount of
Supplementary Figure 1.TRIM33 binds β-catenin in the nucleus. a & b, Co-IP of endogenous TRIM33 with β-catenin in HT-29 cells (a) and HEK 293T cells (b). TRIM33 was immunoprecipitated, and the amount of
1.5 ASK1KO fed. fasted 16 hrs w/o water. Fed. 4th. 4th WT ASK1KO N=29, 11(WT), ,5(ASK1KO) ASK1KO ASK1KO **** Time [h]
![1.5 ASK1KO fed. fasted 16 hrs w/o water. Fed. 4th. 4th WT ASK1KO N=29, 11(WT), ,5(ASK1KO) ASK1KO ASK1KO **** Time [h]](/thumbs/87/97258189.jpg "1.5 ASK1KO fed. fasted 16 hrs w/o water. Fed. 4th. 4th WT ASK1KO N=29, 11(WT), ,5(ASK1KO) ASK1KO ASK1KO **** Time [h]") 7: 13: 19: 1: 7: 151117 a 151117 4th 4th b c RQ.95 KO.9.85.8.75.7 light dark light dark.65 7: 19: 7: 19: 7: Means ± SEM, N=6 RQ 1..9.8.7.6.6 KO CL (-) CL (+) ibat weight ratio (/body weight) [%].5.4.3.2.1
7: 13: 19: 1: 7: 151117 a 151117 4th 4th b c RQ.95 KO.9.85.8.75.7 light dark light dark.65 7: 19: 7: 19: 7: Means ± SEM, N=6 RQ 1..9.8.7.6.6 KO CL (-) CL (+) ibat weight ratio (/body weight) [%].5.4.3.2.1
Supplementary Figure 1. Blood glucose and insulin levels in mice during 4-day infusion.
 Supplementary Figure 1. Blood glucose and insulin levels in mice during 4-day infusion. (A-B) WT and HT mice infused with saline or glucose had overlapping achieved blood glucose and insulin levels, necessitating
Neurotrophic factor GDNF and camp suppress glucocorticoid-inducible PNMT expression in a mouse pheochromocytoma model.
 161 Neurotrophic factor GDNF and camp suppress glucocorticoid-inducible PNMT expression in a mouse pheochromocytoma model. Marian J. Evinger a, James F. Powers b and Arthur S. Tischler b a. Department
Identified proteins interacting with TMBIM1 by mass spectrometry
 Supplementary Information Journal: Nature Medicine Article Title: Corresponding Author: A novel multivesicular body regulator TMBIM1 protects against non-alcoholic fatty liver disease in mice and monkeys
Supplementary Figure 1.
 Supplementary Figure 1. Visualization of endoplasmic reticulum-mitochondria interaction by in situ proximity ligation assay. A) Illustration of targeted proteins in mitochondria (M), endoplasmic reticulum
Supplementary Figures
 Supplementary Figures mir-150 regulates obesityassociated insulin resistance by controlling B cell functions Wei Ying, Alexander Tseng, Richard Cheng-An Chang, Haiqing Wang, Yu-lieh Lin, Srikanth Kanameni,
A Hepatocyte Growth Factor Receptor (Met) Insulin Receptor hybrid governs hepatic glucose metabolism SUPPLEMENTARY FIGURES, LEGENDS AND METHODS
 Insulin Receptor hybrid governs hepatic glucose metabolism SUPPLEMENTARY FIGURES, LEGENDS AND METHODS") A Hepatocyte Growth Factor Receptor (Met) Insulin Receptor hybrid governs hepatic glucose metabolism Arlee Fafalios, Jihong Ma, Xinping Tan, John Stoops, Jianhua Luo, Marie C. DeFrances and Reza Zarnegar
A Hepatocyte Growth Factor Receptor (Met) Insulin Receptor hybrid governs hepatic glucose metabolism Arlee Fafalios, Jihong Ma, Xinping Tan, John Stoops, Jianhua Luo, Marie C. DeFrances and Reza Zarnegar
Supplementary Figures
 Supplementary Figures Supplementary Figure 1 Characterization of stable expression of GlucB and sshbira in the CT26 cell line (a) Live cell imaging of stable CT26 cells expressing green fluorescent protein
Supplementary Figure 1
 VO (ml kg - min - ) VCO (ml kg - min - ) Respiratory exchange ratio Energy expenditure (cal kg - min - ) Locomotor activity (x count) Body temperature ( C) Relative mrna expression TA Sol EDL PT Heart
Supplementary Figure 1 IMQ-Induced Mouse Model of Psoriasis. IMQ cream was
 Supplementary Figure 1 IMQ-Induced Mouse Model of Psoriasis. IMQ cream was painted on the shaved back skin of CBL/J and BALB/c mice for consecutive days. (a, b) Phenotypic presentation of mouse back skin
Inflammasome-mediated caspase-1 activity Gatekeeper of inflammation in the adipose tissue. Rinke Stienstra
 Inflammasome-mediated caspase-1 activity Gatekeeper of inflammation in the adipose tissue Rinke Stienstra Obesity promotes the development of insulin resistance and type 2 diabetes County-level Estimates
Pathogenesis of Diabetes Mellitus
 Pathogenesis of Diabetes Mellitus Young-Bum Kim, Ph.D. Associate Professor of Medicine Harvard Medical School Definition of Diabetes Mellitus a group of metabolic diseases characterized by hyperglycemia
Supplementary Figure 1 Chemokine and chemokine receptor expression during muscle regeneration (a) Analysis of CR3CR1 mrna expression by real time-pcr
 Analysis of CR3CR1 mrna expression by real time-pcr") Supplementary Figure 1 Chemokine and chemokine receptor expression during muscle regeneration (a) Analysis of CR3CR1 mrna expression by real time-pcr at day 0, 1, 4, 10 and 21 post- muscle injury. (b)
Supplementary Figure 1 Chemokine and chemokine receptor expression during muscle regeneration (a) Analysis of CR3CR1 mrna expression by real time-pcr at day 0, 1, 4, 10 and 21 post- muscle injury. (b)
Supplementary Figure 1 CD4 + T cells from PKC-θ null mice are defective in NF-κB activation during T cell receptor signaling. CD4 + T cells were
 Supplementary Figure 1 CD4 + T cells from PKC-θ null mice are defective in NF-κB activation during T cell receptor signaling. CD4 + T cells were isolated from wild type (PKC-θ- WT) or PKC-θ null (PKC-θ-KO)
AdPLA ablation increases lipolysis and prevents obesity induced by high fat feeding or leptin deficiency
 AdPLA AdPLA ablation increases lipolysis and prevents obesity induced by high fat feeding or leptin deficiency Kathy Jaworski, Maryam Ahmadian, Robin E. Duncan, Eszter Sarkadi-Nagy, Krista A. Va rady,
PANDER KO mice on high-fat diet are glucose intolerant yet resistant to fasting hyperglycemia and hyperinsulinemia
 FEBS Letters 585 (2011) 1345 1349 journal homepage: www.febsletters.org PANDER KO mice on high-fat diet are glucose intolerant yet resistant to fasting hyperglycemia and hyperinsulinemia Claudia E. Robert-Cooperman
Up-Regulation of Mitochondrial Activity and Acquirement of Brown Adipose Tissue-Like Property in the White Adipose Tissue of Fsp27 Deficient Mice
 Up-Regulation of Mitochondrial Activity and Acquirement of Brown Adipose Tissue-Like Property in the White Adipose Tissue of Fsp27 Deficient Mice Shen Yon Toh 1,2,3., Jingyi Gong 2., Guoli Du 2., John
Nature Immunology: doi: /ni Supplementary Figure 1. Gene expression profile of CD4 + T cells and CTL responses in Bcl6-deficient mice.
 Supplementary Figure 1 Gene expression profile of CD4 + T cells and CTL responses in Bcl6-deficient mice. (a) Gene expression profile in the resting CD4 + T cells were analyzed by an Affymetrix microarray
Diabetic silkworms for evaluation of therapeutically effective drugs
 Supplementary information Diabetic silkworms for evaluation of therapeutically effective drugs against type II diabetes. Yasuhiko Matsumoto, Masaki Ishii, Yohei Hayashi, Shinya Miyazaki, Takuya Sugita,
UNIVERSITY OF PNG SCHOOL OF MEDICINE AND HEALTH SCIENCES DIVISION OF BASIC MEDICAL SCIENCES DISCIPLINE OF BIOCHEMISTRY AND MOLECULAR BIOLOGY
 1 UNIVERSITY OF PNG SCHOOL OF MEDICINE AND HEALTH SCIENCES DIVISION OF BASIC MEDICAL SCIENCES DISCIPLINE OF BIOCHEMISTRY AND MOLECULAR BIOLOGY GLUCOSE HOMEOSTASIS An Overview WHAT IS HOMEOSTASIS? Homeostasis
What systems are involved in homeostatic regulation (give an example)?
?") 1 UNIVERSITY OF PNG SCHOOL OF MEDICINE AND HEALTH SCIENCES DIVISION OF BASIC MEDICAL SCIENCES DISCIPLINE OF BIOCHEMISTRY AND MOLECULAR BIOLOGY GLUCOSE HOMEOSTASIS (Diabetes Mellitus Part 1): An Overview
1 UNIVERSITY OF PNG SCHOOL OF MEDICINE AND HEALTH SCIENCES DIVISION OF BASIC MEDICAL SCIENCES DISCIPLINE OF BIOCHEMISTRY AND MOLECULAR BIOLOGY GLUCOSE HOMEOSTASIS (Diabetes Mellitus Part 1): An Overview
 DOI: 10.1038/ncb2210 b. ICAM1 ng ml -1 P = 0.0001 Small RNA (15-30nts) ng ml -1 Cell Lysate Exosome HDL Plasma HDL Normal Human HDL mirnas R = 0.45 P < 0.0001 Normal Human Exosome mirnas Figure S1. Characterization
Supplementary Information
 Supplementary Information Overexpression of Fto leads to increased food intake and results in obesity Chris Church, Lee Moir, Fiona McMurray, Christophe Girard, Gareth T Banks, Lydia Teboul, Sara Wells,
Supplementary Materials for
 www.sciencesignaling.org/cgi/content/full/8/375/ra41/dc1 Supplementary Materials for Actin cytoskeletal remodeling with protrusion formation is essential for heart regeneration in Hippo-deficient mice
Supplementary Figure 1
 Supplementary Figure 1 5 microns C7 B6 unclassified H19 C7 signal H19 guide signal H19 B6 signal C7 SNP spots H19 RNA spots B6 SNP spots colocalization H19 RNA classification Supplementary Figure 1. Allele-specific
Primer sequences Target Sequence F Sequence R TNF-α (Tnfa) TCAGCCGATTTGCTATCTCAT A
 TCAGCCGATTTGCTATCTCAT A") Supplementary Table 1. Q- and RT-PR primers used in this study. Primer sequences Target Sequence F Sequence R TNF-α (Tnfa) TGGTTTGTTTT GTTTGGGGTTG T hemokine (- motif) ligand 5 (cl5) GTGTTTGTTT TGGTGGTG
Supplementary Table 1. Q- and RT-PR primers used in this study. Primer sequences Target Sequence F Sequence R TNF-α (Tnfa) TGGTTTGTTTT GTTTGGGGTTG T hemokine (- motif) ligand 5 (cl5) GTGTTTGTTT TGGTGGTG
control kda ATGL ATGLi HSL 82 GAPDH * ** *** WT/cTg WT/cTg ATGLi AKO/cTg AKO/cTg ATGLi WT/cTg WT/cTg ATGLi AKO/cTg AKO/cTg ATGLi iwat gwat ibat
 body weight (g) tissue weights (mg) ATGL protein expression (relative to GAPDH) HSL protein expression (relative to GAPDH) ### # # kda ATGL 55 HSL 82 GAPDH 37 2.5 2. 1.5 1..5 2. 1.5 1..5.. Supplementary
Metabolic Syndrome. DOPE amines COGS 163
 Metabolic Syndrome DOPE amines COGS 163 Overview - M etabolic Syndrome - General definition and criteria - Importance of diagnosis - Glucose Homeostasis - Type 2 Diabetes Mellitus - Insulin Resistance