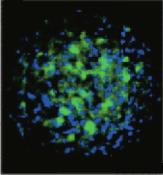
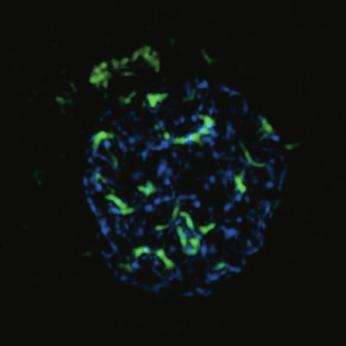
To this end, we performed immunofluorescent staining for GSCs (Fig.3). All the spheroidforming cells showed immunoreactivity for
|
|
|
- Crystal Hill
- 5 years ago
- Views:
Transcription
1
2
3
 whereas the remaining popula- Fig.")
. B,a representative histopathological view of the SB-induced tumor tissues. Arrows: pseudopallisading necrosis.")


4 H.Yoshioka et al. lished for isolation ofneural stem cells. Within hours of primary culture, murine brain tumors yielded a minority fraction of cells that formed neurosphere-like clusters (tumor spheroids; Fig.1C) whereas the remaining popula- Fig.1 lioma stem cell-like cells (GSCs) are inducible from murine spontaneous glioma A, Balb/c wild-type mice receiving Sleeping Beauty (SB) transposon-compatible oncogene transfection in the right ventricles developed brain tumors that mimic human glioblastoma (GBM ). B,a representative histopathological view of the SB-induced tumor tissues. Arrows: pseudopallisading necrosis. Arrowheads: vascular formation. Original magnification : 100x. C, neurosphere culture induced spheroid-forming cells from the SB glioma tissues. A representative view was obtained from GS02. Original magnification : 40x. Table 1 Characteristics of established murine GSC lines Line Median of MFI of ID Survival CD133 GS01 GS02 GS03 GS04 GS05 GS06 GS MFI of Nestin IC of TMZ N/A N/A N/A MFI : mean fluorescent intensity. IC : half maximal inhibitoryconcentration. N/A : not applicable. 108 tions of tumor cells were adherent (data not shown). We established 7 cell lines that tend to form tumor spheroids (Table 1). M urine glioma stem-like cells form glioma-like brain tumors in vivo To confirm the carcinogenicity of the spheroid-forming cells in vivo, the established cells (GS02, GS03, and GS06, respectively) were inoculated into the striatum of syngeneic Balb/c wild-type mice at 1,000 cells/brain. All mice receiving intracerebral transplants of the spheroid-forming cells died due to brain tumor growth within 1-2 months after inoculation (Fig. 2A). Histopathological studies revealed that the developed tumors invaded extensively from the transplantation sites,which mimics human GBM (Fig.2B). The tumors were infiltrating and featured nuclear atypia,necrotic areas,increased vascularization, and endothelial proliferation. M urine glioma stem-like cells express their specific markers at high levels. We next sought to evaluate whether the spheroid-forming cells would express GSC markers. To this end, we performed immunofluorescent staining for GSCs (Fig.3). All the spheroidforming cells showed immunoreactivity for CD133 (stem cell marker; Fig.3A) and nestin (neuron marker) at high levels (Fig.3B). In contrast, the spheroid-forming cells did not express markers for differentiated neurons, astrocytes,oroligodendrocytes(data not shown). Thesefindingssuggest that theinduced spheroidforming cells sharea verysimilarphenotypewith human GSCs. That is, spheroid-forming murine GBM lines that resemble human GSCs were successfullyinduced from SB transposon-mediated spontaneous GBM. Based on these data, we refer to the spheroid-forming GBM cells as murine GSCs from this point on. M urine GSCs exhibit ABC transporters at high levels Based on a line of previous finding that increased expression of ABC transporters is a characteristics of stem cell-like cells including GSCs, we sought to evaluate the expression levels ofrelevant ABC transporters. To this end, weextracted mrna from both theadherent cells and spheroid-forming GSCsto perform quantitative RT-PCR for several relevant ABC transporters (Fig.4). As a result, we observed a significant increase in Abcb1 (Fig.4A) and Abcg2 (Fig.4C)in the spheroid-forming GSCs compared with the adherent cells; Abcc1 showed no
 formed a tumor mass")

.")
 and nestin (B) expressions on the")

 transporters at high levels Total RNA was extracted from")
, Abcc1 (B), and Abcg2 (C). Values are relative to Gapdh expression levels.")
5 Role of ABCG2 in Glioma Stem Cells Fig.2 Murineglioma stem-likecells form glioma-likebrain tumors in vivo The spheroid-forming murine GBM cells (1,000 cells/brain) formed a tumor mass in the brain of syngeneic mice on days after inoculation. A, symptom-free survivals of the mice inoculated with the indicated cell lines in the brain. B, histopathological views of the tumor tissues induced by the indicated cell lines. Arrows: pseudopallisading necrosis. Arrow heads: vascular formation. Original magnification : 100x. significant difference (Fig.4B). These data suggest that the increased expressions of ABC transporters in GSCs contribute to their SP-skewed Fig.3 Murine glioma stem-like cells express their specific markers at high levels Representative data of CD133 (A) and nestin (B) expressions on the spheroid-forming cells. Left, fluorescent microscopic view. Nuclei were stained with DAPI. The representative data were obtained from GS02, and data from other cell lines are summarized in Table 1. Original magnification : 100x. Right,flow cytometry. Shaded histograms,spheroidforming cells; open histograms, corresponding adherent cells. Fig.4 Murine GSCs exhibit the adenosine triphosphatebinding cassette (ABC) transporters at high levels Total RNA was extracted from thespheroid-forming murinegbm cells(gs01,gs03,and GS06)and their counterpart adherent cells to perform quantitative RT-PCR for the expression levels of Abcb1 (A), Abcc1 (B), and Abcg2 (C). Values are relative to Gapdh expression levels. Lines within boxes denote means; box upper and lower bounds indicate SD ; whiskers indicate minimum and maximum values. Data were obtained from multiple lines, and experiments wererepeated at least threetimes. P-values are based on Students t-test. phenotype. M urine GSCs exhibit the drug-efflux abilityat high levels Recent studies suggest that the increased expression of various ABC transporters leads to chemo-resistance of human GSCs to TMZ. To confirm whether the murine GSCs exhibit a 109
6


7
8
9
Supplemental Figure 1. Intracranial transduction of a modified ptomo lentiviral vector in the mouse
 Supplemental figure legends Supplemental Figure 1. Intracranial transduction of a modified ptomo lentiviral vector in the mouse hippocampus targets GFAP-positive but not NeuN-positive cells. (A) Stereotaxic
SUPPLEMENTARY FIGURES
 SUPPLEMENTARY FIGURES 1 2 3 4 SUPPLEMENTARY TABLES Supplementary Table S1. Brain Tumors used in the study Code Tumor Classification Age Gender HuTuP51 Glioblastoma 57 Male HuTuP52 Glioblastoma 53 Male
Supplementary Figure 1 IMQ-Induced Mouse Model of Psoriasis. IMQ cream was
 Supplementary Figure 1 IMQ-Induced Mouse Model of Psoriasis. IMQ cream was painted on the shaved back skin of CBL/J and BALB/c mice for consecutive days. (a, b) Phenotypic presentation of mouse back skin
activation with anti-cd3/cd28 beads and 3d following transduction. Supplemental Figure 2 shows
 Supplemental Data Supplemental Figure 1 compares CXCR4 expression in untreated CD8 + T cells, following activation with anti-cd3/cd28 beads and 3d following transduction. Supplemental Figure 2 shows the
SUPPLEMENTARY INFORMATION
 DOI:.38/ncb3399 a b c d FSP DAPI 5mm mm 5mm 5mm e Correspond to melanoma in-situ Figure a DCT FSP- f MITF mm mm MlanaA melanoma in-situ DCT 5mm FSP- mm mm mm mm mm g melanoma in-situ MITF MlanaA mm mm
Supplementary Figure 1. Characterization of ALDH-positive cell population in MCF-7 cells. (a) Expression level of stem cell markers in MCF-7 cells or
 Expression level of stem cell markers in MCF-7 cells or") Supplementary Figure 1. Characterization of ALDH-positive cell population in MCF-7 cells. (a) Expression level of stem cell markers in MCF-7 cells or ALDH-positive cell population by qpcr. Data represent
Supplementary Figure 1. Characterization of ALDH-positive cell population in MCF-7 cells. (a) Expression level of stem cell markers in MCF-7 cells or ALDH-positive cell population by qpcr. Data represent
Supplemental Table S1
 Supplemental Table S. Tumorigenicity and metastatic potential of 44SQ cell subpopulations a Tumorigenicity b Average tumor volume (mm ) c Lung metastasis d CD high /4 8. 8/ CD low /4 6./ a Mice were injected
Effective activity of cytokine-induced killer cells against autologous metastatic melanoma including cells with stemness features
 Effective activity of cytokine-induced killer cells against autologous metastatic melanoma including cells with stemness features Loretta Gammaitoni, Lidia Giraudo, Valeria Leuci, et al. Clin Cancer Res
Supplementary Figure 1. Repression of hepcidin expression in the liver of mice treated with
 Supplementary Figure 1. Repression of hepcidin expression in the liver of mice treated with DMN Immunohistochemistry for hepcidin and H&E staining (left). qrt-pcr assays for hepcidin in the liver (right).
Supplemental Figure 1. Isolation and characterization of CD133+ neurosphere-like
 SUPPLEMENTL FIGURE LEGENDS Supplemental Figure 1. Isolation and characterization of CD133+ neurosphere-like spheroids from a human brain tumor sample or glioma xenograft. () CD133+ tumor cells isolated
Type of file: PDF Size of file: 0 KB Title of file for HTML: Supplementary Information Description: Supplementary Figures
 Type of file: PDF Size of file: 0 KB Title of file for HTML: Supplementary Information Description: Supplementary Figures Supplementary Figure 1 mir-128-3p is highly expressed in chemoresistant, metastatic
Supplementary Figure 1: Expression of NFAT proteins in Nfat2-deleted B cells (a+b) Protein expression of NFAT2 (a) and NFAT1 (b) in isolated splenic
 Protein expression of NFAT2 (a) and NFAT1 (b) in isolated splenic") Supplementary Figure 1: Expression of NFAT proteins in Nfat2-deleted B cells (a+b) Protein expression of NFAT2 (a) and NFAT1 (b) in isolated splenic B cells from WT Nfat2 +/+, TCL1 Nfat2 +/+ and TCL1 Nfat2
Supplementary Figure 1: Expression of NFAT proteins in Nfat2-deleted B cells (a+b) Protein expression of NFAT2 (a) and NFAT1 (b) in isolated splenic B cells from WT Nfat2 +/+, TCL1 Nfat2 +/+ and TCL1 Nfat2
SUPPLEMENTARY LEGENDS...
 TABLE OF CONTENTS SUPPLEMENTARY LEGENDS... 2 11 MOVIE S1... 2 FIGURE S1 LEGEND... 3 FIGURE S2 LEGEND... 4 FIGURE S3 LEGEND... 5 FIGURE S4 LEGEND... 6 FIGURE S5 LEGEND... 7 FIGURE S6 LEGEND... 8 FIGURE
Supplemental Data. Beck et al. (2010). Plant Cell /tpc
. Plant Cell /tpc") Supplemental Figure 1. Phenotypic comparison of the rosette leaves of four-week-old mpk4 and Col-0 plants. A mpk4 vs Col-0 plants grown in soil. Note the extreme dwarfism of the mpk4 plants (white arrows)
Supplemental Figure 1. Phenotypic comparison of the rosette leaves of four-week-old mpk4 and Col-0 plants. A mpk4 vs Col-0 plants grown in soil. Note the extreme dwarfism of the mpk4 plants (white arrows)
Glioma-initiating cells support glioblastoma heterogeneity at the level of integrin α5β1
 Glioma-initiating cells support glioblastoma heterogeneity at the level of integrin α5β1 MERCIER Marie-Cécile, 2th year PhD student Laboratoire de Biophotonique et Pharmacologie, UMR7213 CNRS Faculty of
CRIPTO-1 A POSSIBLE NEW BIOMARKER IN GLIOBLASTOMA MULTIFORME PIA OLESEN, MD, PHD STUDENT
 CRIPTO-1 A POSSIBLE NEW BIOMARKER IN GLIOBLASTOMA MULTIFORME PIA OLESEN, MD, PHD STUDENT Glioblastoma WHO Grade IV Glioma Heterogenic Undiffenrentiated phenotype 50% of all Gliomas Around 600 patients
Supplementary Figure 1
 Supplementary Figure 1 3 3 3 1 1 Bregma -1.6mm 3 : Bregma Ref) Http://www.mbl.org/atlas165/atlas165_start.html Bregma -.18mm Supplementary Figure 1 Schematic representation of the utilized brain slice
Supplementary Figure 1: GFAP positive nerves in patients with adenocarcinoma of
 SUPPLEMENTARY FIGURES AND MOVIE LEGENDS Supplementary Figure 1: GFAP positive nerves in patients with adenocarcinoma of the pancreas. (A) Images of nerves stained for GFAP (green), S100 (red) and DAPI
Supporting Information
 Supporting Information Chan et al. 1.173/pnas.9654916 A Patient B Xenograft C * remaining feature of normal lymph node * * * D lymphocytes Infiltrating transitional carcinoma cells E Enlarged axillary
Supplementary Figure 1. AdipoR1 silencing and overexpression controls. (a) Representative blots (upper and lower panels) showing the AdipoR1 protein
 Representative blots (upper and lower panels) showing the AdipoR1 protein") Supplementary Figure 1. AdipoR1 silencing and overexpression controls. (a) Representative blots (upper and lower panels) showing the AdipoR1 protein content relative to GAPDH in two independent experiments.
Supplementary Figure 1. AdipoR1 silencing and overexpression controls. (a) Representative blots (upper and lower panels) showing the AdipoR1 protein content relative to GAPDH in two independent experiments.
Nature Medicine doi: /nm.3150
 Nature Medicine doi:10.1038/nm.3150 Supplementary Table 1 Primer sequences used for q-pcr analysis Gene Forward primer Reverse primer Abca1 CAGCTTCCATCCTCCTTGTC CCACATCCACAACTGTCTGG Abcg1 GTACCATGACATCGCTGGTG
CHAPTER 5 RESULTS Previous study: cell culture and organotypical slices
 45 CHAPTER 5 RESULTS 5.1. Previous study: cell culture and organotypical slices Initial experiments have been conducted to ensure that the tet-on system works. A neuronal cell culture from mice expressing
Supplementary Material
 Supplementary Material Summary: The supplementary information includes 1 table (Table S1) and 4 figures (Figure S1 to S4). Supplementary Figure Legends Figure S1 RTL-bearing nude mouse model. (A) Tumor
Cancer Stem Cells & Glioblastoma
 Cancer Stem Cells & Glioblastoma JP Hugnot «Brain plasticity, Neural stem cells and Glial tumors» INSERM U1051-UM2 Institut des Neurosciences de Montpellier Montpellier 1-Stem cells and Brain Stem Cells
Supplementary Information
 Supplementary Information Temozolomide suppresses MYC via activation of TAp63 to inhibit progression of human glioblastoma Tomohiro Yamaki, Yusuke Suenaga, Toshihiko Iuchi, Jennifer Alagu, Atsushi Takatori,
Supplementary Figure 1. Double-staining immunofluorescence analysis of invasive colon and breast cancers. Specimens from invasive ductal breast
 Supplementary Figure 1. Double-staining immunofluorescence analysis of invasive colon and breast cancers. Specimens from invasive ductal breast carcinoma (a) and colon adenocarcinoma (b) were staining
SUPPLEMENTARY FIGURES
 SUPPLEMENTARY FIGURES 1 Supplementary Figure 1, Adult hippocampal QNPs and TAPs uniformly express REST a-b) Confocal images of adult hippocampal mouse sections showing GFAP (green), Sox2 (red), and REST
Figure 1. Possible role of oncogene activation, receptor, G-protein mutation, or tumor
 Figures Part of introduction Figure 1. Possible role of oncogene activation, receptor, G-protein mutation, or tumor supressor gene deletion in the induction of thyroid carcinoma. ( by James A Fagin, M.D.)
Osteoblast Play an Essential Role in Periodontal Bone Loss Through Activation of
 Osteoblast Play an Essential Role in Periodontal Loss Through Activation of Nuclear Factor-Kappa B Authors: Sandra Pacios 1, Wenmei Xiao 1,2, Marcelo Mattos 1, Jason Lim 1, Rohinton S. Tarapore 1, Sarah
Breeding scheme, transgenes, histological analysis and site distribution of SB-mutagenized osteosarcoma.
 Supplementary Figure 1 Breeding scheme, transgenes, histological analysis and site distribution of SB-mutagenized osteosarcoma. (a) Breeding scheme. R26-LSL-SB11 homozygous mice were bred to Trp53 LSL-R270H/+
Pharmacologic inhibition of histone demethylation as a therapy for pediatric brainstem glioma
 Supplementary information for: Pharmacologic inhibition of histone demethylation as a therapy for pediatric brainstem glioma Rintaro Hashizume 1, Noemi Andor 2, Yuichiro Ihara 2, Robin Lerner 2, Haiyun
TEB. Id4 p63 DAPI Merge. Id4 CK8 DAPI Merge
 a Duct TEB b Id4 p63 DAPI Merge Id4 CK8 DAPI Merge c d e Supplementary Figure 1. Identification of Id4-positive MECs and characterization of the Comma-D model. (a) IHC analysis of ID4 expression in the
Electron micrograph of phosphotungstanic acid-stained exosomes derived from murine
 1 SUPPLEMENTARY INFORMATION SUPPLEMENTARY FIGURES Supplementary Figure 1. Physical properties of murine DC-derived exosomes. a, Electron micrograph of phosphotungstanic acid-stained exosomes derived from
supplementary information
 DOI: 10.1038/ncb2153 Figure S1 Ectopic expression of HAUSP up-regulates REST protein. (a) Immunoblotting showed that ectopic expression of HAUSP increased REST protein levels in ENStemA NPCs. (b) Immunofluorescent
well for 2 h at rt. Each dot represents an individual mouse and bar is the mean ±
 Supplementary data: Control DC Blimp-1 ko DC 8 6 4 2-2 IL-1β p=.5 medium 8 6 4 2 IL-2 Medium p=.16 8 6 4 2 IL-6 medium p=.3 5 4 3 2 1-1 medium IL-1 n.s. 25 2 15 1 5 IL-12(p7) p=.15 5 IFNγ p=.65 4 3 2 1
Nature Medicine doi: /nm.3957
 Supplementary Fig. 1. p38 alternative activation, IL-21 expression, and T helper cell transcription factors in PDAC tissue. (a) Tissue microarrays of pancreatic tissue from 192 patients with pancreatic
Supplementary Figure 1. Identification of tumorous sphere-forming CSCs and CAF feeder cells. The LEAP (Laser-Enabled Analysis and Processing)
") Supplementary Figure 1. Identification of tumorous sphere-forming CSCs and CAF feeder cells. The LEAP (Laser-Enabled Analysis and Processing) platform with laser manipulation to efficiently purify lung
Supplementary Figure 1. Identification of tumorous sphere-forming CSCs and CAF feeder cells. The LEAP (Laser-Enabled Analysis and Processing) platform with laser manipulation to efficiently purify lung
Supplemental Figure S1. RANK expression on human lung cancer cells.
 Supplemental Figure S1. RANK expression on human lung cancer cells. (A) Incidence and H-Scores of RANK expression determined from IHC in the indicated primary lung cancer subgroups. The overall expression
SUPPLEMENTARY FIG. S2. Representative counting fields used in quantification of the in vitro neural differentiation of pattern of dnscs.
 Supplementary Data SUPPLEMENTARY FIG. S1. Representative counting fields used in quantification of the in vitro neural differentiation of pattern of anpcs. A panel of lineage-specific markers were used
Figure S1. The PDE5 inhibitor sildenafil interacts with celecoxib to kill cancer cell lines. (A) Hepatoma
 Hepatoma") Figure S1. The PDE5 inhibitor sildenafil interacts with celecoxib to kill cancer cell lines. (A) Hepatoma cells were treated with celecoxib ( 5.0 M) and/or sildenafil (, 2.0 M). ls were isolated after
Figure S1. The PDE5 inhibitor sildenafil interacts with celecoxib to kill cancer cell lines. (A) Hepatoma cells were treated with celecoxib ( 5.0 M) and/or sildenafil (, 2.0 M). ls were isolated after
SUPPLEMENTARY INFORMATION
 doi: 10.1038/nature06994 A phosphatase cascade by which rewarding stimuli control nucleosomal response A. Stipanovich*, E. Valjent*, M. Matamales*, A. Nishi, J.H. Ahn, M. Maroteaux, J. Bertran-Gonzalez,
Crizotinib in addition to Radiotherapy and TMZ in newly diagnosed GBM
 Crizotinib in addition to Radiotherapy and TMZ in newly diagnosed GBM Juan M Sepúlveda Sánchez Unidad Multidisciplinar de Neurooncología Hospital 12 de Octubre Madrid GEINO 1402. Phase Ib, open-label,
SUPPLEMENTARY INFORMATION
 DOI: 1.138/ncb222 / b. WB anti- WB anti- ulin Mitotic index (%) 14 1 6 2 T (h) 32 48-1 1 2 3 4 6-1 4 16 22 28 3 33 e. 6 4 2 Time (min) 1-6- 11-1 > 1 % cells Figure S1 depletion leads to mitotic defects
Postn MCM Smad2 fl/fl Postn MCM Smad3 fl/fl Postn MCM Smad2/3 fl/fl. Postn MCM. Tgfbr1/2 fl/fl TAC
 A Smad2 fl/fl Smad3 fl/fl Smad2/3 fl/fl Tgfbr1/2 fl/fl 1. mm B Tcf21 MCM Tcf21 MCM Smad3 fl/fl Tcf21 MCM Smad2/3 fl/fl Tcf21 MCM Tgfbr1/2 fl/fl αmhc MCM C 1. mm 1. mm D Smad2 fl/fl Smad3 fl/fl Smad2/3
Supplementary Materials for VAMP4 directs synaptic vesicles to a pool that selectively maintains asynchronous neurotransmission
 Supplementary Materials for VAMP4 directs synaptic vesicles to a pool that selectively maintains asynchronous neurotransmission Jesica Raingo, Mikhail Khvotchev, Pei Liu, Frederic Darios, Ying C. Li, Denise
Supplementary Figure 1. IDH1 and IDH2 mutation site sequences on WHO grade III
 Supplementary Materials: Supplementary Figure 1. IDH1 and IDH2 mutation site sequences on WHO grade III patient samples. Genomic DNA samples extracted from punch biopsies from either FFPE or frozen tumor
(A) RT-PCR for components of the Shh/Gli pathway in normal fetus cell (MRC-5) and a
 RT-PCR for components of the Shh/Gli pathway in normal fetus cell (MRC-5) and a") Supplementary figure legends Supplementary Figure 1. Expression of Shh signaling components in a panel of gastric cancer. (A) RT-PCR for components of the Shh/Gli pathway in normal fetus cell (MRC-5) and
Supplementary figure legends Supplementary Figure 1. Expression of Shh signaling components in a panel of gastric cancer. (A) RT-PCR for components of the Shh/Gli pathway in normal fetus cell (MRC-5) and
Supplementary Figures
 Supplementary Figures Supplementary Figure 1 Characterization of stable expression of GlucB and sshbira in the CT26 cell line (a) Live cell imaging of stable CT26 cells expressing green fluorescent protein
Hopkins University, Howard Hughes Medical Institute, USA) (27). Cells were maintained in DMEM
 (27). Cells were maintained in DMEM") Supplementary Materials and Methods Cell Culture HCT116 (TP53 +/+ and TP53 -/- ) cells were provided by Dr. Bert Vogelstein (Johns Hopkins University, Howard Hughes Medical Institute, USA) (27). Cells
Supplementary Materials and Methods Cell Culture HCT116 (TP53 +/+ and TP53 -/- ) cells were provided by Dr. Bert Vogelstein (Johns Hopkins University, Howard Hughes Medical Institute, USA) (27). Cells
Supplemental Figure 1. Quantification of proliferation in thyroid of WT, Ctns -/- and grafted
 Supplemental Figure 1. Quantification of proliferation in thyroid of WT, Ctns -/- and grafted Ctns -/- mice. Cells immunolabeled for the proliferation marker (Ki-67) were counted in sections (n=3 WT, n=4
Supplemental Figure 1. (A) The localization of Cre DNA recombinase in the testis of Cyp19a1-Cre mice was detected by immunohistchemical analyses
 The localization of Cre DNA recombinase in the testis of Cyp19a1-Cre mice was detected by immunohistchemical analyses") Supplemental Figure 1. (A) The localization of Cre DNA recombinase in the testis of Cyp19a1-Cre mice was detected by immunohistchemical analyses using an anti-cre antibody; testes at 1 week (left panel),
Supplemental Figure 1. (A) The localization of Cre DNA recombinase in the testis of Cyp19a1-Cre mice was detected by immunohistchemical analyses using an anti-cre antibody; testes at 1 week (left panel),
Supplemental Table 1. Primer sequences for transcript analysis
 Supplemental Table 1. Primer sequences for transcript analysis Primer Sequence (5 3 ) Primer Sequence (5 3 ) Mmp2 Forward CCCGTGTGGCCCTC Mmp15 Forward CGGGGCTGGCT Reverse GCTCTCCCGGTTTC Reverse CCTGGTGTGCCTGCTC
Nature Neuroscience: doi: /nn Supplementary Figure 1. MADM labeling of thalamic clones.
 Supplementary Figure 1 MADM labeling of thalamic clones. (a) Confocal images of an E12 Nestin-CreERT2;Ai9-tdTomato brain treated with TM at E10 and stained for BLBP (green), a radial glial progenitor-specific
Suppl Video: Tumor cells (green) and monocytes (white) are seeded on a confluent endothelial
 and monocytes (white) are seeded on a confluent endothelial") Supplementary Information Häuselmann et al. Monocyte induction of E-selectin-mediated endothelial activation releases VE-cadherin junctions to promote tumor cell extravasation in the metastasis cascade
Supplementary Information Häuselmann et al. Monocyte induction of E-selectin-mediated endothelial activation releases VE-cadherin junctions to promote tumor cell extravasation in the metastasis cascade
Stem Cells and The Endometrium. Director, Division of Reproductive Endocrinology and infertility
 Stem Cells and The Endometrium Hugh S. Taylor, M.D. Director, Division of Reproductive Endocrinology and infertility Nothing to disclose Stem Cells Cells that are capable of both self-renewal and have
(a) Significant biological processes (upper panel) and disease biomarkers (lower panel)
 Significant biological processes (upper panel) and disease biomarkers (lower panel)") Supplementary Figure 1. Functional enrichment analyses of secretomic proteins. (a) Significant biological processes (upper panel) and disease biomarkers (lower panel) 2 involved by hrab37-mediated secretory
Supplementary Figure 1. Functional enrichment analyses of secretomic proteins. (a) Significant biological processes (upper panel) and disease biomarkers (lower panel) 2 involved by hrab37-mediated secretory
Multiple mechanisms underlying acquired resistance to taxanes in selected docetaxelresistant MCF-7 breast cancer cells
 Wang et al. BMC Cancer 2014, 14:37 RESEARCH ARTICLE Multiple mechanisms underlying acquired resistance to taxanes in selected docetaxelresistant MCF-7 breast cancer cells Harris Wang 1, The Vo 1, Ali Hajar
Supplementary Figure 1: Fn14 is upregulated in the epidermis and dermis of mice
 Supplementary Figure 1: Fn14 is upregulated in the epidermis and dermis of mice undergoing AD- and psoriasis-like disease. Immunofluorescence staining for Fn14 (green) and DAPI (blue) in skin of naïve
(A) Cells grown in monolayer were fixed and stained for surfactant protein-c (SPC,
 Cells grown in monolayer were fixed and stained for surfactant protein-c (SPC,") Supplemental Figure Legends Figure S1. Cell line characterization (A) Cells grown in monolayer were fixed and stained for surfactant protein-c (SPC, green) and co-stained with DAPI to visualize the nuclei.
Supplemental Figure Legends Figure S1. Cell line characterization (A) Cells grown in monolayer were fixed and stained for surfactant protein-c (SPC, green) and co-stained with DAPI to visualize the nuclei.
Nature Genetics: doi: /ng.2995
 Supplementary Figure 1 Kaplan-Meier survival curves of patients with brainstem tumors. (a) Comparison of patients with PPM1D mutation versus wild-type PPM1D. (b) Comparison of patients with PPM1D mutation
Supplementary Figure 1. Validation of astrocytes. Primary astrocytes were
 Supplementary Figure 1. Validation of astrocytes. Primary astrocytes were separated from the glial cultures using a mild trypsinization protocol. Anti-glial fibrillary acidic protein (GFAP) immunofluorescent
As outlined under External contributions (see appendix 7.1), the group of Prof. Gröne at the
, the group of Prof. Gröne at the") 3 RESULTS As outlined under External contributions (see appendix 7.1), the group of Prof. Gröne at the DKFZ in Heidelberg (Dept. of Cellular and Molecular pathology) contributed to this work by performing
3 RESULTS As outlined under External contributions (see appendix 7.1), the group of Prof. Gröne at the DKFZ in Heidelberg (Dept. of Cellular and Molecular pathology) contributed to this work by performing
Supplementary Figures
 Supplementary Figures Supplementary Fig. 1. Galectin-3 is present within tumors. (A) mrna expression levels of Lgals3 (galectin-3) and Lgals8 (galectin-8) in the four classes of cell lines as determined
Data Mining for Research and Diagnostics
 UCL DEPARTMENT OF GEOGRAPHY UCL INSTITUTE OF NEUROLOGY Data Mining for Research and Diagnostics Sebastian Brandner, UCL Institute of Neurology, London Data mining for Research and Diagnostics Our setup
Supplemental Figure 1. (A) Western blot for the expression of RIPK1 in HK-2 cells treated with or without LPS (1 µg/ml) for indicated times.
 Western blot for the expression of RIPK1 in HK-2 cells treated with or without LPS (1 µg/ml) for indicated times.") Supplemental Figure 1. (A) Western blot for the expression of RIPK1 in HK-2 cells treated with or without LPS (1 µg/ml) for indicated times. Western blots shown are representative results from 3 independent
Supplemental Figure 1. (A) Western blot for the expression of RIPK1 in HK-2 cells treated with or without LPS (1 µg/ml) for indicated times. Western blots shown are representative results from 3 independent
Reviewers' comments: Reviewer #1 (Remarks to the Author):
:") Reviewers' comments: Reviewer #1 (Remarks to the Author): In this interesting article, Kondo et al demonstrate that Notch signaling can induce Tscm-like fate in activated T cells. This work extends prior
Reviewers' comments: Reviewer #1 (Remarks to the Author): In this interesting article, Kondo et al demonstrate that Notch signaling can induce Tscm-like fate in activated T cells. This work extends prior
Supplementary Appendix
 Supplementary Appendix This appendix has been provided by the authors to give readers additional information about their work. Supplement to: Bredel M, Scholtens DM, Yadav AK, et al. NFKBIA deletion in
Description of Supplementary Files. File Name: Supplementary Information Description: Supplementary Figures and Supplementary Tables
 Description of Supplementary Files File Name: Supplementary Information Description: Supplementary Figures and Supplementary Tables Supplementary Figure 1: (A), HCT116 IDH1-WT and IDH1-R132H cells were
Neocortex Zbtb20 / NFIA / Sox9
 Neocortex / NFIA / Sox9 Supplementary Figure 1. Expression of, NFIA, and Sox9 in the mouse neocortex at. The lower panels are higher magnification views of the oxed area. Arrowheads indicate triple-positive
(A) PCR primers (arrows) designed to distinguish wild type (P1+P2), targeted (P1+P2) and excised (P1+P3)14-
 PCR primers (arrows) designed to distinguish wild type (P1+P2), targeted (P1+P2) and excised (P1+P3)14-") 1 Supplemental Figure Legends Figure S1. Mammary tumors of ErbB2 KI mice with 14-3-3σ ablation have elevated ErbB2 transcript levels and cell proliferation (A) PCR primers (arrows) designed to distinguish
1 Supplemental Figure Legends Figure S1. Mammary tumors of ErbB2 KI mice with 14-3-3σ ablation have elevated ErbB2 transcript levels and cell proliferation (A) PCR primers (arrows) designed to distinguish
Supplemental Figures:
 Supplemental Figures: Figure 1: Intracellular distribution of VWF by electron microscopy in human endothelial cells. a) Immunogold labeling of LC3 demonstrating an LC3-positive autophagosome (white arrow)
Glioblastoma Multiforme
 Glioblastoma Multiforme Highly malignant, invasive, difficult-to-treat primary brain tumor" " Frequency: 9,000 cases/year (peak age, 55 65 years)" " Recurrence: rapid growth; size may double every 10 days"
Title: Nuclear entrapment and extracellular depletion of PCOLCE is associated with muscle degeneration in oculopharyngeal muscular dystrophy
 Author's response to reviews Title: Nuclear entrapment and extracellular depletion of PCOLCE is associated with muscle degeneration in oculopharyngeal muscular dystrophy Authors: Vered Raz (v.raz@lumc.nl)
Nature Medicine: doi: /nm.4322
 1 2 3 4 5 6 7 8 9 10 11 Supplementary Figure 1. Predicted RNA structure of 3 UTR and sequence alignment of deleted nucleotides. (a) Predicted RNA secondary structure of ZIKV 3 UTR. The stem-loop structure
Supplementary Fig. 1 p38 MAPK negatively regulates DC differentiation. (a) Western blot analysis of p38 isoform expression in BM cells, immature DCs
 Western blot analysis of p38 isoform expression in BM cells, immature DCs") Supplementary Fig. 1 p38 MAPK negatively regulates DC differentiation. (a) Western blot analysis of p38 isoform expression in BM cells, immature DCs (idcs) and mature DCs (mdcs). A myeloma cell line expressing
Supplementary Fig. 1 p38 MAPK negatively regulates DC differentiation. (a) Western blot analysis of p38 isoform expression in BM cells, immature DCs (idcs) and mature DCs (mdcs). A myeloma cell line expressing
Supplementary Information
 Supplementary Information Supplementary Figure 1! a! b! Nfatc1!! Nfatc1"! P1! P2! pa1! pa2! ex1! ex2! exons 3-9! ex1! ex11!!" #" Nfatc1A!!" Nfatc1B! #"!" Nfatc1C! #" DN1! DN2! DN1!!A! #A!!B! #B!!C! #C!!A!
Figure S1. Sorting nexin 9 (SNX9) specifically binds psmad3 and not psmad 1/5/8. Lysates from AKR-2B cells untreated (-) or stimulated (+) for 45 min
 specifically binds psmad3 and not psmad 1/5/8. Lysates from AKR-2B cells untreated (-) or stimulated (+) for 45 min") Figure S1. Sorting nexin 9 (SNX9) specifically binds psmad3 and not psmad 1/5/8. Lysates from AKR2B cells untreated () or stimulated () for 45 min with 5 ng/ml TGFβ or 10 ng/ml BMP4 were incubated with
Figure S1. Sorting nexin 9 (SNX9) specifically binds psmad3 and not psmad 1/5/8. Lysates from AKR2B cells untreated () or stimulated () for 45 min with 5 ng/ml TGFβ or 10 ng/ml BMP4 were incubated with
Supplementary Figure 1. Genotyping strategies for Mcm3 +/+, Mcm3 +/Lox and Mcm3 +/- mice and luciferase activity in Mcm3 +/Lox mice. A.
 Supplementary Figure 1. Genotyping strategies for Mcm3 +/+, Mcm3 +/Lox and Mcm3 +/- mice and luciferase activity in Mcm3 +/Lox mice. A. Upper part, three-primer PCR strategy at the Mcm3 locus yielding
c Ischemia (30 min) Reperfusion (8 w) Supplementary Figure bp 300 bp Ischemia (30 min) Reperfusion (4 h) Dox 20 mg/kg i.p.
 Reperfusion (8 w) Supplementary Figure bp 300 bp Ischemia (30 min) Reperfusion (4 h) Dox 20 mg/kg i.p.") a Marker Ripk3 +/ 5 bp 3 bp b Ischemia (3 min) Reperfusion (4 h) d 2 mg/kg i.p. 1 w 5 w Sacrifice for IF size A subset for echocardiography and morphological analysis c Ischemia (3 min) Reperfusion (8
a Marker Ripk3 +/ 5 bp 3 bp b Ischemia (3 min) Reperfusion (4 h) d 2 mg/kg i.p. 1 w 5 w Sacrifice for IF size A subset for echocardiography and morphological analysis c Ischemia (3 min) Reperfusion (8
MATERIALS AND METHODS. Neutralizing antibodies specific to mouse Dll1, Dll4, J1 and J2 were prepared as described. 1,2 All
 MATERIALS AND METHODS Antibodies (Abs), flow cytometry analysis and cell lines Neutralizing antibodies specific to mouse Dll1, Dll4, J1 and J2 were prepared as described. 1,2 All other antibodies used
SUPPLEMENTARY FIGURES AND TABLE
 SUPPLEMENTARY FIGURES AND TABLE Supplementary Figure S1: Characterization of IRE1α mutants. A. U87-LUC cells were transduced with the lentiviral vector containing the GFP sequence (U87-LUC Tet-ON GFP).
Supplemental Figure 1
 Supplemental Figure 1 1a 1c PD-1 MFI fold change 6 5 4 3 2 1 IL-1α IL-2 IL-4 IL-6 IL-1 IL-12 IL-13 IL-15 IL-17 IL-18 IL-21 IL-23 IFN-α Mut Human PD-1 promoter SBE-D 5 -GTCTG- -1.2kb SBE-P -CAGAC- -1.kb
Supplementary Figures
 Supplementary Figures Supplementary Figure 1 Increased ABHD5 expression in human colon cancer associated macrophages. (a) Murine peritoneal macrophages were treated with regular culture medium (Ctrl) or
Supplementary Figure 1 Induction of cellular senescence and isolation of exosome. a to c, Pre-senescent primary normal human diploid fibroblasts
 Supplementary Figure 1 Induction of cellular senescence and isolation of exosome. a to c, Pre-senescent primary normal human diploid fibroblasts (TIG-3 cells) were rendered senescent by either serial passage
Lentiviral Delivery of Combinatorial mirna Expression Constructs Provides Efficient Target Gene Repression.
 Supplementary Figure 1 Lentiviral Delivery of Combinatorial mirna Expression Constructs Provides Efficient Target Gene Repression. a, Design for lentiviral combinatorial mirna expression and sensor constructs.
Empirical Study on Chemotherapeutic Susceptibility of SP Cells in Human Pulmonary Adenocarcinoma Cell Line A549 in Vitro
 Clin Oncol Cancer Res (1) 7: 265-27 DOI 1.17/s115-1-529-5 265 Empirical Study on Chemotherapeutic Susceptibility of SP Cells in Human Pulmonary Adenocarcinoma Cell Line A549 in Vitro Tong XIE Li LI De-seng
Nature Neuroscience: doi: /nn Supplementary Figure 1
 Supplementary Figure 1 EGFR inhibition activates signaling pathways (a-b) EGFR inhibition activates signaling pathways (a) U251EGFR cells were treated with erlotinib (1µM) for the indicated times followed
Amniotic fluid stem cells provide considerable advantages in epidermal. regeneration: B7H4 creates a moderate inflammation
 Amniotic fluid stem cells provide considerable advantages in epidermal regeneration: B7H4 creates a moderate inflammation microenvironment to promote wound repair Qing Sun 1, +, Fang Li 1, +, Hong Li 2,
Clinical Trials for Adult Brain Tumors - the Imaging Perspective
 Clinical Trials for Adult Brain Tumors - the Imaging Perspective Whitney B. Pope, M.D., Ph.D. Department of Radiology David Geffen School of Medicine at UCLA August 22, 2015 1 Disclosure of Financial Relationships
Supplemental data Supplemental Figure Legends Supplemental Figure 1. Supplemental Figure 2.
 Supplemental data Supplemental Figure Legends Supplemental Figure 1. Analysis of deletion of AMPK!2 in POMC and AgRP neurons in control and POMC!2KO and AgRP!2KO mice. (A) mmunofluorescence analysis for
Expression of Mutant p53 Proteins Implicates a Lineage Relationship between Neural Stem Cells and Malignant Astrocytic Glioma in a Murine Model
 Article Expression of Mutant p53 Proteins Implicates a Lineage Relationship between Neural Stem Cells and Malignant Astrocytic Glioma in a Murine Model Yuan Wang, 1,2,6 Jiong Yang, 1,2,6 Huarui Zheng,
condition. Left panel, the HCT-116 cells were lysed with RIPA buffer containing 0.1%
 FIGURE LEGENDS Supplementary Fig 1 (A) sumoylation pattern detected under denaturing condition. Left panel, the HCT-116 cells were lysed with RIPA buffer containing 0.1% SDS in the presence and absence
Supplementary Figure 1.
 Supplementary Figure 1. Female Pro-ins2 -/- mice at 5-6 weeks of age were either inoculated i.p. with a single dose of CVB4 (1x10 5 PFU/mouse) or PBS and treated with αgalcer or control vehicle. On day
Differential Connexin Function Enhances Self-Renewal in Glioblastoma
 CSU ID: 2558414 Name: Sonal Patel Differential Connexin Function Enhances Self-Renewal in Glioblastoma Cancer is one of the most common disease in the US with more than a million people affected every
mm Distance (mm)
") b a Magnet Illumination Coverslips MPs Objective 2575 µm 1875 µm 1575 µm 1075 µm 875 µm 545 µm 20µm 2 3 0.5 0.3mm 1 1000 100 10 1 0.1 1000 100 10 1 0.1 Field Induction (Gauss) 1.5 0 5 10 15 20 Distance
b a Magnet Illumination Coverslips MPs Objective 2575 µm 1875 µm 1575 µm 1075 µm 875 µm 545 µm 20µm 2 3 0.5 0.3mm 1 1000 100 10 1 0.1 1000 100 10 1 0.1 Field Induction (Gauss) 1.5 0 5 10 15 20 Distance
PID1 increases chemotherapy-induced apoptosis in medulloblastoma and glioblastoma cells in a manner that involves NFκB
 SUPPLEMENTARY FIGURES: PID1 increases chemotherapy-induced apoptosis in medulloblastoma and glioblastoma cells in a manner that involves NFκB Jingying Xu, Xiuhai Ren, Anup Singh Pathania, G. Esteban Fernandez,
Fig 1 CD163. CD11b S100A9. Sirius Red. 100μm ** ** CD163. CD11b S100A9 ** Sirius Red (PL) Sirius Red SUM Mo.
 Sirius Red SUM Mo.") T47D T47D + o SU-59 Fig SU-59 + o IHC score (-3) IHC score (-2) CD63 3 2 IHC score (-3) CD63 3 ** 2 CDb CDb * * SA9 SA9 ** * 2 IHC score (-4) αsa αsa 4 ** ** 2 Sirius Red μm IHC score (%) Sirius Red 8
T47D T47D + o SU-59 Fig SU-59 + o IHC score (-3) IHC score (-2) CD63 3 2 IHC score (-3) CD63 3 ** 2 CDb CDb * * SA9 SA9 ** * 2 IHC score (-4) αsa αsa 4 ** ** 2 Sirius Red μm IHC score (%) Sirius Red 8
and follicular helper T cells is Egr2-dependent. (a) Diagrammatic representation of the
 Diagrammatic representation of the") Supplementary Figure 1. LAG3 + Treg-mediated regulation of germinal center B cells and follicular helper T cells is Egr2-dependent. (a) Diagrammatic representation of the experimental protocol for the
Supplementary Figure 1. LAG3 + Treg-mediated regulation of germinal center B cells and follicular helper T cells is Egr2-dependent. (a) Diagrammatic representation of the experimental protocol for the
Supplemental Information. Induction of Expansion and Folding. in Human Cerebral Organoids
 Cell Stem Cell, Volume 20 Supplemental Information Induction of Expansion and Folding in Human Cerebral Organoids Yun Li, Julien Muffat, Attya Omer, Irene Bosch, Madeline A. Lancaster, Mriganka Sur, Lee
Supplementary Figure 1: si-craf but not si-braf sensitizes tumor cells to radiation.
 Supplementary Figure 1: si-craf but not si-braf sensitizes tumor cells to radiation. (a) Embryonic fibroblasts isolated from wildtype (WT), BRAF -/-, or CRAF -/- mice were irradiated (6 Gy) and DNA damage