+ + + IP: Anti-Flag. Catalytic domain. Regulatory domain. Myr SH3 SH2 Kinase domain PP2. Flag-HK1. c-src ΔSH3. HK1 N-half: C-half:
|
|
|
- Ambrose Randall
- 6 years ago
- Views:
Transcription


1 a d h ΔSH2 Δ(SH3SH2) Myr SH3 SH2 Kinase domain csrc ΔSH3 FlagHK HAcSrc HAcSrcΔSH2 HAcSrcΔSH3 HAcSrcΔ(SH3SH2) WB: FlagHK HAcSrc HAcSrcKD HAcSrcY529F WB: HisHK2HK2 Input GSTcSrc GST : : GST pull down WB:HK2 GST e b HK Nhalf: 454 Chalf: Cox 8aGFP HKRFP FlagcSrc DAPI Merge GST pull down GSTcSrc Truncated GSTcSrc i Regulatory domain : FlagHK FlagHKNhalf FlagHKChalf HAcSrc WB: PP2 FlagHK2 HAcSrc WB: Catalytic 454 domain 97 : j f c PP2 FlagHK HAcSrc WB: : : HAcSrc FlagHK2 WB: g HAcSrcKD HAcSrcY529F Anti: HA HAcSrc FlagHK2 WB: FlagHK2 HAcSrc WB: : :.45.5
2 Supplementary Figure. csrc activity is essential for its interaction with HK and HK2. (a) SH2 (Src homology) domain is indispensable for csrc to interact with HK. FlagHK was cotransfected into HEK 293T cells separately with HAcSrc and its deletion mutants ΔSH3 (with aa 865 deleted), ΔSH2 (with aa 5249 deleted) and Δ(SH3SH2) (with aaa deleted). s were performed with M 2 beads (antiflag). Immunoprecipitates and total cell lysates were analyzed by WB with antiha for csrc and antiflag for HK. Myr, myristylation domain. (b) Nhalf (aa 454) of HK is mainly responsible for its interaction with csrc. (c) PP2, a csrc inhibitor, impaired the interaction between csrc and HK. HEK 293T cells were transfected with the combinations of plasmids as indicated. 24 hours posttransfection, cells were treated with μm PP2 for 4 hours. The cell lysates were immunoprecipitated with M 2 beads. The immunoprecipitates were detected for proteins as depicted. (d) The activity of csrc is essential for its interaction with HK. csrc, csrckd and csrcy529f was transfected alone, or together with FlagHK into HEK 293T cells. Lysates were immunoprecipitated with M 2 beads, followed by detection with antiflag for HK and antiha for coimmunoprecipitated csrc. (e) In HeLa cells, HK and csrc complex showed less colocalization in mitochondria than in cytoplasm. Cox 8a was a mitochondrial marker. scale bar, 3μm (f, g) csrc can interact with HK2. HEK 293T cells were transfected with HAcSrc and FlagHK2 in combinations as indicated. Reciprocal s were performed to precipitate HAcSrc (f) and FlagHK2 (g). (h) HK2 interacts with csrc in vitro. GST pull down was carried out with bacterially expressed HisHK2 and GSTcSrc. GST protein was used as a negative control. Large amounts of HisHK2 were precipitated by GSTcSrc, but not by GST. Left panel, coomassie brilliant blue staining of precipitates; right panel, WB detection of the same precipitates. (i) The interaction between csrc and HK2 was abrogated by treatment of HEK 293T cells with PP2. (j) csrc kinase activity is required for its interaction with HK2 in HEK 293T cells.
3 a WB: commercial HK antibody b HeLa shgfp shhk c WB: AntiHK HeLa A549 IgG HK IgG HK HisHK(364aa) antibody GSTHK(364aa) antibody WB: Commercial HK antibody HisHK(364aa) antibody AntiHK Antiβactin GSTHK(364aa) antibody Antiβactin d shgfp shsrc e : IgG HK IgG HK IgG HK HK WB: AntipTyr PP2 WB: AntipTyr ptyr/actin..5 AntiHK AntiHK AntiHK AnticSrc csrc/actin Antiβactin AntiHK AnticSrc Antiβactin f : HAcSrc HAcSrcKD FlagHK2 WB: AntipTyr g CIAP HAcSrc FlagHK2 WB: AntipTyr : h PP2 FlagHK2 HAcSrc WB: AntipTyr : i HisHK2 GSTcSrc GSTcSrcKD WB: AntipTyr AnticSrc AntiHK2 j FlagHK2 HAcSrc WB: AntipTyr : k GSTcSrc HisHK2 HisHK2Y686F WB: AntipTyr AntiHK2 AnticSrc Supplementary Figure 2. Both HK and HK2 are phosphorylated by csrc. (a) HK antibody raised with GSTHK (aa 364) as immunogen showed high valency towards HK. Bacterially expressed GST or Histagged fragments (aa 364) of HK were employed to immunize rabbits, followed by affinity purification of corresponding antibodies. Purified antibodies were subjected to detect endogenous HK in HCT6, HeLa and U2OS cells. A commercially available HK antibody acts as a positive control. (b) High specificity of homemade antihk antibody is indicated by knock down of endogenous HK in HeLa. (c) Homemade HK antibody is suitable for immunoprecipitation. Endogenous HK in HeLa and A549 cells were successfully ed by employing homemade antihk antibody. (d) Partial knockdown of csrc in A549 cells diminishes tyrosine phosphorylation of endogenous HK. (e) Tyrosine phosphorylation of endogenous HK was effectively abolished by treating A549 cells with PP2. (f) It is csrc, but not csrckd that strongly phosphorylates HK2 in HEK 293T cells. (g) Treatment of cell lysates with CIAP thoroughly abolished the tyrosine phosphorylation of HK2 mediated by csrc in HEK 293T cells. (h) Phosphorylation level of HK2 induced by csrc in HE EK 293T cells was eliminated by the treatment of cells with PP2. (i) Recombinant HK2 can be effectively phosphorylated by bacterially purified csrc rather than csrckd. (j) The mutation of HK2 Y686F could abolish the tyrosine phosphorylation induced by csrc in HEK 293T cells. (k) In vitro kinase assay showed that csrc could phosphorylate HK2 WT but not HK2 Y686F.
 p 4, 5, 6 (phosphotyr732")


4 a WB: AntipY732 c AntipY , 2, 3 (unphosphotyr732 p peptide) p 4, 5, 6 (phosphotyr732 peptide) AntipY732 preincubated with HKpY732 peptides AntipY732 Preincubated with HK peptides b FlagHK FlagHKY732F HAcSrc WB: : : WB: AntipY732 AntipY732 preincubated with HKpY732 peptides AntipY732 Preincubated with HK peptides d h FlagHK2 FlagHK2Y686F HAcSrc WB: AntipTyr AntipHK2Y686 2AntipHK2Y686 HK2 csrc HK2 FlagHK FlagHK2 HAcSrc PDGF PP2 WB: AntipcSrc : : e PP2 WB: AntipY732 i AntiHK AntipcSrc AnticSrc Antiβactin WB: AntipY732 AntiHK2 AntiHK AntipcSrc AnticSrc Antiβactin k Flag: vector csrc Hck Lck Blk Yes HAHKHK HAHK Y732F WB: AntiHKpY732 : HA 5 5 f g : Pervanadate FlagHK WB: AntipY732 HAPDGFR py732/actin. 2. PP2 AntiHK AntipcSrc pcsrc/actin. 3. AnticSrc Antiβactin WB: AntipY732 j HFF WB: AntipY732 AntiHK AnticSrc Antiβactin AntipcSrc l Flag: vector csrc Hck Lck Blk Yes HAHK2 HAHK Y686F WB: AntipTyr : HA
5 Supplementary Figure 3. csrc phosphorylates HK at Tyr732 and HK2 at Tyr686. (a) The antipy732 antibody specifically recognized phosphorylated oligopeptides containing phosphorylated Y732 residue were used to immunize rabbits, followed by purification of antihkphosphoy732 antibody (designated as antipy732) with CNBr beads. The specificity of antipy732 was determined by detecting KLHtagged peptides with or without Y732 phosphorylated by immunodot blotting. (b) The specificity of our selfmade antipy732 antibody was confirmed by WB with this antibody preincubated with HKpY732 or HK peptides. The expression plasmids encoding HK and HK Y732F were transfected into HEK 293T cells with or without HAcSrc. Cell lysates were used to immunoprecipitation by M 2 beads and followed by WB with indicated antibodies. (c) The antibody against to HK Y732 phosphorylation is specific for immunohistochemistry. Colorectal tissues were immunostainned with the corresponding antibodies. (d) Two antibodies prepared by using synthesized HK2 peptides containing phosphorylated Y686 residue as immunogen failed to specifically recognize phosphorylated HK2. and 2 refer to serums from two immunized rabbits. (e) Inhibition of csrc activity by PP2 resulted in decreasing HKY732 phosphorylation. (f) HKY732 phosphorylation was significantly increased by exposure of A549 cells to. mm pervanadate for minutes. (g) Treatment with PP2 could block the HK Y732 phosphorylation induced by overexpression of PDGFR in HEK 293T cells. (h) The associations between HK /HK2 and csrc were enhanced by stimulating cells with PDGF, but this effect could be reversed by cotreatment with PP2. After 24 hours of transfection, HEK 293T cells were exposed to PP2 4 hours and PDGF for minutes alone or in combination. (i) Y732 phosphorylation levels of HK strongly correlate with Y49 phosphorylation levels of csrc in various cancer cell lines. (j) Both PDGF(2ngml ) and EGF ( ng ml ) effective ely stimulated HKY732 phosphorylation in human foreskin fibroblast (HFF) cells. (k, l) Among four Src family members examined other than csrc, Yes showed much weak effect on HK Y732 phosphorylation (k) and HK2 tyrosine phosphorylation (l) in HEK 293T cells compared to csrc. HK. Keyhole limpet hemocyanin (KLH)tagged

 WB: AntiHK2 HisHK2 HisHK2 Y686F 5 2 6 5 2 6 25 k HK activity relative to vector 4 3 2 * FlagHK2 PDGF PP2 WB: AntipcSrc Antiactin l HK activity relative to vector.5.5 WB: AntiHK2 AntiHK Antiactin *")
6 a Relative HK activity 2.5 * * FlagHK2 FlagHK2Y686F e WB: Antiactin Relative HK activity * FlagHK2 PP2 SU6656 WB: AntipcSrc AnticSrc Antiβactin f b Relative HK activity FlagHK2 FlagHK2Y686F HAcSrc WB: Re elative HK activity Antiactin shgfp shsrc FlagHK2 WB: AnticSrc Antiactin * N.S. * g HK activity relative to blank vector c WB: AntiHK Relative HK activity FlagHK PP2 WB: shhk rhk rhky732f rhkkd AntipcSrc Antiactin Antiactin h d Relative HK activity shgfp shsrc FlagHK WB: lative HK activity AnticSrc Antiactin *.5 *.25 *.75 N.S shhk2 rhk2 rhk2y686f Re WB: AntiHK2 Antiactin i Trypsin (min) WB: AntiHK HisHK HisHK Y732F j Trypsin (min) WB: AntiHK2 HisHK2 HisHK2 Y686F k HK activity relative to vector * FlagHK2 PDGF PP2 WB: AntipcSrc Antiactin l HK activity relative to vector.5.5 WB: AntiHK2 AntiHK Antiactin *
7 Supplementary Figure 4. csrc promotes catalytic activities of both HK and HK2. (a) In HEK 293T cells, HK2Y686F showed greatly decreased enzymatic activity as compared to WT HK2. (b) Cotransfection of csrc enhanced the activity of HK2, but not HK2Y686F in HEK 293T cells. (c) PP2 effectively inhibited HK activity. A549 was overexpressed with FlagHK followed by treatment with or without PP2. Hexokinase activity was determined as described in Methods. (d) Knockdown of csrc diminished catalytic ability of HK. FlagHK was expressed in A549 cells with csrc already knockeddown. HK activity was measured accordingly. (e) Treatment with PP2 or SU6656 disrupted the increase of hexokinase activity induced by overexpression of HK2 in HeLa cells. (f) Knock down of csrc abolished the augment of hexokinase activity caused by expression of FlagHK2 in HeLa cells. (g) Reexpression expression of HK, but not HKY732F or HKKD KD in HK knockeddowndown A549 cells rescued hexokinase activity. (h) Reexpressed HK2, but not its mutation, rescued the HK activity of HeLa cells deprived of endogenous HK2. (i, j) The digestion patterns of HK mutants were the same as their wild type controls. Equal amounts of HK and their mutant protein were digested with trypsin (2 μm) at 37 for indicated times, followed by SDSPADE and Western blot to determine the digestion patterns. (k) PDGF functioned to stimulate HK2 enzyme activity, and such effect was neutralized by treatment of cells with PP2 in HeLa cells. (l) HK and HK2 were knocked down with corresponding shrnas, followed by measurement of total HK activity accordingly. After normalization of enzyme activities to corresponding knockdown efficiencies, two isozymes contribute almost equally to total HK activity in HeLa cells. HK activities in each panel were normalized to the control cells (the first bar) and shown as means±s.d. (three experimental replicates). Unpaired student s t test was used to analyze the significance. *p<.5, p<., *p<., N.S. represents no significant difference.
8 a d 2Deoxyglucose upta ake Cpm μg min * FlagHK FlagHKY732F 2Deoxyglucose upta ake Cpm μg min HAcSrc WB: Antiactin shgfp shsrc FlagHK WB: AnticSrc Antiactin e 2Deoxyglucose uptak ke Cpm μg min b ke 2Deoxyglucose uptak Cpm μg min shhk rhk WB: AntiHK FlagHK2 PP2 WB: AntipcSrc Antiactin Antiactin 5 * rhky732f f 2Deoxyglucose uptak ke Cpm μg min * shgfp shsrc FlagHK2 WB: AnticSrc Antiactin c FlagHK PP2 WB: g 2Deoxyglucose uptak ke Cpm μg min AntipcSrc Antiactin 2Deoxyglucose uptak ke Cpm μg min * PP2 PDGF WB: pcsrc Antiactin h 2Deoxyglucose uptak ke Cpm μg min PDGF shgfp shhk2 WB: AntiHK2 AntipcSrc Antiactin i 2Deoxyglucose upta ake Cpm μg min Flag HAHK WB: Antiβactin j 3 25 ke 2Deoxyglucose uptak Cpm μg min Flag HAHK2 WB: Antiβactin
9 Supplementary Figure 5. HK/HK2catalyzed glycolysis is stimulated by csrc. (a) HKpromoted glucose uptake was enhanced by overexpression of csrc. A549 cells were infected with lentiviruses expressing the proteins indicated. HKY732F was used as a negative control. (b) Introduction of WT HK, but not its Y732F mutant, rescued the attenuationn of hexokinase activity caused by knockdown of endogenous HK in A549 cells. (c) HKstimulated glucose uptake was abolished by exposure of A549 cells to PP2. (d) Glucose uptake stimulated by overexpression of HK was abrogated by knockdown of csrc in A549 cells. (e) HK2mediated glucose uptake was suppressed by PP2 in HeLa cells. (f) The stimulation of glycolysis gy y by HK2 in HeLa cells was attenuated by knockdown of csrc. (g) PDGFpromoted glucose uptake was inhibited by exposure of A549 cells to PP2. (h) PDGF stimulated glucose uptake in HeLa cells was diminished by knockdown of HK2. (i, j) Other four Src family members examined showed much weaker effect on HK (i) and HK2 (j) promoted glucose uptake compared to csrc. Results of each panel are means±s.d. (three experimental replicates). Unpaired student s t test was used to analyze the significance. p<., *p<..
10 a e level Relative lactate (fold).5.5 shgfp shhk rhk rhky732f * b Relative lactate level (fold).5.5 shgfp shhk2 rhk2 rhk2y686f * c Glc G6P F6P F,6BP G6P FBP DHAP [2 3 C] HK G6PD PFK E4P GAP GAP R5P/X5P S7P d tive Lactate oduction Relat pr Lactate from EM pathway Lactate from PP pathway HAcSrc FlagHK FlagHKY732F e te relative to r EM pathway Lactat vector shgfp shhk rhk rhky732f. Lactate from EM pathway Lactate from PP pathway Pyr Lac Lactate percentage in EMP and PPP f HAcSrc FlagHK FlagHKY732F h Oxygen con nsumption (fol ld) shgfp shhk rhk rhk Y732F 9 untreat oligomycin 2 rhky732f 4 C in Nucleic Acids shgfp shhk rhk rhky732f DNA RNA g Re elative ATP level (fold) shgfp shhk rhk rhky732f untreat oligomycin N.S.
11 Supplementary Figure 6. csrc augments glucose flux through both EMP and PPP. (a, b) Reexpression of wildtype HK, but not its mutant, rescued the lactate production in HeLa cells. (c) A schematic diagram indicates [2 3 C] glucose metabolic fates through EMP and PPP. 3 C atom is drawn as filled circles. The carbon atoms going through the EMP are labeled as black filled circles. The circles in red represent the 3 C atoms going through PPP and then recycled back to EMP. (d) Overexpressed HK rather than HKY732F efficiently increased lactate secretion through both EMP and PPP, and such an effect was enhanced by coexpression of csrc (upper panel). The corresponding percentages of glucose metabolized dth through hemp and PPP are shown in lower panel. HK, HKY732F and csrc were expressed by infecting HeLa cells with different combinations of lentiviruses as indicated. Lactate secretion was measured by NMR. (e) In HK knock down HeLa cells, the lactate production ratio from both EMP and PPP was downregulated and this effect was reversed by reexpression of WT HK, but not its mutant. (f) Disruption of HK expression by shrna influenced DNA/RNA synthesis. HeLa cells were treated with 6 4 C glucose for 24 hours, the incorporation ratio were determined according to the protocol in Methods. (g) Oligomycin treatment resulted in enhanced inhibition of ATP synthesis in HK knock down and HKY732F rescue HeLa cells compared with shgfp cells. (h) Rescue expression of HK, but not its mutant, reversed the increase of oxygen consumption caused by interference of HK. All the results represent means±s.d. of three independent experiments. Unpaired Student s t test was used to analyze the significance. p<., *p <.,.


12 a b FlagrHK2 FlagrHK2Y686F shhk2 WB: WB: AntipY732 AntiHK T N T N T N T N T N T N T N.3 Antiβactin * AntipcSrc AnticSrc Antiβactin d shhk2 rhk2 HKpY732 shhk2 rhk2y686f (g) Weight.2.. shhk2 rhk2 shhk2 rhk2y686f Colon primary adenocarcinoma and their matched normal tissue and metastatic adenocarcinoma c T T2 T3 T4 T5 T6 T7 T8 T9 T WB: AntipY732 AntiHK AntipcSrc AnticSrc Antiβactin e primary adenocarcinoma The intensity it of PY Y732 IHC staining 8 metastatic adenocarcinoma 6 2 f The intensity of PY73 2 IHC staining T 3 N M * T 3 N x M y X>, y> g HK HK csrc Growth factors RTK P csrc HK HK csrc P P glucose HK glucose6p glucose Glut ribose5p NADPH lactate Warburg Effect Nucleotide synthesis Tumorigenesis
13 Supplementary Figure 7. Phosphorylation of HKY732 is significantly correlated with csrc activity and tumor metastasis. (a) HK2Y686F impeded the xenograft tumor formation relative to WT HK2. The tumor lysates were detected with WB as indicated. The data were analyzed by employing twoway ANOVA (*p<.). (b) The activity of csrc is positively correlated to the phosphorylation of HK. The tumor lysates from patients suffered from breast cancer were detected with antibodies indicated. (c) Glioma lysates weree immunoblotted with the antibodies indicated. (d) IHC staining of a microarray containing primary colon adenocarcinomas and their matched normal tissues and metastatic adenocarcinomas with antipy73phosphorylation intensity of HK Y732 is much higher in metastatic colon adenocarcinoma tissues antibody. The scale bar is.5 mm. (e) The than in primary colon adenocarcinoma tissues. The slides quantifications were carried out with P software. Unpaired Student s t test was used to analyze the significance (p<., n=). (f) The phosphorylation intensity of HK Y732 is much higher in primary colon adenocarcinoma tissues with lymph node or distant metastasis than in primary colon adenocarcinoma tissues without any metastasis. t Unpaired Student s t t test t was used to analyze the significance ifi (*p<., n=7). This statistical result is from the IHC staining shown in Supplementary Fig. 7d. (g) A schematic diagram showing the mechanism how csrc activates HK. Upon the stimulation of growth factors, such as EGF, csrc is activated to form a transient protein complex with HK homodimer. In this complex, HK is promptly phosphorylated by csrc at Y732, which is essential for rapid liberation of HK from the complex. Librated HK exists in the form of phosphorylated monomer which shows maximum catalytic efficiency. After activation, HK increases s glucose metabolism through both EMP and PPP, which in turn provides enough ATP, ribose5p, NADPH and other intermediates required for biosynthesis of rapidly proliferating tumor cells.


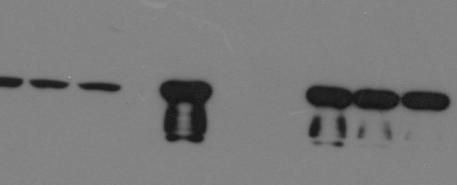
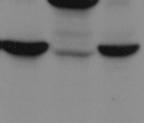
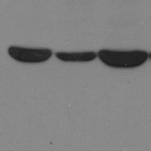
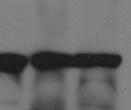
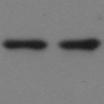
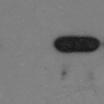
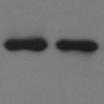
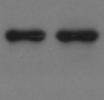
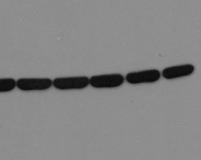
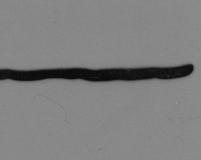
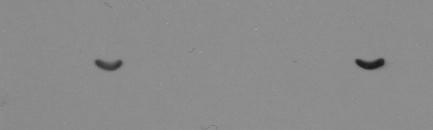
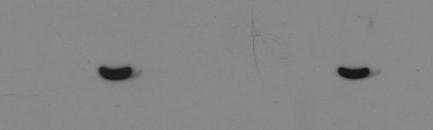
14 Figure a Figure b Figure c Co: Flag : Flag : HAcSrc 7 : FlagHK Co: HAcSrc : FlagHK : HAcSrc : HAcSrc Co: FlagHK : HAcSrc : FlagHK Figure d : HAcSrc Co: HK : HK 25 Figure e input input GST pull down GST pull down HisHK GSTcSrc : csrc : csrc IgG HisHKHK GSTcSrc 25 Supplementary Figure 8. Uncropped images of western blots analysis (Figure )


15 Figure 2a Figure 2b Figure 2c : HKpTyr : FlagHK : FlagHK : HAcSrc : HKpTyr : FlagHK : HAcSrc : FlagHK : HKpTyr : FlagHK : HAcSrc : FlagHK Figure 2d Figure 2e Figure 2f ptyr csrc HK : HKpTyr : HK : HK : csrc : βactin : HKpTyr : HK : HK : pcsrc : csrc Supplementary Figure 9. Uncropped images of western blots analysis (Figure 2) (continue)


16 Figure 4g Figure 4h Figure 4i : HKpTyr : FlagHK : HAcSrc : FlagHK HK/GSTcSrc HKpTyr : FlagHK : HKpY732 : HAcSrc : FlagHK Figure 4j Figure 4k Figure 4l Figure 4m HKpY732 HK GSTcSrc HKpY732 HK pcsrc csrc βactin HKpY732 HK pcsrc csrc βactin HKpY732 HK pcsrc csrc βactin Supplementary Figure 9. Uncropped images of western blots analysis (Figure 2)


17 Figure 4c Figure 4d Co: HAHK : FlagHK : HKpTyr : FlagHK : HAHK : HAcSrc Figure 4e : HAHK : FlagHK : HAcSrc HAHK Phostag FlagHK : FlagHK Co: HAHK : HAHK Co: HAHK : FlagHK : HAcSrc : FlagHK Figure 4g HAHK Phostag st 2nd FlagHK FlagHK MyccSrc HAHK Supplementary Figure. Uncropped images of western blots analysis (Figure 4)


18 Figure 8c HKpY732 HK pcsrc csrc βactin HKpY732 Figure 8d HK pcsrc csrc βactin Supplementary Figure. Uncropped images of western blots analysis (Figure 8)
Supplements. Figure S1. B Phalloidin Alexa488
 Supplements A, DMSO, PP2, PP3 Crk-myc Figure S1. (A) Src kinase activity is necessary for recruitment of Crk to Nephrin cytoplasmic domain. Human podocytes expressing /7-NephrinCD () were treated with
(A) SW480, DLD1, RKO and HCT116 cells were treated with DMSO or XAV939 (5 µm)
 SW480, DLD1, RKO and HCT116 cells were treated with DMSO or XAV939 (5 µm)") Supplementary Figure Legends Figure S1. Tankyrase inhibition suppresses cell proliferation in an axin/β-catenin independent manner. (A) SW480, DLD1, RKO and HCT116 cells were treated with DMSO or XAV939
Supplementary Figure Legends Figure S1. Tankyrase inhibition suppresses cell proliferation in an axin/β-catenin independent manner. (A) SW480, DLD1, RKO and HCT116 cells were treated with DMSO or XAV939
Nature Structural and Molecular Biology: doi: /nsmb Supplementary Figure 1
 Supplementary Figure 1 Mutational analysis of the SA2-Scc1 interaction in vitro and in human cells. (a) Autoradiograph (top) and Coomassie stained gel (bottom) of 35 S-labeled Myc-SA2 proteins (input)
(a) Significant biological processes (upper panel) and disease biomarkers (lower panel)
 Significant biological processes (upper panel) and disease biomarkers (lower panel)") Supplementary Figure 1. Functional enrichment analyses of secretomic proteins. (a) Significant biological processes (upper panel) and disease biomarkers (lower panel) 2 involved by hrab37-mediated secretory
Supplementary Figure 1. Functional enrichment analyses of secretomic proteins. (a) Significant biological processes (upper panel) and disease biomarkers (lower panel) 2 involved by hrab37-mediated secretory
Supplementary Figure 1. Normal T lymphocyte populations in Dapk -/- mice. (a) Normal thymic development in Dapk -/- mice. Thymocytes from WT and Dapk
 Normal thymic development in Dapk -/- mice. Thymocytes from WT and Dapk") Supplementary Figure 1. Normal T lymphocyte populations in Dapk -/- mice. (a) Normal thymic development in Dapk -/- mice. Thymocytes from WT and Dapk -/- mice were stained for expression of CD4 and CD8.
Supplementary Figure 1. Normal T lymphocyte populations in Dapk -/- mice. (a) Normal thymic development in Dapk -/- mice. Thymocytes from WT and Dapk -/- mice were stained for expression of CD4 and CD8.
SUPPLEMENTARY INFORMATION
 doi:10.1038/nature12652 Supplementary Figure 1. PRDM16 interacts with endogenous EHMT1 in brown adipocytes. Immunoprecipitation of PRDM16 complex by flag antibody (M2) followed by Western blot analysis
(a) Schematic diagram of the FS mutation of UVRAG in exon 8 containing the highly instable
 Schematic diagram of the FS mutation of UVRAG in exon 8 containing the highly instable") Supplementary Figure 1. Frameshift (FS) mutation in UVRAG. (a) Schematic diagram of the FS mutation of UVRAG in exon 8 containing the highly instable A 10 DNA repeat, generating a premature stop codon
Supplementary Figure 1. Frameshift (FS) mutation in UVRAG. (a) Schematic diagram of the FS mutation of UVRAG in exon 8 containing the highly instable A 10 DNA repeat, generating a premature stop codon
Supplementary Figure S1 Supplementary Figure S2
 Supplementary Figure S A) The blots shown in Figure B were qualified by using Gel-Pro analyzer software (Rockville, MD, USA). The ratio of LC3II/LC3I to actin was then calculated. The data are represented
Supplementary Figure 1.TRIM33 binds β-catenin in the nucleus. a & b, Co-IP of endogenous TRIM33 with β-catenin in HT-29 cells (a) and HEK 293T cells
 and HEK 293T cells") Supplementary Figure 1.TRIM33 binds β-catenin in the nucleus. a & b, Co-IP of endogenous TRIM33 with β-catenin in HT-29 cells (a) and HEK 293T cells (b). TRIM33 was immunoprecipitated, and the amount of
Supplementary Figure 1.TRIM33 binds β-catenin in the nucleus. a & b, Co-IP of endogenous TRIM33 with β-catenin in HT-29 cells (a) and HEK 293T cells (b). TRIM33 was immunoprecipitated, and the amount of
T H E J O U R N A L O F C E L L B I O L O G Y
 T H E J O U R N A L O F C E L L B I O L O G Y Supplemental material Krenn et al., http://www.jcb.org/cgi/content/full/jcb.201110013/dc1 Figure S1. Levels of expressed proteins and demonstration that C-terminal
Supplementary Figure 1. PD-L1 is glycosylated in cancer cells. (a) Western blot analysis of PD-L1 in breast cancer cells. (b) Western blot analysis
 Western blot analysis of PD-L1 in breast cancer cells. (b) Western blot analysis") Supplementary Figure 1. PD-L1 is glycosylated in cancer cells. (a) Western blot analysis of PD-L1 in breast cancer cells. (b) Western blot analysis of PD-L1 in ovarian cancer cells. (c) Western blot analysis
Supplementary Figure 1. PD-L1 is glycosylated in cancer cells. (a) Western blot analysis of PD-L1 in breast cancer cells. (b) Western blot analysis of PD-L1 in ovarian cancer cells. (c) Western blot analysis
William C. Comb, Jessica E. Hutti, Patricia Cogswell, Lewis C. Cantley, and Albert S. Baldwin
 Molecular Cell, Volume 45 Supplemental Information p85 SH2 Domain Phosphorylation by IKK Promotes Feedback Inhibition of PI3K and Akt in Response to Cellular Starvation William C. Comb, Jessica E. Hutti,
Supplementary Materials for
 www.sciencesignaling.org/cgi/content/full/6/283/ra57/dc1 Supplementary Materials for JNK3 Couples the Neuronal Stress Response to Inhibition of Secretory Trafficking Guang Yang,* Xun Zhou, Jingyan Zhu,
SUPPLEMENTARY INFORMATION
 SUPPLEMENTARY INFORMATION doi:10.1038/nature11429 S1a 6 7 8 9 Nlrc4 allele S1b Nlrc4 +/+ Nlrc4 +/F Nlrc4 F/F 9 Targeting construct 422 bp 273 bp FRT-neo-gb-PGK-FRT 3x.STOP S1c Nlrc4 +/+ Nlrc4 F/F casp1
SUPPLEMENTAL FIGURE LEGENDS
 SUPPLEMENTAL FIGURE LEGENDS Supplemental Figure S1: Endogenous interaction between RNF2 and H2AX: Whole cell extracts from 293T were subjected to immunoprecipitation with anti-rnf2 or anti-γ-h2ax antibodies
Supplementary Figure 1
 Supplementary Figure 1 a γ-h2ax MDC1 RNF8 FK2 BRCA1 U2OS Cells sgrna-1 ** 60 sgrna 40 20 0 % positive Cells (>5 foci per cell) b ** 80 sgrna sgrna γ-h2ax MDC1 γ-h2ax RNF8 FK2 MDC1 BRCA1 RNF8 FK2 BRCA1
SUPPLEMENTARY INFORMATION
 doi:10.1038/nature11700 Figure 1: RIP3 as a potential Sirt2 interacting protein. Transfected Flag-tagged Sirt2 was immunoprecipitated from cells and eluted from the Sepharose beads using Flag peptide.
Phospho-AKT Sampler Kit
 Phospho-AKT Sampler Kit E 0 5 1 0 0 3 Kits Includes Cat. Quantity Application Reactivity Source Akt (Ab-473) Antibody E021054-1 50μg/50μl IHC, WB Human, Mouse, Rat Rabbit Akt (Phospho-Ser473) Antibody
Supplementary Fig. S1. Schematic diagram of minigenome segments.
 open reading frame 1565 (segment 5) 47 (-) 3 5 (+) 76 101 125 149 173 197 221 246 287 open reading frame 890 (segment 8) 60 (-) 3 5 (+) 172 Supplementary Fig. S1. Schematic diagram of minigenome segments.
Supplementary Figure 1. Confocal immunofluorescence showing mitochondrial translocation of Drp1. Cardiomyocytes treated with H 2 O 2 were prestained
 Supplementary Figure 1. Confocal immunofluorescence showing mitochondrial translocation of Drp1. Cardiomyocytes treated with H 2 O 2 were prestained with MitoTracker (red), then were immunostained with
Supplementary Figure 1. Characterization of NMuMG-ErbB2 and NIC breast cancer cells expressing shrnas targeting LPP. NMuMG-ErbB2 cells (a) and NIC
 and NIC") Supplementary Figure 1. Characterization of NMuMG-ErbB2 and NIC breast cancer cells expressing shrnas targeting LPP. NMuMG-ErbB2 cells (a) and NIC cells (b) were engineered to stably express either a LucA-shRNA
Supplementary Figure 1. Characterization of NMuMG-ErbB2 and NIC breast cancer cells expressing shrnas targeting LPP. NMuMG-ErbB2 cells (a) and NIC cells (b) were engineered to stably express either a LucA-shRNA
Evidence for an Alternative Glycolytic Pathway in Rapidly Proliferating Cells. Matthew G. Vander Heiden, et al. Science 2010
 Evidence for an Alternative Glycolytic Pathway in Rapidly Proliferating Cells Matthew G. Vander Heiden, et al. Science 2010 Introduction The Warburg Effect Cancer cells metabolize glucose differently Primarily
SUPPLEMENTARY INFORMATION
 DOI: 1.138/ncb222 / b. WB anti- WB anti- ulin Mitotic index (%) 14 1 6 2 T (h) 32 48-1 1 2 3 4 6-1 4 16 22 28 3 33 e. 6 4 2 Time (min) 1-6- 11-1 > 1 % cells Figure S1 depletion leads to mitotic defects
Expanded View Figures
 MO reports PR3 dephosphorylates TZ Xian-o Lv et al xpanded View igures igure V1. PR3 dephosphorylates and inactivates YP/TZ., Overexpression of tight junction proteins Pals1 () or LIN7 () has no effect
Nature Immunology doi: /ni.3268
 Supplementary Figure 1 Loss of Mst1 and Mst2 increases susceptibility to bacterial sepsis. (a) H&E staining of colon and kidney sections from wild type and Mst1 -/- Mst2 fl/fl Vav-Cre mice. Scale bar,
SUPPLEMENTARY INFORMATION
 Supplementary Figures Supplementary Figure S1. Binding of full-length OGT and deletion mutants to PIP strips (Echelon Biosciences). Supplementary Figure S2. Binding of the OGT (919-1036) fragments with
RAW264.7 cells stably expressing control shrna (Con) or GSK3b-specific shrna (sh-
 or GSK3b-specific shrna (sh-") 1 a b Supplementary Figure 1. Effects of GSK3b knockdown on poly I:C-induced cytokine production. RAW264.7 cells stably expressing control shrna (Con) or GSK3b-specific shrna (sh- GSK3b) were stimulated
1 a b Supplementary Figure 1. Effects of GSK3b knockdown on poly I:C-induced cytokine production. RAW264.7 cells stably expressing control shrna (Con) or GSK3b-specific shrna (sh- GSK3b) were stimulated
Supplemental Figure 1
 1 Supplemental Figure 1 Effects of DATE shortening on HGF promoter activity. The HGF promoter region (-1037 to +56) containing wild-type (30As) or truncated DATE (26As, 27As, 28A, 29As) from breast cancer
Nature Immunology: doi: /ni.3866
 Nature Immunology: doi:10.1038/ni.3866 Supplementary Figure 1 The effect of TIPE2 on chemotaxis. a, The expression of TIPE2 in dhl-60c, dhl-60t, TIPE2-expressing and 15/16Q-expressing dhl-60t neutrophils
Supplementary information. MARCH8 inhibits HIV-1 infection by reducing virion incorporation of envelope glycoproteins
 Supplementary information inhibits HIV-1 infection by reducing virion incorporation of envelope glycoproteins Takuya Tada, Yanzhao Zhang, Takayoshi Koyama, Minoru Tobiume, Yasuko Tsunetsugu-Yokota, Shoji
Supplementary Figure 1. The CagA-dependent wound healing or transwell migration of gastric cancer cell. AGS cells transfected with vector control or
 Supplementary Figure 1. The CagA-dependent wound healing or transwell migration of gastric cancer cell. AGS cells transfected with vector control or 3xflag-CagA expression vector were wounded using a pipette
p = formed with HCI-001 p = Relative # of blood vessels that formed with HCI-002 Control Bevacizumab + 17AAG Bevacizumab 17AAG
 A.. Relative # of ECs associated with HCI-001 1.4 1.2 1.0 0.8 0.6 0.4 0.2 0.0 ol b p < 0.001 Relative # of blood vessels that formed with HCI-001 1.4 1.2 1.0 0.8 0.6 0.4 0.2 0.0 l b p = 0.002 Control IHC:
Predictive PP1Ca binding region in BIG3 : 1,228 1,232aa (-KAVSF-) HEK293T cells *** *** *** KPL-3C cells - E E2 treatment time (h)
 HEK293T cells *** *** *** KPL-3C cells - E E2 treatment time (h)") Relative expression ERE-luciferase activity activity (pmole/min) activity (pmole/min) activity (pmole/min) activity (pmole/min) MCF-7 KPL-3C ZR--1 BT-474 T47D HCC15 KPL-1 HBC4 activity (pmole/min) a d
Relative expression ERE-luciferase activity activity (pmole/min) activity (pmole/min) activity (pmole/min) activity (pmole/min) MCF-7 KPL-3C ZR--1 BT-474 T47D HCC15 KPL-1 HBC4 activity (pmole/min) a d
Supplementary Figure 1: si-craf but not si-braf sensitizes tumor cells to radiation.
 Supplementary Figure 1: si-craf but not si-braf sensitizes tumor cells to radiation. (a) Embryonic fibroblasts isolated from wildtype (WT), BRAF -/-, or CRAF -/- mice were irradiated (6 Gy) and DNA damage
SUPPLEMENTARY INFORMATION
 DOI: 10.1038/ncb2566 Figure S1 CDKL5 protein expression pattern and localization in mouse brain. (a) Multiple-tissue western blot from a postnatal day (P) 21 mouse probed with an antibody against CDKL5.
Supplementary Information
 Supplementary Information mediates STAT3 activation at retromer-positive structures to promote colitis and colitis-associated carcinogenesis Zhang et al. a b d e g h Rel. Luc. Act. Rel. mrna Rel. mrna
SUPPLEMENTARY INFORMATION
 Supplementary Table 1. Cell sphingolipids and S1P bound to endogenous TRAF2. Sphingolipid Cell pmol/mg TRAF2 immunoprecipitate pmol/mg Sphingomyelin 4200 ± 250 Not detected Monohexosylceramide 311 ± 18
**! Yuan et al., Supplemental Figure 1, related to Figure 1! EYA2 modulates the transcriptional activity of ERb, but not ERa! -DPN! +DPN!
 Yuan et al., Supplemental Figure 1, related to Figure 1! EY2 modulates the transcriptional activity of ERb, but not ERa!! B! -DPN! +DPN! * ERb GPDH MCF7 MD-MB-231 Primary BC - KD - KD #1 #2 #3 Relative
Incorporation of photo-caged lysine (pc-lys) at K273 of human LCK allows specific control of the enzyme activity.
 at K273 of human LCK allows specific control of the enzyme activity.") Supplementary Figure 1 Incorporation of photo-caged lysine (pc-lys) at K273 of human LCK allows specific control of the enzyme activity. (a) Modeling of the kinase domain of LCK with ATP (left) or pc-lys
Supplementary Figure 1 Incorporation of photo-caged lysine (pc-lys) at K273 of human LCK allows specific control of the enzyme activity. (a) Modeling of the kinase domain of LCK with ATP (left) or pc-lys
The unique N-terminal region of SRMS regulates enzymatic activity and phosphorylation of its novel substrate docking protein 1
 The unique N-terminal region of SRMS regulates enzymatic activity and phosphorylation of its novel substrate docking protein 1 Raghuveera K. Goel, Sayem Miah, Kristin Black, Natasha Kalra, Chenlu Dai and
Supplementary Figure 1. MAT IIα is Acetylated at Lysine 81.
 IP: Flag a Mascot PTM Modified Mass Error Position Gene Names Score Score Sequence m/z [ppm] 81 MAT2A;AMS2;MATA2 35.6 137.28 _AAVDYQK(ac)VVR_ 595.83-2.28 b Pre-immu After-immu Flag- WT K81R WT K81R / Flag
Supplementary Appendix
 Supplementary Appendix This appendix has been provided by the authors to give readers additional information about their work. Supplement to: Choi YL, Soda M, Yamashita Y, et al. EML4-ALK mutations in
Supplementary Materials for
 www.sciencesignaling.org/cgi/content/full/10/471/eaah5085/dc1 Supplementary Materials for Phosphorylation of the exocyst protein Exo84 by TBK1 promotes insulin-stimulated GLUT4 trafficking Maeran Uhm,
Dramatic increase in SHP2 binding activity of Helicobacter. pylori Western CagA by EPIYA-C duplication: its
 Supplementary Information Dramatic increase in SHP2 binding activity of Helicobacter pylori Western CagA by EPIYA-C duplication: its implications in gastric carcinogenesis Lisa Nagase, Takeru Hayashi,
SUPPLEMENTARY INFORMATION
 Supplementary Discussion The cell cycle machinery and the DNA damage response network are highly interconnected and co-regulated in assuring faithful duplication and partition of genetic materials into
Supplementary Figure 1. HOPX is hypermethylated in NPC. (a) Methylation levels of HOPX in Normal (n = 24) and NPC (n = 24) tissues from the
 Methylation levels of HOPX in Normal (n = 24) and NPC (n = 24) tissues from the") Supplementary Figure 1. HOPX is hypermethylated in NPC. (a) Methylation levels of HOPX in Normal (n = 24) and NPC (n = 24) tissues from the genome-wide methylation microarray data. Mean ± s.d.; Student
Supplementary Figure 1. HOPX is hypermethylated in NPC. (a) Methylation levels of HOPX in Normal (n = 24) and NPC (n = 24) tissues from the genome-wide methylation microarray data. Mean ± s.d.; Student
supplementary information
 DOI: 10.1038/ncb2153 Figure S1 Ectopic expression of HAUSP up-regulates REST protein. (a) Immunoblotting showed that ectopic expression of HAUSP increased REST protein levels in ENStemA NPCs. (b) Immunofluorescent
SUPPLEMENTARY INFORMATION
 DOI:.38/ncb2822 a MTC02 FAO cells EEA1 b +/+ MEFs /DAPI -/- MEFs /DAPI -/- MEFs //DAPI c HEK 293 cells WCE N M C P AKT TBC1D7 Lamin A/C EEA1 VDAC d HeLa cells WCE N M C P AKT Lamin A/C EEA1 VDAC Figure
S1a S1b S1c. S1d. S1f S1g S1h SUPPLEMENTARY FIGURE 1. - si sc Il17rd Il17ra bp. rig/s IL-17RD (ng) -100 IL-17RD
 -100 IL-17RD") SUPPLEMENTARY FIGURE 1 0 20 50 80 100 IL-17RD (ng) S1a S1b S1c IL-17RD β-actin kda S1d - si sc Il17rd Il17ra rig/s15-574 - 458-361 bp S1f S1g S1h S1i S1j Supplementary Figure 1. Knockdown of IL-17RD enhances
SUPPLEMENTARY FIGURE 1 0 20 50 80 100 IL-17RD (ng) S1a S1b S1c IL-17RD β-actin kda S1d - si sc Il17rd Il17ra rig/s15-574 - 458-361 bp S1f S1g S1h S1i S1j Supplementary Figure 1. Knockdown of IL-17RD enhances
Part-4. Cell cycle regulatory protein 5 (Cdk5) A novel target of ERK in Carb induced cell death
 A novel target of ERK in Carb induced cell death") Part-4 Cell cycle regulatory protein 5 (Cdk5) A novel target of ERK in Carb induced cell death 95 1. Introduction The process of replicating DNA and dividing cells can be described as a series of coordinated
Part-4 Cell cycle regulatory protein 5 (Cdk5) A novel target of ERK in Carb induced cell death 95 1. Introduction The process of replicating DNA and dividing cells can be described as a series of coordinated
Expanded View Figures
 Shao-Ming Shen et al Role of I in MT of cancers MO reports xpanded View igures igure V1. nalysis of the expression of I isoforms in cancer cells and their interaction with PTN. RT PR detection of Ish and
SUPPLEMENTARY FIGURES AND TABLE
 SUPPLEMENTARY FIGURES AND TABLE Supplementary Figure S1: Characterization of IRE1α mutants. A. U87-LUC cells were transduced with the lentiviral vector containing the GFP sequence (U87-LUC Tet-ON GFP).
Kidney. Heart. Lung. Sirt1. Gapdh. Mouse IgG DAPI. Rabbit IgG DAPI
 a e Na V 1.5 Ad-LacZ Ad- 110KD b Scn5a/ (relative to Ad-LacZ) f 150 100 50 0 p = 0.65 Ad-LacZ Ad- c Heart Lung Kidney Spleen 110KD d fl/fl c -/- DAPI 20 µm Na v 1.5 250KD fl/fl Rabbit IgG DAPI fl/fl Mouse
Supplementary Information Supplementary Fig. 1. Elevated Usp9x in melanoma and NRAS mutant melanoma cells are dependent on NRAS for 3D growth.
 Supplementary Information Supplementary Fig. 1. Elevated Usp9x in melanoma and NRAS mutant melanoma cells are dependent on NRAS for 3D growth. a. Immunoblot for Usp9x protein in NRAS mutant melanoma cells
Supplementary Figure 1
 Supplementary Figure 1 Supplementary Figure 1 Schematic depiction of the tandem Fc GDF15. Supplementary Figure 2 Supplementary Figure 2 Gfral mrna levels in the brains of both wild-type and knockout Gfral
T H E J O U R N A L O F C E L L B I O L O G Y
 Supplemental material Chairoungdua et al., http://www.jcb.org/cgi/content/full/jcb.201002049/dc1 T H E J O U R N A L O F C E L L B I O L O G Y Figure S1. Expression of CD9 and CD82 inhibits Wnt/ -catenin
A. Generation and characterization of Ras-expressing autophagycompetent
 Supplemental Material Supplemental Figure Legends Fig. S1 A. Generation and characterization of Ras-expressing autophagycompetent and -deficient cell lines. HA-tagged H-ras V12 was stably expressed in
m 6 A mrna methylation regulates AKT activity to promote the proliferation and tumorigenicity of endometrial cancer
 SUPPLEMENTARY INFORMATION Articles https://doi.org/10.1038/s41556-018-0174-4 In the format provided by the authors and unedited. m 6 A mrna methylation regulates AKT activity to promote the proliferation
Supplementary Figure 1
 Supplementary Figure 1 Constitutive EGFR signaling does not activate canonical EGFR signals (a) U251EGFRInd cells with or without tetracycline exposure (24h, 1µg/ml) were treated with EGF for 15 minutes
Supplementary Figure 1 Induction of cellular senescence and isolation of exosome. a to c, Pre-senescent primary normal human diploid fibroblasts
 Supplementary Figure 1 Induction of cellular senescence and isolation of exosome. a to c, Pre-senescent primary normal human diploid fibroblasts (TIG-3 cells) were rendered senescent by either serial passage
Infect MCF-7 cells carrying dcas9-vp64 + psm2-p65-hsf1 with SAM library or vector. Introduce AKT reporter
 Infect MCF-7 cells carrying dcas9-vp64 + psm2-p65-hsf1 with SM library or vector Introduce reporter Grow cells in presence of puromycin for 5 days Vector control SM library fewer surviving cells More surviving
Supplemental Information. NRF2 Is a Major Target of ARF. in p53-independent Tumor Suppression
 Molecular Cell, Volume 68 Supplemental Information NRF2 Is a Major Target of ARF in p53-independent Tumor Suppression Delin Chen, Omid Tavana, Bo Chu, Luke Erber, Yue Chen, Richard Baer, and Wei Gu Figure
effects on organ development. a-f, Eye and wing discs with clones of ε j2b10 show no
 Supplementary Figure 1. Loss of function clones of 14-3-3 or 14-3-3 show no significant effects on organ development. a-f, Eye and wing discs with clones of 14-3-3ε j2b10 show no obvious defects in Elav
hexahistidine tagged GRP78 devoid of the KDEL motif (GRP78-His) on SDS-PAGE. This
 on SDS-PAGE. This") SUPPLEMENTAL FIGURE LEGEND Fig. S1. Generation and characterization of. (A) Coomassie staining of soluble hexahistidine tagged GRP78 devoid of the KDEL motif (GRP78-His) on SDS-PAGE. This protein was expressed
SUPPLEMENTAL FIGURE LEGEND Fig. S1. Generation and characterization of. (A) Coomassie staining of soluble hexahistidine tagged GRP78 devoid of the KDEL motif (GRP78-His) on SDS-PAGE. This protein was expressed
Supplementary Figure 1. SC35M polymerase activity in the presence of Bat or SC35M NP encoded from the phw2000 rescue plasmid.
 1 2 3 4 5 6 7 8 9 10 11 12 13 14 15 16 17 18 19 20 21 22 23 24 25 26 27 Supplementary Figure 1. SC35M polymerase activity in the presence of Bat or SC35M NP encoded from the phw2000 rescue plasmid. HEK293T
p.r623c p.p976l p.d2847fs p.t2671 p.d2847fs p.r2922w p.r2370h p.c1201y p.a868v p.s952* RING_C BP PHD Cbp HAT_KAT11
 ARID2 p.r623c KMT2D p.v650fs p.p976l p.r2922w p.l1212r p.d1400h DNA binding RFX DNA binding Zinc finger KMT2C p.a51s p.d372v p.c1103* p.d2847fs p.t2671 p.d2847fs p.r4586h PHD/ RING DHHC/ PHD PHD FYR N
SUPPLEMENTARY INFORMATION
 SUPPLEMENTARY INFORMATION doi:1.138/nature9814 a A SHARPIN FL B SHARPIN ΔNZF C SHARPIN T38L, F39V b His-SHARPIN FL -1xUb -2xUb -4xUb α-his c Linear 4xUb -SHARPIN FL -SHARPIN TF_LV -SHARPINΔNZF -SHARPIN
The clathrin adaptor Numb regulates intestinal cholesterol. absorption through dynamic interaction with NPC1L1
 The clathrin adaptor Numb regulates intestinal cholesterol absorption through dynamic interaction with NPC1L1 Pei-Shan Li 1, Zhen-Yan Fu 1,2, Ying-Yu Zhang 1, Jin-Hui Zhang 1, Chen-Qi Xu 1, Yi-Tong Ma
TRAF6 ubiquitinates TGFβ type I receptor to promote its cleavage and nuclear translocation in cancer
 Supplementary Information TRAF6 ubiquitinates TGFβ type I receptor to promote its cleavage and nuclear translocation in cancer Yabing Mu, Reshma Sundar, Noopur Thakur, Maria Ekman, Shyam Kumar Gudey, Mariya
Supplemental Information. Lck/Hck/Fgr-Mediated Tyrosine. Phosphorylation Negatively Regulates. TBK1 to Restrain Innate Antiviral Responses
 Cell Host & Microbe, Volume 21 Supplemental Information Lck/Hck/FgrMediated Tyrosine Phosphorylation Negatively Regulates to Restrain Innate Antiviral Responses Shengduo Liu, Shasha Chen, Xinran Li, Shiying
Supplementary Fig. 1. GPRC5A post-transcriptionally down-regulates EGFR expression. (a) Plot of the changes in steady state mrna levels versus
 Plot of the changes in steady state mrna levels versus") Supplementary Fig. 1. GPRC5A post-transcriptionally down-regulates EGFR expression. (a) Plot of the changes in steady state mrna levels versus changes in corresponding proteins between wild type and Gprc5a-/-
Supplementary Fig. 1. GPRC5A post-transcriptionally down-regulates EGFR expression. (a) Plot of the changes in steady state mrna levels versus changes in corresponding proteins between wild type and Gprc5a-/-
SUPPLEMENTARY FIGURES
 SUPPLEMENTARY FIGURES Supplementary Figure 1. (A) Left, western blot analysis of ISGylated proteins in Jurkat T cells treated with 1000U ml -1 IFN for 16h (IFN) or left untreated (CONT); right, western
Supplementary Materials for
 www.sciencesignaling.org/cgi/content/full/8/364/ra18/dc1 Supplementary Materials for The tyrosine phosphatase (Pez) inhibits metastasis by altering protein trafficking Leila Belle, Naveid Ali, Ana Lonic,
SUPPLEMENTARY FIGURES
 SUPPLEMENTARY FIGURES Supplementary Figure S1: Fibroblast-induced elongation of cancer cells requires direct contact with living fibroblasts. A. Representative images of HT29-GFP cultured in the presence
Trim29 gene-targeting strategy. (a) Genotyping of wildtype mice (+/+), Trim29 heterozygous mice (+/ ) and homozygous mice ( / ).
 Genotyping of wildtype mice (+/+), Trim29 heterozygous mice (+/ ) and homozygous mice ( / ).") Supplementary Figure 1 Trim29 gene-targeting strategy. (a) Genotyping of wildtype mice (+/+), Trim29 heterozygous mice (+/ ) and homozygous mice ( / ). (b) Immunoblot analysis of TRIM29 in lung primary
Supplementary Figure 1 Trim29 gene-targeting strategy. (a) Genotyping of wildtype mice (+/+), Trim29 heterozygous mice (+/ ) and homozygous mice ( / ). (b) Immunoblot analysis of TRIM29 in lung primary
Growth and Differentiation Phosphorylation Sampler Kit
 Growth and Differentiation Phosphorylation Sampler Kit E 0 5 1 0 1 4 Kits Includes Cat. Quantity Application Reactivity Source Akt (Phospho-Ser473) E011054-1 50μg/50μl IHC, WB Human, Mouse, Rat Rabbit
supplementary information
 Figure S1 Nucleotide binding status of RagA mutants. Wild type and mutant forms of MycRagA was transfected into HEK293 cells and the transfected cells were labeled with 32 Pphosphate. MycRagA was immunoprecipitated
SUPPLEMENTAL EXPERIMENTAL PROCEDURES
 SUPPLEMENTAL EXPERIMENTAL PROCEDURES Crystal violet assay Cells were seeded in 24-well plates and cultured in media supplemented with % FBS for 7 days. Media were then removed, plates were briefly washed
SUPPLEMENTARY INFORMATION
 DOI: 10.1038/ncb2607 Figure S1 Elf5 loss promotes EMT in mammary epithelium while Elf5 overexpression inhibits TGFβ induced EMT. (a, c) Different confocal slices through the Z stack image. (b, d) 3D rendering
Supplementary Figures
 Supplementary Figures Supplementary Figure 1 DOT1L regulates the expression of epithelial and mesenchymal markers. (a) The expression levels and cellular localizations of EMT markers were confirmed by
A. List of selected proteins with high SILAC (H/L) ratios identified in mass
 ratios identified in mass") Supplementary material Figure S1. Interaction between UBL5 and FANCI A. List of selected proteins with high SILAC (H/L) ratios identified in mass spectrometry (MS)-based analysis of UBL5-interacting proteins,
Supplementary material Figure S1. Interaction between UBL5 and FANCI A. List of selected proteins with high SILAC (H/L) ratios identified in mass spectrometry (MS)-based analysis of UBL5-interacting proteins,
SUPPLEMENTARY INFORMATION
 doi:10.1038/nature10962 Supplementary Figure 1. Expression of AvrAC-FLAG in protoplasts. Total protein extracted from protoplasts described in Fig. 1a was subjected to anti-flag immunoblot to detect AvrAC-FLAG
Tumor stage : I II III IV. well differentiated. moderately differentiated. adenocarcinoma. normal colon (adjacent to cancer) Log (T/H) SLAP mrna level
 Log (T/H) SLAP mrna level") moderately differentiated well differentiated Log (T/H) mrna level a Tumor stage : I II III IV.4.4.8 1.2 1.6 2. 2.4 2.8 3.2 N 1 2 3 4 5 6 7 8 9 1 11 12 13 14 15 16 17 # patient b normal colon (adjacent
moderately differentiated well differentiated Log (T/H) mrna level a Tumor stage : I II III IV.4.4.8 1.2 1.6 2. 2.4 2.8 3.2 N 1 2 3 4 5 6 7 8 9 1 11 12 13 14 15 16 17 # patient b normal colon (adjacent
Supplementary Materials for. c-abl Activation Plays a Role in α-synucleinopathy Induced Neurodegeneration
 Supplementary Materials for c-abl Activation Plays a Role in α-synucleinopathy Induced Neurodegeneration Saurav Brahmachari, Preston Ge, Su Hyun Lee, Donghoon Kim, Senthilkumar S. Karuppagounder, Manoj
Supplementary Figure 1
 Supplementary Figure 1 YAP negatively regulates IFN- signaling. (a) Immunoblot analysis of Yap knockdown efficiency with sh-yap (#1 to #4 independent constructs) in Raw264.7 cells. (b) IFN- -Luc and PRDs
A Hepatocyte Growth Factor Receptor (Met) Insulin Receptor hybrid governs hepatic glucose metabolism SUPPLEMENTARY FIGURES, LEGENDS AND METHODS
 Insulin Receptor hybrid governs hepatic glucose metabolism SUPPLEMENTARY FIGURES, LEGENDS AND METHODS") A Hepatocyte Growth Factor Receptor (Met) Insulin Receptor hybrid governs hepatic glucose metabolism Arlee Fafalios, Jihong Ma, Xinping Tan, John Stoops, Jianhua Luo, Marie C. DeFrances and Reza Zarnegar
A Hepatocyte Growth Factor Receptor (Met) Insulin Receptor hybrid governs hepatic glucose metabolism Arlee Fafalios, Jihong Ma, Xinping Tan, John Stoops, Jianhua Luo, Marie C. DeFrances and Reza Zarnegar
Supplementary Materials for
 www.sciencesignaling.org/cgi/content/full/9/439/ra78/dc1 Supplementary Materials for Small heterodimer partner mediates liver X receptor (LXR) dependent suppression of inflammatory signaling by promoting
Figure S1. (A) SDS-PAGE separation of GST-fusion proteins purified from E.coli BL21 strain is shown. An equal amount of GST-tag control, LRRK2 LRR
 SDS-PAGE separation of GST-fusion proteins purified from E.coli BL21 strain is shown. An equal amount of GST-tag control, LRRK2 LRR") Figure S1. (A) SDS-PAGE separation of GST-fusion proteins purified from E.coli BL21 strain is shown. An equal amount of GST-tag control, LRRK2 LRR and LRRK2 WD40 GST fusion proteins (5 µg) were loaded
Figure S1. (A) SDS-PAGE separation of GST-fusion proteins purified from E.coli BL21 strain is shown. An equal amount of GST-tag control, LRRK2 LRR and LRRK2 WD40 GST fusion proteins (5 µg) were loaded
Supporting Information. FADD regulates NF-кB activation and promotes ubiquitination of cflip L to induce. apoptosis
 1 2 Supporting Information 3 4 5 FADD regulates NF-кB activation and promotes ubiquitination of cflip L to induce apoptosis 6 7 Kishu Ranjan and Chandramani Pathak* 8 9 Department of Cell Biology, School
Supplementary Materials
 Supplementary Materials Figure S1. MTT Cell viability assay. To measure the cytotoxic potential of the oxidative treatment, the MTT [3-(4,5-dimethylthiazol- 2-yl)-2,5-diphenyl tetrazolium bromide] assay
Supplementary Figure S1. Venn diagram analysis of mrna microarray data and mirna target analysis. (a) Western blot analysis of T lymphoblasts (CLS)
 Western blot analysis of T lymphoblasts (CLS)") Supplementary Figure S1. Venn diagram analysis of mrna microarray data and mirna target analysis. (a) Western blot analysis of T lymphoblasts (CLS) and their exosomes (EXO) in resting (REST) and activated
Supplementary Figure S1. Venn diagram analysis of mrna microarray data and mirna target analysis. (a) Western blot analysis of T lymphoblasts (CLS) and their exosomes (EXO) in resting (REST) and activated
Supplementary figure legends
 Supplementary figure legends Supplementary Figure 1. Exposure of CRT occurs independently from the apoptosisassociated loss of the mitochondrial membrane potential (MMP). (A) HeLa cells treated with MTX
Nature Medicine: doi: /nm.4322
 1 2 3 4 5 6 7 8 9 10 11 Supplementary Figure 1. Predicted RNA structure of 3 UTR and sequence alignment of deleted nucleotides. (a) Predicted RNA secondary structure of ZIKV 3 UTR. The stem-loop structure
293T cells were transfected with indicated expression vectors and the whole-cell extracts were subjected
 SUPPLEMENTARY INFORMATION Supplementary Figure 1. Formation of a complex between Slo1 and CRL4A CRBN E3 ligase. (a) HEK 293T cells were transfected with indicated expression vectors and the whole-cell
Type of file: PDF Title of file for HTML: Supplementary Information Description: Supplementary Figures
 Type of file: PDF Title of file for HTML: Supplementary Information Description: Supplementary Figures Type of file: MOV Title of file for HTML: Supplementary Movie 1 Description: NLRP3 is moving along
Supplementary Figure 1 Maschalidi et al.
 a 1% 5% % 1% 5% % OVAb βgal activity A.U. (x1 4 ) 2 1 5 βgal activity A.U. (x1 4 ) 2 1 BSAb 2 hours 4 hours OVAb BSAb OVAb BSAb,1 1 1 1 SIINFEKL (ng/ml) CFSE b Beads Alexa488 (%) 8 6 4 2 ** ** 1:1 5:1
SUPPLEMENTARY INFORMATION
 Figure S1 Treatment with both Sema6D and Plexin-A1 sirnas induces the phenotype essentially identical to that induced by treatment with Sema6D sirna alone or Plexin-A1 sirna alone. (a,b) The cardiac tube
Cells and reagents. Synaptopodin knockdown (1) and dynamin knockdown (2)
 and dynamin knockdown (2)") Supplemental Methods Cells and reagents. Synaptopodin knockdown (1) and dynamin knockdown (2) podocytes were cultured as described previously. Staurosporine, angiotensin II and actinomycin D were all obtained
Supplemental Methods Cells and reagents. Synaptopodin knockdown (1) and dynamin knockdown (2) podocytes were cultured as described previously. Staurosporine, angiotensin II and actinomycin D were all obtained
(A) RT-PCR for components of the Shh/Gli pathway in normal fetus cell (MRC-5) and a
 RT-PCR for components of the Shh/Gli pathway in normal fetus cell (MRC-5) and a") Supplementary figure legends Supplementary Figure 1. Expression of Shh signaling components in a panel of gastric cancer. (A) RT-PCR for components of the Shh/Gli pathway in normal fetus cell (MRC-5) and
Supplementary figure legends Supplementary Figure 1. Expression of Shh signaling components in a panel of gastric cancer. (A) RT-PCR for components of the Shh/Gli pathway in normal fetus cell (MRC-5) and
File Name: Supplementary Information Description: Supplementary Figures and Supplementary Tables. File Name: Peer Review File Description:
 File Name: Supplementary Information Description: Supplementary Figures and Supplementary Tables File Name: Peer Review File Description: Primer Name Sequence (5'-3') AT ( C) RT-PCR USP21 F 5'-TTCCCATGGCTCCTTCCACATGAT-3'