p5+mir30: AATGATACGGCGACCACCGACTAAAGTAGCCCCTTGAATTC
|
|
|
- Sandra Jordan
- 6 years ago
- Views:
Transcription
1 SUPPORTING INFORMATION METHODS Massively parallel sequencing and shrna screen data analysis pipeline Genomic DNA extraction and purification from surviving MCF7 cells in the genome wide screen was carried out using a Gentra Puregene kit (Qiagen). shrna sequences integrated into the genomic DNA of the screening cells were recovered by PCR amplification using the following primers: p5+mir30: AATGATACGGCGACCACCGACTAAAGTAGCCCCTTGAATTC p7+loop: CAAGCAGAAGACGGCATACGATAGTGAAGCCACAGATGTA PCR was performed using Amplitaq Gold polymerase. PCR products from multiple identical parallel reactions (sufficient to amplify DNA from 1000 cells per shrna construct in each viral pool) were subsequently pooled, concentrated and then sequenced on an Illumina GAIIx platform according to the manufacturer s instructions. Sequence image analysis and base calling were performed using the Genome Analyser pipeline v1.5 (Illumina). Short reads were aligned to shrna library using a bespoke software package, shalign (Sims et al., manuscript in preparation). In alignment, we allowed up to two mismatches to the reference sequence. Statistical analysis of screen results was performed in R using a bespoke software package, shrna-seq (Sims et al., manuscript in preparation). Briefly, read counts per shrna in each sample were log2 transformed and then the ratio of reads in 4OHT-treated vs. vehicle treated samples was calculated. Each log ratio was then normalised to the average shrna abundance in each pool using non-linear regression, to account for biases in shrna abundance. Normalised log ratios were then re-scaled by the pool Median Absolute Deviation (MAD) to ensure comparable distributions between different pools. The resultant Drug Effect (DE) log ratios were then quantile normalised to allow comparison between biological replica screens. A similar approach was used to calculate the effect of each shrna upon cell viability in the absence of 4OHT. Here we compared shrna frequency data from vehicle-treated samples with shrna frequency in the original plasmid pool used to generate virus.
2 Hit detection was performed using three parallel methods. In the first method, replicate DE scores for each shrna were summarised using a regularised t-test (to penalise hairpins with high variance across replicates) and a Z-score threshold of >2 or <-2 was used to call hits. All hairpins with no predicted target, or with greater than one predicted target were removed from this analysis. As alternative methods, RSA and RIGER were also used as previously described (see Refs. 1, 2). 96 well plate method (see Ref. 3). MCF7 cells were transfected with sirna duplexes in replica plates and 48 hours later exposed to a range of 4OHT concentrations or drug vehicle. Five days later cell viability was determined using an assay measuring cellular ATP levels (Cell Titer Glo, Promega). GFP competition assay (see Ref. 4) Fluorescence Activated Cell Sorting (FACS) was used to track the survival advantage conferred by specific shrnas in partially transduced MCF7 cells. Shifts in GFP percentage were monitored two days post-infection (t=0), and 5 days after treatment with 500 nm 4OHT or vehicle control using a BD Biosciences LSRII flow cytometer. Immunoblotting Western blotting was performed as described previously (see Ref. 5). Proteins were detected by using the following antibodies: anti-phospho p44/p42 MAPK (ERK1/2) (Thr202/Tyr204) (9101, Cell Signaling), anti-p44/p42 MAPK (ERK1/2) (9102, Cell Signaling), anti-ezrin (3145 Cell Signaling), and anti- (C-2, Santa Cruz Biotech). Activated Ras was assessed by immuno-precipitation using a Ras Activation Assay Kit (Millipore). In brief, activated GTP-Ras was isolated from cell lysates by the use of agarose beads conjugated to the Ras-binding domain of c-raf. The amount of GTP- Ras was quantified by the western blotting of purified samples with a mouse monoclonal antibody recognizing all three isoforms of Ras.
3 Supplementary MATERIALS Antibodies targeting the following epitopes were used: PTEN C-terminus (138G6, Cell Signalling), NF1 (NB , Novus Biologicals), c-raf (9422, Cell Signalling), RRAS2 (ab56859 Abcam), KRAS (F234, Santa Cruz Biotech), NAE1 ( AP, ProteinTech Group Inc.), UBA3 (E-22, Santa Cruz Biotech), NIPBL (NB , Novus Biologicals), RAD21 (L611, Cell Signalling), SMC3 (A A, Bethyl Labs) and EDF1 (ab33588, abcam). Supplementary Figure and Table LEGENDS Fig. S1. Tamoxifen genome-wide RNA interference (RNAi) screen (a) Highthroughput Screen (HTS) workflow. Schematic of the screen procedure employed to identify modifiers of tamoxifen response, orderly describing main steps and conditions involved. (b) Scatter Plot of normalised Drug Effect (DE) Z-scores per shrna, from the tamoxifen genome-wide screen performed in triplicate. Hit selection thresholds (Z>2 and Z<-2) are indicated in red. Fig. S2. Representative FACS profiles from a genome-wide screen replicate. Infectivity results shown for MCF7s three days after transduction with 6 shrna pools ( 10K molecules each). Fig. S3. Validation of the PTEN effect. (a) GFP FACS profiles from MCF7 cells infected with PTEN shrnas. Increase in the GFP+ fraction after 4OHT treatment indicated a resistance effect. (b) Dose-response curves to anti-estrogen agents, 4OHT and ICI 182,780, for MCF7 cells transfected with either control or PTEN sirnas. (c) RNAi reagents against PTEN effectively suppressed expression of their intended target when tested by western blotting. Fig. S4. Western blots showing gene silencing for: NF1, NAE1, UBA3, NIPBL (NIPBL-specific band is annotated by an arrow), RAD21, SMC3, KRAS, RRAS2, RAF1 and EDF1. Fig. S5. Low expression levels of EDF1 correlate with a favourable outcome in tamoxifen-treated breast cancer patients. The combined EDF1 effect among five studies is significant at p<0.05. Kaplan-Meier survival curve for the most significant study is also shown. Fig. S6. Kaplan-Meier survival curve from GUYS77 dataset showing that tamoxifen treated patients with low NF1 expression (defined as lowest quartile expression) were at significantly higher risk of distant relapse, p = 0.05 (log-rank test).
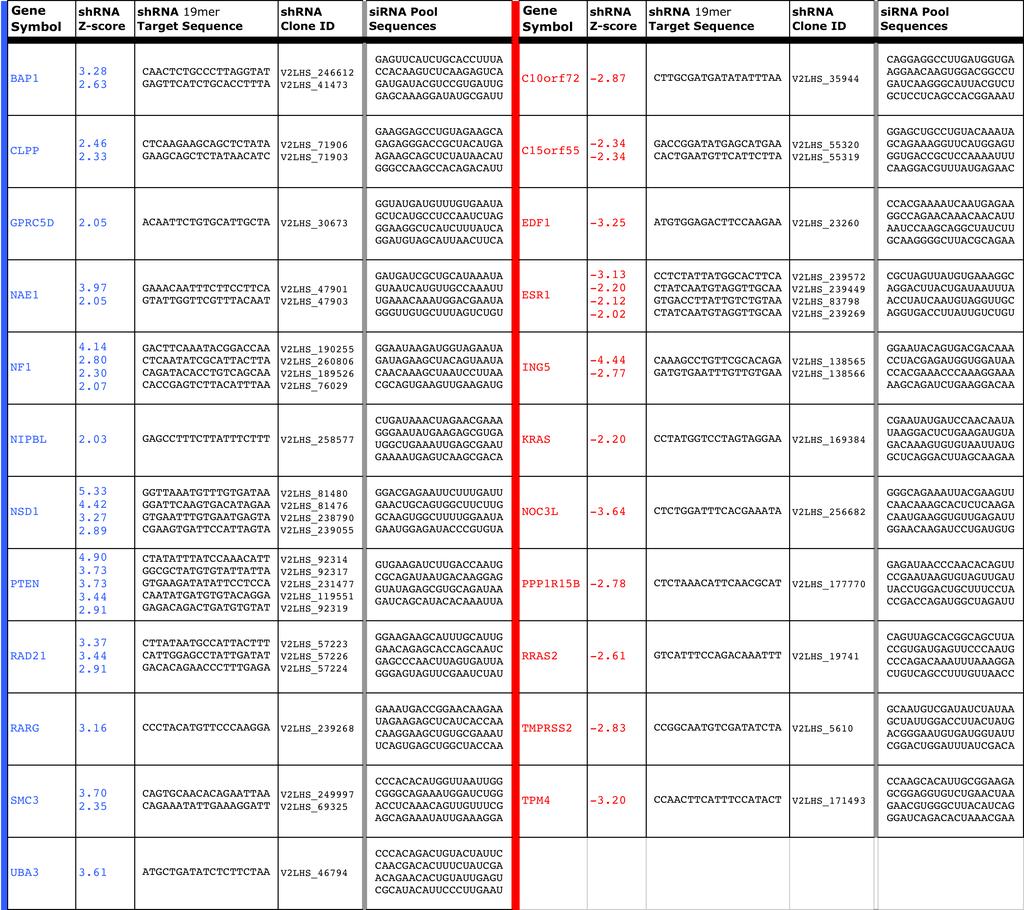
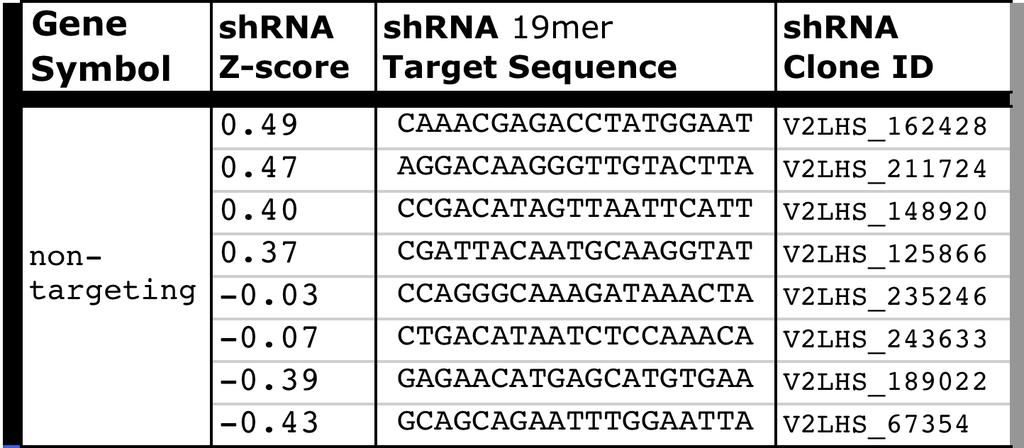
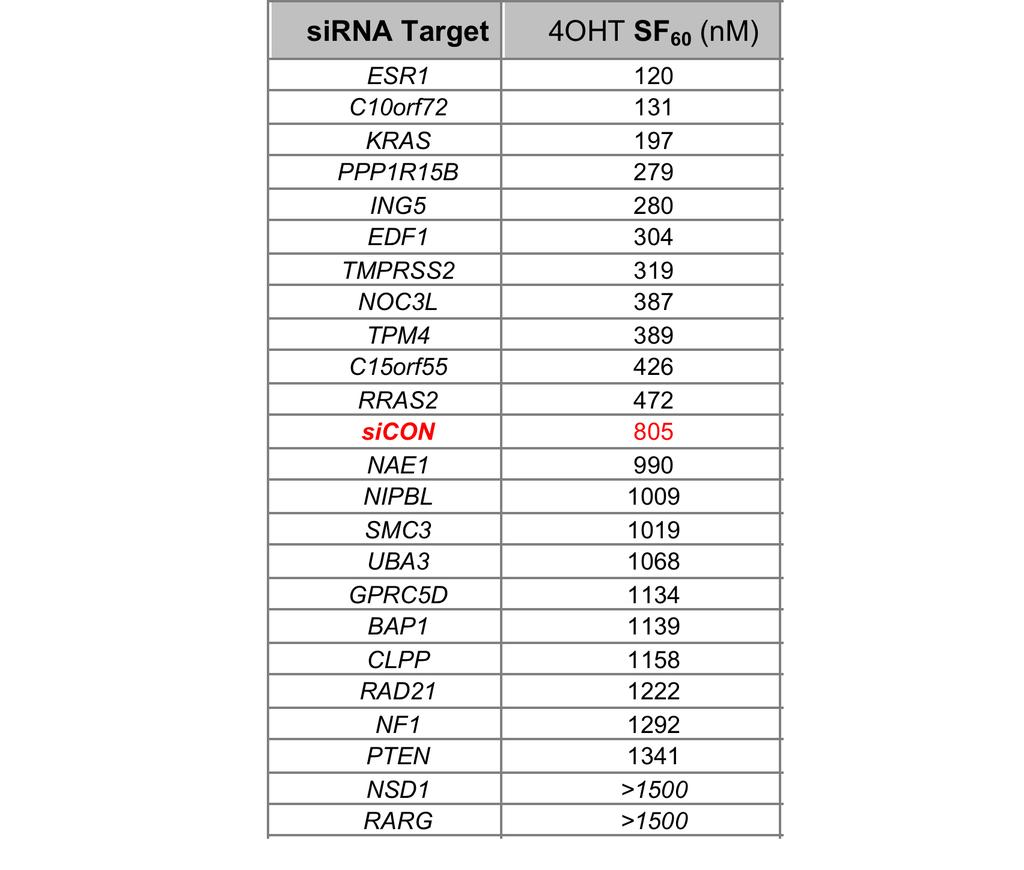
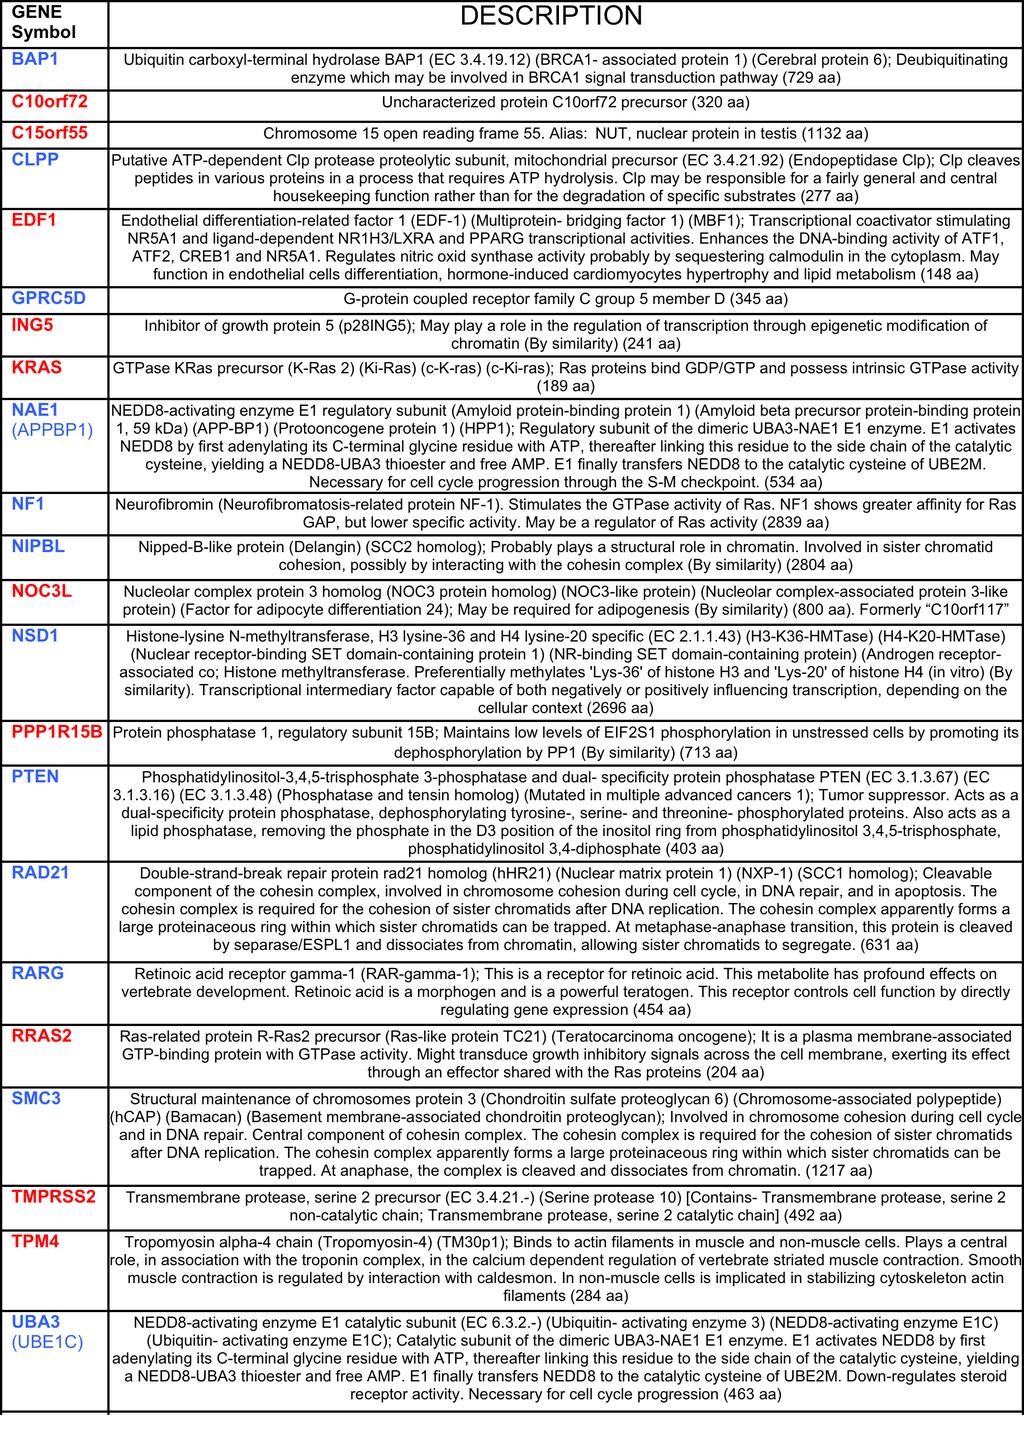
4 Table S1. Run statistics for massively parallel sequencing. % PF represents the percentage of short DNA read clusters that passed the quality filter used on the Illumina GAII pipeline. % matched reads describes the number of short DNA reads that mapped to the shrna library sequence. Table S2. Tamoxifen sensitization and resistance-causing effects identified from the genome-wide functional screen using the intersection of Z score threshold, RIGER and RSA methods. Table S3. RNAi molecules targeting validated hits: sequences for scoring shrnas and sirnas used for validation. Non-targeting shrna sequences also listed. Table S4. 4OHT SF 60 values from Fig. 2. Table S5. Gene annotation of validated hits (obtained from STRING). Resistance and sensitivity-causing hits, in blue or red respectively. EC numbers correspond to enzyme nomenclature from NC-IUBMB. Table S6. Tumor characteristics, according to NF1 expression, where low is defined as lowest quartile expression in five independent clinical datasets. Supplementary References 1. Subramanian A, et al. (2005) Gene set enrichment analysis: a knowledgebased approach for interpreting genome-wide expression profiles. Proc Natl Acad Sci U S A 102(43): Luo B, et al. (2008) Highly parallel identification of essential genes in cancer cells. Proc Natl Acad Sci U S A 105(51): Iorns E, et al. (2008) Identification of CDK10 as an important determinant of resistance to endocrine therapy for breast cancer. Cancer Cell 13(2): Burgess DJ, et al. (2008) Topoisomerase levels determine chemotherapy response in vitro and in vivo. Proc Natl Acad Sci U S A 105(26): Mendes-Pereira AM, et al. (2009) Synthetic lethal targeting of PTEN mutant cells with PARP inhibitors. EMBO Mol Med 1(6-7):
 Puromycin selection to remove non-infected cells Continuous culture in 4OHT Continuous culture in ethanol Genomic DNA extraction from surviving cells PCR amplification of shrna sequences in")
5 Fig. S1 A Genome-wide shrna library in 6 pools of ~10,000 pgipz constructs Viral packaging in 293T cells Six titred lentiviral pools 2x10 7 MCF7 cells transduced per viral pool (at MOI=0.7) Puromycin selection to remove non-infected cells Continuous culture in 4OHT Continuous culture in ethanol Genomic DNA extraction from surviving cells PCR amplification of shrna sequences in genomic DNA Massively parallel sequencing of PCR products shrna identification and abundance quantification Data normalization Hit identification B Z-score Pool

6 Fig. S % 69.2% % 80.0% % 82.9% 5 6
7 Fig. S3 A Pre-treatment (t=0) Vehicle-treated 4OHT-treated 79% 77% 78% shnonsil Relative cell number 72% 67% 49% 57% 75% 92% shpten.c shpten.b 74% 76% 95% shpten.a GFP- GFP+ GFP- GFP+ GFP- GFP+ B PTEN RNAi C PTEN
8 Fig. S4 280 KDa NF1 sinipbl 316 KDa NIPBL 60 KDa MCF7 sinae1 NAE1 sirad21 MCF7 siuba3 130 KDa RAD21 58 KDa UBA-3 sismc3 141 KDa SMC3 MCF7 sikras 21 KDa MCF7 sirras2 KRAS 74 KDa siraf1 c-raf 23 KDa RRAS2 16 KDa siedf1 EDF1
9 Fig. S5 Study Effect Weight Effect and 95% C.I. STOCK KIT OXFT GUYS77 GUYS Proportion free of distant relapse p = 0.02 rest low KIT Summary Time (years) Log Hazard Ratio Fig. S6 Proportion free of distant relapse p = 0.05 rest low GUYS Time (years)
10 Table S1 Run Lane Pool Treatment Replicate % PF Clusters % Mapped Run Vehicle 1 80% 97% Run Vehicle 1 80% 98% Run Vehicle 1 81% 99% Run Vehicle 1 89% 99% Run Vehicle 1 88% 99% Run Vehicle 1 88% 99% Run Tamoxifen 1 90% 96% Run Tamoxifen 1 90% 97% Run Tamoxifen 1 90% 98% Run Tamoxifen 1 91% 97% Run Tamoxifen 1 90% 98% Run Tamoxifen 1 91% 98% Run Vehicle 2 85% 91% Run Vehicle 2 87% 94% Run Vehicle 2 87% 95% Run Vehicle 2 87% 94% Run Vehicle 2 86% 94% Run Vehicle 2 86% 93% Run Tamoxifen 2 87% 96% Run Tamoxifen 2 89% 97% Run Tamoxifen 2 88% 98% Run Tamoxifen 2 88% 97% Run Tamoxifen 2 88% 97% Run Tamoxifen 2 89% 98% Run Vehicle 3 93% 97% Run Vehicle 3 93% 93% Run Vehicle 3 91% 98% Run Vehicle 3 87% 96% Run Vehicle 3 93% 99% Run Vehicle 3 93% 99% Run Tamoxifen 3 92% 97% Run Tamoxifen 3 90% 98% Run Tamoxifen 3 93% 99% Run Tamoxifen 3 92% 99% Run Tamoxifen 3 93% 99% Run Tamoxifen 3 92% 99% AVERAGE 89% 97%
11 Table S2 Sensitisation effects Gene Symbols ABCA13 CBR3 HES2 MAX RP11-292E2.1 TMPRSS2 AC CCDC11 HIPK4 MDM2 RP11-3B7.1 TMTC3 AC CD163 HMGA1 MED13L RP4-604K5.1 TPM4 ARHGAP18 CGA HOOK1 MPST RPS27L TRAK2 ARHGAP28 CLCN5 HOXC13 MYST3 SAP130 TTC29 ARPC2 COG2 HPSE2 NCKAP1 SCUBE1 UBAP2L ATBF1 CYTSB HSD11B2 NDFIP1 SEZ6L UBXN10 ATXN2L DACT3 IFNAR2 NMNAT2 SFPQ UCK1 BCL9L DDX50 IGF1R NRP2 SFRS11 VPS13C C11orf1 DGKI IL13 NSFL1C SH3YL1 WNT8B C12orf70 DNAJC8 ILF3 NUDT4 SLC11A2 XG C14orf23 EFCAB2 ING5 OR4D6 SLC26A6 XPA C15orf24 ERH JAK2 OR4K13 SLC6A5 ZFP62 C15orf55 ESR1 KCNH6 OVCH2 SPINLW1 ZMIZ1 C17orf75 FAM26E KCNJ9 P2RY13 ST6GALNAC1 ZNF391 C19orf63 GLA KDM5C PBRM1 STAM2 ZSWIM4 C1orf116 GLS KHDRBS1 PCBD2 STXBP5L C3orf67 GOLM1 KRAS PLXNA4 SYNJ2 C4orf29 GPR88 LAMA3 PPP1R15B TAS2R1 CACNA1C GULP1 LUC7L PRUNE2 TEKT3 CAPZA2 HECTD1 MAP2 PTS THOC2 Resistance-causing effects Gene Symbols AC CCDC42 GPR15 NDUFB2 RBMS3 TAF15 AC CCNC GRM8 NF1 RELT TCEAL3 ACAD8 CDKN2B HERC1 NFATC2IP REV1 TFB2M AFTPH CHD4 HOOK2 NFE2L3 RGS16 TIGD7 AK1 CLDN11 HPS3 NPAS2 RMND5A TMEM133 AMBP CLPP IL26 NRN1 RNASE8 TMEM155 ANKRD12 CPNE4 ITGAV NSD1 RP11-40M23.1 TMEM48 AP CRADD KANK1 OR4B1 S100A3 TNFRSF11A AP CREB5 KEAP1 ORC5L SFRS8 TOMM40L APOD CUL3 LARP4 OTOL1 SLC38A10 TRAIP ARMC4 CYP7B1 MAP2K1 PABPC5 SLC4A7 TRIM56 BAP1 CYTL1 MAP4 PENK SLFN12 TRIP12 BCOR DNASE1L3 MAPK11 PLD2 SMC3 TSPAN13 BECN1 EHHADH MAPKAPK5 PLEKHC1 SMCR7L TYRP1 C12orf61 ERG MARCKSL1 PLEKHG7 SOX12 UBE2W C1orf27 FAM118A MBD6 PPIL6 SPAM1 UBQLN1 C1orf61 FAM63B MED1 PTEN SPDYE2 UBR1 C6orf140 FBXO7 MPI PTPRF SRFBP1 VPS41 C6orf64 FUBP1 MRPS14 PTPRJ STAG2 ZBTB25 CAND1 GBP2 MTM1 PYCARD STARD3 ZNF256 CASP8AP2 GFRA1 NBEAL1 RAD21 STEAP3 ZNF627 CBLN2 GPN3 NCOA6 RASA1 SUCLG2
12 Table S3

13 Table S4
14 Table S5
15 Table S6 Study test low Rest p-value Summary STOCK N Mean NF1 expression Median age NS Median Tumour size (cm) NS Grade 1 (%) * Grade 2 (%) NS Grade 3 (%) * Node positive (%) NS PR positive (%) NS KIT N Mean NF1 expression Median age NS Median Tumour size (cm) NS Grade 1 (%) NS Grade 2 (%) NS Grade 3 (%) ** Node positive (%) NS PR positive (%) NS OXFT N Mean NF1 expression Median age NS Median Tumour size (cm) NS Grade 1 (%) * Grade 2 (%) NS Grade 3 (%) NS Node positive (%) NS PR positive (%) NA NA GUYS77 N Mean NF1 expression Median age NS Median Tumour size (cm) NS Grade 1 (%) NS Grade 2 (%) NS Grade 3 (%) NS Node positive (%) NS PR positive (%) NS GUYS87 N Mean NF1 expression Median age NS Median Tumour size (cm) NS Grade 1 (%) NS Grade 2 (%) NS Grade 3 (%) NS Node positive (%) NS PR positive (%) NS
Supplementary Data Cyclophilin B Supports Myc and Mutant p53 Dependent Survival of Glioblastoma Multiforme Cells
 Supplementary Data Cyclophilin B Supports Myc and Mutant p53 Dependent Survival of Glioblastoma Multiforme Cells Jae Won Choi, Mark A. Schroeder, Jann N. Sarkaria, and Richard J. Bram 1 Figure S1. Pharmacological
Supplemental Table 1. List of genes and mature shrna sequences identified from the shrna screen in BRCA2-mutant PEO1 cells.
 Guillemette_Supplemental Table 1 Gene Mature Sequence Gene Mature Sequence ATTCATAGGATGTCAGCAG LOC157193 TATGCGTAAGTAATAAATTGCT TTAGTTCTGTCTTGGAGG LOC152225 CGCATATATGTTCTGACTT ALDH2 CACTTCAGTGTATGCCT
Supplemental Information. NRF2 Is a Major Target of ARF. in p53-independent Tumor Suppression
 Molecular Cell, Volume 68 Supplemental Information NRF2 Is a Major Target of ARF in p53-independent Tumor Suppression Delin Chen, Omid Tavana, Bo Chu, Luke Erber, Yue Chen, Richard Baer, and Wei Gu Figure
Supplementary Figure 1: High-throughput profiling of survival after exposure to - radiation. (a) Cells were plated in at least 7 wells in a 384-well
 Cells were plated in at least 7 wells in a 384-well") Supplementary Figure 1: High-throughput profiling of survival after exposure to - radiation. (a) Cells were plated in at least 7 wells in a 384-well plate at cell densities ranging from 25-225 cells in
Supplementary Figure 1: High-throughput profiling of survival after exposure to - radiation. (a) Cells were plated in at least 7 wells in a 384-well plate at cell densities ranging from 25-225 cells in
Lentiviral Delivery of Combinatorial mirna Expression Constructs Provides Efficient Target Gene Repression.
 Supplementary Figure 1 Lentiviral Delivery of Combinatorial mirna Expression Constructs Provides Efficient Target Gene Repression. a, Design for lentiviral combinatorial mirna expression and sensor constructs.
SUPPLEMENTARY FIGURES
 SUPPLEMENTARY FIGURES Figure S1. Clinical significance of ZNF322A overexpression in Caucasian lung cancer patients. (A) Representative immunohistochemistry images of ZNF322A protein expression in tissue
(a) Significant biological processes (upper panel) and disease biomarkers (lower panel)
 Significant biological processes (upper panel) and disease biomarkers (lower panel)") Supplementary Figure 1. Functional enrichment analyses of secretomic proteins. (a) Significant biological processes (upper panel) and disease biomarkers (lower panel) 2 involved by hrab37-mediated secretory
Supplementary Figure 1. Functional enrichment analyses of secretomic proteins. (a) Significant biological processes (upper panel) and disease biomarkers (lower panel) 2 involved by hrab37-mediated secretory
Supplementary Figure 1. A. Bar graph representing the expression levels of the 19 indicated genes in the microarrays analyses comparing human lung
 Supplementary Figure 1. A. Bar graph representing the expression levels of the 19 indicated genes in the microarrays analyses comparing human lung immortalized broncho-epithelial cells (AALE cells) expressing
Supplementary Figure 1. HOPX is hypermethylated in NPC. (a) Methylation levels of HOPX in Normal (n = 24) and NPC (n = 24) tissues from the
 Methylation levels of HOPX in Normal (n = 24) and NPC (n = 24) tissues from the") Supplementary Figure 1. HOPX is hypermethylated in NPC. (a) Methylation levels of HOPX in Normal (n = 24) and NPC (n = 24) tissues from the genome-wide methylation microarray data. Mean ± s.d.; Student
Supplementary Figure 1. HOPX is hypermethylated in NPC. (a) Methylation levels of HOPX in Normal (n = 24) and NPC (n = 24) tissues from the genome-wide methylation microarray data. Mean ± s.d.; Student
Analysis of Massively Parallel Sequencing Data Application of Illumina Sequencing to the Genetics of Human Cancers
 Analysis of Massively Parallel Sequencing Data Application of Illumina Sequencing to the Genetics of Human Cancers Gordon Blackshields Senior Bioinformatician Source BioScience 1 To Cancer Genetics Studies
Supplementary Figure 1 Role of Raf-1 in TLR2-Dectin-1-mediated cytokine expression
 Supplementary Figure 1 Supplementary Figure 1 Role of Raf-1 in TLR2-Dectin-1-mediated cytokine expression. Quantitative real-time PCR of indicated mrnas in DCs stimulated with TLR2-Dectin-1 agonist zymosan
Supplementary Information Supplementary Fig. 1. Elevated Usp9x in melanoma and NRAS mutant melanoma cells are dependent on NRAS for 3D growth.
 Supplementary Information Supplementary Fig. 1. Elevated Usp9x in melanoma and NRAS mutant melanoma cells are dependent on NRAS for 3D growth. a. Immunoblot for Usp9x protein in NRAS mutant melanoma cells
Supplementary Figure 1 Induction of cellular senescence and isolation of exosome. a to c, Pre-senescent primary normal human diploid fibroblasts
 Supplementary Figure 1 Induction of cellular senescence and isolation of exosome. a to c, Pre-senescent primary normal human diploid fibroblasts (TIG-3 cells) were rendered senescent by either serial passage
Supplementary Data for:
 Supplementary Data for: Tumour sampling method can significantly influence gene expression profiles derived from neoadjuvant window studies Dominic A. Pearce 1, Laura M. Arthur 1, Arran K. Turnbull 1,
Supplementary Figures
 Supplementary Figures Supplementary Figure 1 DOT1L regulates the expression of epithelial and mesenchymal markers. (a) The expression levels and cellular localizations of EMT markers were confirmed by
Tips for genome-wide shrna pooled screen
 Tips for genome-wide shrna pooled screen 鄭金松 1 Approaches to large-scale RNAi screen/selection (I) Arrayed RNAi screen To address the hits by arrayed information (a) sirna / plasmid shrna (b) Arrayed viral
MicroRNA sponges: competitive inhibitors of small RNAs in mammalian cells
 MicroRNA sponges: competitive inhibitors of small RNAs in mammalian cells Margaret S Ebert, Joel R Neilson & Phillip A Sharp Supplementary figures and text: Supplementary Figure 1. Effect of sponges on
HEK293FT cells were transiently transfected with reporters, N3-ICD construct and
 Supplementary Information Luciferase reporter assay HEK293FT cells were transiently transfected with reporters, N3-ICD construct and increased amounts of wild type or kinase inactive EGFR. Transfections
Supplementary Information
 Supplementary Information Supplementary Figure 1. Effect of mir mimics and anti-mirs on DTPs a, Representative fluorescence microscopy images of GFP vector control or mir mimicexpressing parental and DTP
Nature Genetics: doi: /ng Supplementary Figure 1. HOX fusions enhance self-renewal capacity.
 Supplementary Figure 1 HOX fusions enhance self-renewal capacity. Mouse bone marrow was transduced with a retrovirus carrying one of three HOX fusion genes or the empty mcherry reporter construct as described
Nature Immunology doi: /ni Supplementary Figure 1. Raf-1 inhibition does not affect TLR4-induced type I IFN responses.
 Supplementary Figure 1 Raf-1 inhibition does not affect TLR4-induced type I IFN responses. Real-time PCR analyses of IFNB, ISG15, TRIM5, TRIM22 and APOBEC3G mrna in modcs 6 h after stimulation with TLR4
Supplementary Appendix
 Supplementary Appendix This appendix has been provided by the authors to give readers additional information about their work. Supplement to: Choi YL, Soda M, Yamashita Y, et al. EML4-ALK mutations in
Supplementary Fig. 1. GPRC5A post-transcriptionally down-regulates EGFR expression. (a) Plot of the changes in steady state mrna levels versus
 Plot of the changes in steady state mrna levels versus") Supplementary Fig. 1. GPRC5A post-transcriptionally down-regulates EGFR expression. (a) Plot of the changes in steady state mrna levels versus changes in corresponding proteins between wild type and Gprc5a-/-
Supplementary Fig. 1. GPRC5A post-transcriptionally down-regulates EGFR expression. (a) Plot of the changes in steady state mrna levels versus changes in corresponding proteins between wild type and Gprc5a-/-
Supplementary Figure 1 Cell line TRIB2 status. Supplementary Figure 2 TRIB2 status has no impact on the cell cycle after PI3K inhibition. a. b.
 Supplementary Figure 1 Cell line TRIB2 status. TRIB2 protein expression to determine endogenous expression and to determine the effectiveness of each of our TRIB2 knockdown constructs. Supplementary Figure
Supplementary Fig. 1: ATM is phosphorylated in HER2 breast cancer cell lines. (A) ATM is phosphorylated in SKBR3 cells depending on ATM and HER2
 ATM is phosphorylated in SKBR3 cells depending on ATM and HER2") Supplementary Fig. 1: ATM is phosphorylated in HER2 breast cancer cell lines. (A) ATM is phosphorylated in SKBR3 cells depending on ATM and HER2 activity. Upper panel: Representative histograms for FACS
Supplementary Fig. 1: ATM is phosphorylated in HER2 breast cancer cell lines. (A) ATM is phosphorylated in SKBR3 cells depending on ATM and HER2 activity. Upper panel: Representative histograms for FACS
Supplementary Figure 1
 Supplementary Figure 1 6 HE-50 HE-116 E-1 HE-108 Supplementary Figure 1. Targeted drug response curves of endometrial cancer cells. Endometrial cancer cell lines were incubated with serial dilutions of
SUPPLEMENTARY INFORMATION
 DOI: 10.1038/ncb2607 Figure S1 Elf5 loss promotes EMT in mammary epithelium while Elf5 overexpression inhibits TGFβ induced EMT. (a, c) Different confocal slices through the Z stack image. (b, d) 3D rendering
Soft Agar Assay. For each cell pool, 100,000 cells were resuspended in 0.35% (w/v)
") SUPPLEMENTARY MATERIAL AND METHODS Soft Agar Assay. For each cell pool, 100,000 cells were resuspended in 0.35% (w/v) top agar (LONZA, SeaKem LE Agarose cat.5004) and plated onto 0.5% (w/v) basal agar.
SUPPLEMENTARY MATERIAL AND METHODS Soft Agar Assay. For each cell pool, 100,000 cells were resuspended in 0.35% (w/v) top agar (LONZA, SeaKem LE Agarose cat.5004) and plated onto 0.5% (w/v) basal agar.
Supplementary Data Table of Contents:
 Supplementary Data Table of Contents: - Supplementary Methods - Supplementary Figures S1(A-B) - Supplementary Figures S2 (A-B) - Supplementary Figures S3 - Supplementary Figures S4(A-B) - Supplementary
Supplementary Figure 1. a. b. Relative cell viability. Nature Genetics: doi: /ng SCR shyap1-1 shyap
 Supplementary Figure 1. a. b. p-value for depletion in vehicle (DMSO) 1e-05 1e-03 1e-01 1 0 1000 2000 3000 4000 5000 Genes log2 normalized shrna counts in T0 0 2 4 6 8 sh1 shluc 0 2 4 6 8 log2 normalized
RNA-Seq Preparation Comparision Summary: Lexogen, Standard, NEB
 RNA-Seq Preparation Comparision Summary: Lexogen, Standard, NEB CSF-NGS January 22, 214 Contents 1 Introduction 1 2 Experimental Details 1 3 Results And Discussion 1 3.1 ERCC spike ins............................................
Supplementary Figure 1. IHC and proliferation analysis of pten-deficient mammary tumors
 Wang et al LEGENDS TO SUPPLEMENTARY INFORMATION Supplementary Figure 1. IHC and proliferation analysis of pten-deficient mammary tumors A. Induced expression of estrogen receptor α (ERα) in AME vs PDA
SUPPLEMENTARY INFORMATION. Supplementary Figures S1-S9. Supplementary Methods
 SUPPLEMENTARY INFORMATION SUMO1 modification of PTEN regulates tumorigenesis by controlling its association with the plasma membrane Jian Huang 1,2#, Jie Yan 1,2#, Jian Zhang 3#, Shiguo Zhu 1, Yanli Wang
VirusDetect pipeline - virus detection with small RNA sequencing
 VirusDetect pipeline - virus detection with small RNA sequencing CSC webinar 16.1.2018 Eija Korpelainen, Kimmo Mattila, Maria Lehtivaara Big thanks to Jan Kreuze and Jari Valkonen! Outline Small interfering
Supplementary Figure 1: si-craf but not si-braf sensitizes tumor cells to radiation.
 Supplementary Figure 1: si-craf but not si-braf sensitizes tumor cells to radiation. (a) Embryonic fibroblasts isolated from wildtype (WT), BRAF -/-, or CRAF -/- mice were irradiated (6 Gy) and DNA damage
ANGPTL2 increases bone metastasis of breast cancer cells through. Tetsuro Masuda, Motoyoshi Endo, Yutaka Yamamoto, Haruki Odagiri, Tsuyoshi
 Masuda et al. Supplementary information for ANGPTL2 increases bone metastasis of breast cancer cells through enhancing CXCR4 signaling Tetsuro Masuda, Motoyoshi Endo, Yutaka Yamamoto, Haruki Odagiri, Tsuyoshi
Supplementary Information Titles Journal: Nature Medicine
 Supplementary Information Titles Journal: Nature Medicine Article Title: Corresponding Author: Supplementary Item & Number Supplementary Fig.1 Fig.2 Fig.3 Fig.4 Fig.5 Fig.6 Fig.7 Fig.8 Fig.9 Fig. Fig.11
SUPPLEMENTARY INFORMATION
 doi:10.1038/nature10860 Supplementary Discussion It remains unclear why H3K9 demethylation appeared to be more sensitive to suppression than at least some other histone methylation marks as a result of
underlying metastasis and recurrence in HNSCC, we analyzed two groups of patients. The
 Supplementary Figures Figure S1. Patient cohorts and study design. To define and interrogate the genetic alterations underlying metastasis and recurrence in HNSCC, we analyzed two groups of patients. The
7SK ChIRP-seq is specifically RNA dependent and conserved between mice and humans.
 Supplementary Figure 1 7SK ChIRP-seq is specifically RNA dependent and conserved between mice and humans. Regions targeted by the Even and Odd ChIRP probes mapped to a secondary structure model 56 of the
Supplementary Figure 1: Tissue of Origin analysis on 152 cell lines. (a) Heatmap representation of the 30 Tissue scores for the 152 cell lines.
 Heatmap representation of the 30 Tissue scores for the 152 cell lines.") Supplementary Figure 1: Tissue of Origin analysis on 152 cell lines. (a) Heatmap representation of the 30 Tissue scores for the 152 cell lines. The scores summarize the global expression of the tissue
Supplementary Figure 1: Tissue of Origin analysis on 152 cell lines. (a) Heatmap representation of the 30 Tissue scores for the 152 cell lines. The scores summarize the global expression of the tissue
Supplementary Figure 1
 Supplementary Figure 1 Supplementary Figure 1. Neither the activation nor suppression of the MAPK pathway affects the ASK1/Vif interaction. (a, b) HEK293 cells were cotransfected with plasmids encoding
Supplementary Information
 Supplementary Information Supplementary Figure 1. EBV-gB 23-431 mainly exists as trimer in HEK 293FT cells. (a) Western blotting analysis for DSS crosslinked FLAG-gB 23-431. HEK 293FT cells transfected
a" b" 2N c" d" e" f" !!Aurora!A!!!CP110!
 DLD1/Reference a" 2N 2N 2N/DLD1 2N/ /DLD1 c" d" e" f" TargetID 2N.AVG_Sig 2N.Det Pval.AVG_Sig.Det Pval Diff Pval DiffScore SYMBOL ILMN_26396 18.35238 0.0080058 44.81118 0.0021834 0.000323 34.90542 KRTHA4
a b G75 G60 Sw-2 Sw-1 Supplementary Figure 1. Structure predictions by I-TASSER Server.
 a b G75 2 2 G60 Sw-2 Sw-1 Supplementary Figure 1. Structure predictions by I-TASSER Server. a. Overlay of top 10 models generated by I-TASSER illustrates the potential effect of 7 amino acid insertion
SUPPLEMENTARY INFORMATION
 doi:.38/nature8975 SUPPLEMENTAL TEXT Unique association of HOTAIR with patient outcome To determine whether the expression of other HOX lincrnas in addition to HOTAIR can predict patient outcome, we measured
Figure S1: Effects on haptotaxis are independent of effects on cell velocity A)
") Supplemental Figures Figure S1: Effects on haptotaxis are independent of effects on cell velocity A) Velocity of MV D7 fibroblasts expressing different GFP-tagged Ena/VASP family proteins in the haptotaxis
Supplemental Figures Figure S1: Effects on haptotaxis are independent of effects on cell velocity A) Velocity of MV D7 fibroblasts expressing different GFP-tagged Ena/VASP family proteins in the haptotaxis
Supplementary Figures
 Supplementary Figures Supplementary Figure 1 Characterization of stable expression of GlucB and sshbira in the CT26 cell line (a) Live cell imaging of stable CT26 cells expressing green fluorescent protein
Supplementary Materials for
 www.sciencesignaling.org/cgi/content/full/8/398/rs12/dc1 Supplementary Materials for Quantitative phosphoproteomics reveals new roles for the protein phosphatase PP6 in mitotic cells Scott F. Rusin, Kate
York criteria, 6 RA patients and 10 age- and gender-matched healthy controls (HCs).
.") MATERIALS AND METHODS Study population Blood samples were obtained from 15 patients with AS fulfilling the modified New York criteria, 6 RA patients and 10 age- and gender-matched healthy controls (HCs).
MATERIALS AND METHODS Study population Blood samples were obtained from 15 patients with AS fulfilling the modified New York criteria, 6 RA patients and 10 age- and gender-matched healthy controls (HCs).
SUPPLEMENTARY INFORMATION
 DOI: 1.138/ncb3355 a S1A8 + cells/ total.1.8.6.4.2 b S1A8/?-Actin c % T-cell proliferation 3 25 2 15 1 5 T cells Supplementary Figure 1 Inter-tumoral heterogeneity of MDSC accumulation in mammary tumor
CHAPTER 4 RESULTS. showed that all three replicates had similar growth trends (Figure 4.1) (p<0.05; p=0.0000)
 (p<0.05; p=0.0000)") CHAPTER 4 RESULTS 4.1 Growth Characterization of C. vulgaris 4.1.1 Optical Density Growth study of Chlorella vulgaris based on optical density at 620 nm (OD 620 ) showed that all three replicates had similar
CHAPTER 4 RESULTS 4.1 Growth Characterization of C. vulgaris 4.1.1 Optical Density Growth study of Chlorella vulgaris based on optical density at 620 nm (OD 620 ) showed that all three replicates had similar
fl/+ KRas;Atg5 fl/+ KRas;Atg5 fl/fl KRas;Atg5 fl/fl KRas;Atg5 Supplementary Figure 1. Gene set enrichment analyses. (a) (b)
 (b)") KRas;At KRas;At KRas;At KRas;At a b Supplementary Figure 1. Gene set enrichment analyses. (a) GO gene sets (MSigDB v3. c5) enriched in KRas;Atg5 fl/+ as compared to KRas;Atg5 fl/fl tumors using gene set
KRas;At KRas;At KRas;At KRas;At a b Supplementary Figure 1. Gene set enrichment analyses. (a) GO gene sets (MSigDB v3. c5) enriched in KRas;Atg5 fl/+ as compared to KRas;Atg5 fl/fl tumors using gene set
Supplementary Figure 1. SC35M polymerase activity in the presence of Bat or SC35M NP encoded from the phw2000 rescue plasmid.
 1 2 3 4 5 6 7 8 9 10 11 12 13 14 15 16 17 18 19 20 21 22 23 24 25 26 27 Supplementary Figure 1. SC35M polymerase activity in the presence of Bat or SC35M NP encoded from the phw2000 rescue plasmid. HEK293T
Transduction of lentivirus to human primary CD4+ T cells
 Transduction of lentivirus to human primary CD4 + T cells Human primary CD4 T cells were stimulated with anti-cd3/cd28 antibodies (10 µl/2 5 10^6 cells of Dynabeads CD3/CD28 T cell expander, Invitrogen)
VIRAL TITER COUNTS. The best methods of measuring infectious lentiviral titer
 VIRAL TITER COUNTS The best methods of measuring infectious lentiviral titer FLUORESCENCE CYCLES qpcr of Viral RNA SUMMARY Viral vectors are now routinely used for gene transduction in a wide variety of
Fluxion Biosciences and Swift Biosciences Somatic variant detection from liquid biopsy samples using targeted NGS
 APPLICATION NOTE Fluxion Biosciences and Swift Biosciences OVERVIEW This application note describes a robust method for detecting somatic mutations from liquid biopsy samples by combining circulating tumor
RASA: Robust Alternative Splicing Analysis for Human Transcriptome Arrays
 Supplementary Materials RASA: Robust Alternative Splicing Analysis for Human Transcriptome Arrays Junhee Seok 1*, Weihong Xu 2, Ronald W. Davis 2, Wenzhong Xiao 2,3* 1 School of Electrical Engineering,
mtor Inhibition Specifically Sensitizes Colorectal Cancers with KRAS or BRAF Mutations to BCL-2/BCL-
 Supplementary Material for mtor Inhibition Specifically Sensitizes Colorectal Cancers with KRAS or BRAF Mutations to BCL-2/BCL- XL Inhibition by Suppressing MCL-1 Anthony C. Faber 1,2 *, Erin M. Coffee
Title page. Title: MicroRNA-155 Controls Exosome Synthesis and Promotes Gemcitabine Resistance in
 Title page Title: MicroRNA- Controls Synthesis and Promotes Gemcitabine Resistance in Pancreatic Ductal Adenocarcinoma Authors Manabu Mikamori, Daisaku Yamada, Hidetoshi Eguchi, Shinichiro Hasegawa, Tomoya
SHREE ET AL, SUPPLEMENTAL MATERIALS. (A) Workflow for tumor cell line derivation and orthotopic implantation.
 Workflow for tumor cell line derivation and orthotopic implantation.") SHREE ET AL, SUPPLEMENTAL MATERIALS SUPPLEMENTAL FIGURE AND TABLE LEGENDS Supplemental Figure 1. Derivation and characterization of TS1-TGL and TS2-TGL PyMT cell lines and development of an orthotopic
SHREE ET AL, SUPPLEMENTAL MATERIALS SUPPLEMENTAL FIGURE AND TABLE LEGENDS Supplemental Figure 1. Derivation and characterization of TS1-TGL and TS2-TGL PyMT cell lines and development of an orthotopic
Dox. R26-rtTA Tyr-CreERT2. any ink/arf, no rtta (n=8) ink/arf +/+ (n=5) Day 0 Day 11 Day 18 Day 28
 ink/arf +/+ (n=5) Day 0 Day 11 Day 18 Day 28") A 4OHT Dox hraf iip tumors inras ddh 2 O -RT Ink/Arf / Pten l/ l R26-lsl-rtTA Tyr-reERT2 TetO-hRAF V6E Ink/Arf / Pten / R26-rtTA Tyr-reERT2 TetO-hRAF V6E Ink/Arf / Pten / R26-rtTA Tyr-reERT2 TetO-hRAF
A 4OHT Dox hraf iip tumors inras ddh 2 O -RT Ink/Arf / Pten l/ l R26-lsl-rtTA Tyr-reERT2 TetO-hRAF V6E Ink/Arf / Pten / R26-rtTA Tyr-reERT2 TetO-hRAF V6E Ink/Arf / Pten / R26-rtTA Tyr-reERT2 TetO-hRAF
Supplementary Information POLO-LIKE KINASE 1 FACILITATES LOSS OF PTEN-INDUCED PROSTATE CANCER FORMATION
 Supplementary Information POLO-LIKE KINASE 1 FACILITATES LOSS OF PTEN-INDUCED PROSTATE CANCER FORMATION X. Shawn Liu 1, 3, Bing Song 2, 3, Bennett D. Elzey 3, 4, Timothy L. Ratliff 3, 4, Stephen F. Konieczny
~Lentivirus production~
 ~Lentivirus production~ May 30, 2008 RNAi core R&D group member Lentivirus Production Session Lentivirus!!! Is it health threatening to lab technician? What s so good about this RNAi library? How to produce
Supplemental Figure S1. Expression of Cirbp mrna in mouse tissues and NIH3T3 cells.
 SUPPLEMENTAL FIGURE AND TABLE LEGENDS Supplemental Figure S1. Expression of Cirbp mrna in mouse tissues and NIH3T3 cells. A) Cirbp mrna expression levels in various mouse tissues collected around the clock
Supplemental File. TRAF6 is an amplified oncogene bridging the Ras and nuclear factor-κb cascade in human lung cancer
 Supplemental File TRAF6 is an amplified oncogene bridging the Ras and nuclear factor-κb cascade in human lung cancer Daniel T. Starczynowski, William W. Lockwood, Sophie Delehouzee, Raj Chari, Joanna Wegrzyn,
Functional genomics reveal that the serine synthesis pathway is essential in breast cancer
 Functional genomics reveal that the serine synthesis pathway is essential in breast cancer Results Presented by Stacey Lin Lloyd Lab http://www.amsbio.com/expression-ready-lentiviral-particles.aspx Overview
Supplementary Materials
 Supplementary Materials Figure S1. MTT Cell viability assay. To measure the cytotoxic potential of the oxidative treatment, the MTT [3-(4,5-dimethylthiazol- 2-yl)-2,5-diphenyl tetrazolium bromide] assay
Supplemental Information. Integrated Genomic Analysis of the Ubiquitin. Pathway across Cancer Types
 Cell Reports, Volume 23 Supplemental Information Integrated Genomic Analysis of the Ubiquitin Pathway across Zhongqi Ge, Jake S. Leighton, Yumeng Wang, Xinxin Peng, Zhongyuan Chen, Hu Chen, Yutong Sun,
Supplementary Materials for
 www.sciencesignaling.org/cgi/content/full/8/393/rs9/dc1 Supplementary Materials for Identification of potential drug targets for tuberous sclerosis complex by synthetic screens combining CRISPR-based knockouts
Supplementary Figure S1 Expression of mir-181b in EOC (A) Kaplan-Meier
 Kaplan-Meier") Supplementary Figure S1 Expression of mir-181b in EOC (A) Kaplan-Meier curves for progression-free survival (PFS) and overall survival (OS) in a cohort of patients (N=52) with stage III primary ovarian
Supplementary Figure S1 Expression of mir-181b in EOC (A) Kaplan-Meier curves for progression-free survival (PFS) and overall survival (OS) in a cohort of patients (N=52) with stage III primary ovarian
Supplementary Information
 Supplementary Information mediates STAT3 activation at retromer-positive structures to promote colitis and colitis-associated carcinogenesis Zhang et al. a b d e g h Rel. Luc. Act. Rel. mrna Rel. mrna
Nature Genetics: doi: /ng Supplementary Figure 1. Assessment of sample purity and quality.
 Supplementary Figure 1 Assessment of sample purity and quality. (a) Hematoxylin and eosin staining of formaldehyde-fixed, paraffin-embedded sections from a human testis biopsy collected concurrently with
Supplemental Figures:
 Supplemental Figures: Figure 1: Intracellular distribution of VWF by electron microscopy in human endothelial cells. a) Immunogold labeling of LC3 demonstrating an LC3-positive autophagosome (white arrow)
supplementary information
 DOI: 10.1038/ncb2133 Figure S1 Actomyosin organisation in human squamous cell carcinoma. (a) Three examples of actomyosin organisation around the edges of squamous cell carcinoma biopsies are shown. Myosin
File Name: Supplementary Information Description: Supplementary Figures and Supplementary Tables. File Name: Peer Review File Description:
 File Name: Supplementary Information Description: Supplementary Figures and Supplementary Tables File Name: Peer Review File Description: Primer Name Sequence (5'-3') AT ( C) RT-PCR USP21 F 5'-TTCCCATGGCTCCTTCCACATGAT-3'
Supplementary Figure 1 IL-27 IL
 Tim-3 Supplementary Figure 1 Tc0 49.5 0.6 Tc1 63.5 0.84 Un 49.8 0.16 35.5 0.16 10 4 61.2 5.53 10 3 64.5 5.66 10 2 10 1 10 0 31 2.22 10 0 10 1 10 2 10 3 10 4 IL-10 28.2 1.69 IL-27 Supplementary Figure 1.
PREPARED FOR: U.S. Army Medical Research and Materiel Command Fort Detrick, Maryland
 AD Award Number: W81XWH-07-1-0441 TITLE: A Novel Approach to Identify Genes that Modulate Response of Human Ovarian Cancer Cells to Chemotherapeutic Agents Using High-Throughput RNA Interference PRINCIPAL
Cellecta Overview. Started Operations in 2007 Headquarters: Mountain View, CA
 Cellecta Overview Started Operations in 2007 Headquarters: Mountain View, CA Focus: Development of flexible, scalable, and broadly parallel genetic screening assays to expedite the discovery and characterization
Mutation Detection and CNV Analysis for Illumina Sequencing data from HaloPlex Target Enrichment Panels using NextGENe Software for Clinical Research
 Mutation Detection and CNV Analysis for Illumina Sequencing data from HaloPlex Target Enrichment Panels using NextGENe Software for Clinical Research Application Note Authors John McGuigan, Megan Manion,
Nature Immunology: doi: /ni.3631
 Supplementary Figure 1 SPT analyses of Zap70 at the T cell plasma membrane. (a) Total internal reflection fluorescent (TIRF) excitation at 64-68 degrees limits single molecule detection to 100-150 nm above
Nature Immunology: doi: /ni Supplementary Figure 1 33,312. Aire rep 1. Aire rep 2 # 44,325 # 44,055. Aire rep 1. Aire rep 2.
 a 33,312 b rep 1 rep 1 # 44,325 rep 2 # 44,055 [0-84] rep 2 [0-84] 1810043G02Rik Pfkl Dnmt3l Icosl rep 1 [0-165] rep 2 [0-165] Rps14 Cd74 Mir5107 Tcof1 rep 1 [0-69] rep 2 [0-68] Id3 E2f2 Asap3 rep 1 [0-141]
Nature Neuroscience: doi: /nn Supplementary Figure 1
 Supplementary Figure 1 EGFR inhibition activates signaling pathways (a-b) EGFR inhibition activates signaling pathways (a) U251EGFR cells were treated with erlotinib (1µM) for the indicated times followed
Tel: ; Fax: ;
 Tel.: +98 216 696 9291; Fax: +98 216 696 9291; E-mail: mrasadeghi@pasteur.ac.ir Tel: +98 916 113 7679; Fax: +98 613 333 6380; E-mail: abakhshi_e@ajums.ac.ir A Soluble Chromatin-bound MOI 0 1 5 0 1 5 HDAC2
Nature Genetics: doi: /ng.3731
 Supplementary Figure 1 Circadian profiles of Adarb1 transcript and ADARB1 protein in mouse tissues. (a) Overlap of rhythmic transcripts identified in the previous transcriptome analyses. The mouse liver
Plasma-Seq conducted with blood from male individuals without cancer.
 Supplementary Figures Supplementary Figure 1 Plasma-Seq conducted with blood from male individuals without cancer. Copy number patterns established from plasma samples of male individuals without cancer
Supplementary Materials for
 www.sciencesignaling.org/cgi/content/full/7/310/ra11/dc1 Supplementary Materials for STAT3 Induction of mir-146b Forms a Feedback Loop to Inhibit the NF-κB to IL-6 Signaling Axis and STAT3-Driven Cancer
Supplementary Figure 1.TRIM33 binds β-catenin in the nucleus. a & b, Co-IP of endogenous TRIM33 with β-catenin in HT-29 cells (a) and HEK 293T cells
 and HEK 293T cells") Supplementary Figure 1.TRIM33 binds β-catenin in the nucleus. a & b, Co-IP of endogenous TRIM33 with β-catenin in HT-29 cells (a) and HEK 293T cells (b). TRIM33 was immunoprecipitated, and the amount of
Supplementary Figure 1.TRIM33 binds β-catenin in the nucleus. a & b, Co-IP of endogenous TRIM33 with β-catenin in HT-29 cells (a) and HEK 293T cells (b). TRIM33 was immunoprecipitated, and the amount of
For in vitro Veterinary Diagnostics only. Kylt Rotavirus A. Real-Time RT-PCR Detection.
 For in vitro Veterinary Diagnostics only. Kylt Rotavirus A Real-Time RT-PCR Detection www.kylt.eu DIRECTION FOR USE Kylt Rotavirus A Real-Time RT-PCR Detection A. General Kylt Rotavirus A products are
Inhibition of fatty acid oxidation as a therapy for MYC-overexpressing triplenegative
 SUPPLEMENTARY INFORMATION Inhibition of fatty acid oxidation as a therapy for MYC-overexpressing triplenegative breast cancer Roman Camarda, Alicia Y. Zhou, Rebecca A. Kohnz, Sanjeev Balakrishnan, Celine
Supplementary Information
 Supplementary Information Figure S1. Int6 gene silencing efficiency. (A) Western Blot analysis of Int6 expression at different times after sirna transfection. Int6 expression is strongly silenced in Int6
Supplemental Figure 1. Intracranial transduction of a modified ptomo lentiviral vector in the mouse
 Supplemental figure legends Supplemental Figure 1. Intracranial transduction of a modified ptomo lentiviral vector in the mouse hippocampus targets GFAP-positive but not NeuN-positive cells. (A) Stereotaxic
SUPPLEMENTAL TABLE AND FIGURES
 SUPPLEMENTAL TABLE AND FIGURES Zhang et al. (29) - Enzymes in the NAD + Salvage Pathway Regulate SIRT1 Activity at Target Gene Promoters This document contains supplemental data (1 table and 6 figures)
Supplementary Figure S1. Venn diagram analysis of mrna microarray data and mirna target analysis. (a) Western blot analysis of T lymphoblasts (CLS)
 Western blot analysis of T lymphoblasts (CLS)") Supplementary Figure S1. Venn diagram analysis of mrna microarray data and mirna target analysis. (a) Western blot analysis of T lymphoblasts (CLS) and their exosomes (EXO) in resting (REST) and activated
Supplementary Figure S1. Venn diagram analysis of mrna microarray data and mirna target analysis. (a) Western blot analysis of T lymphoblasts (CLS) and their exosomes (EXO) in resting (REST) and activated
Doctoral Degree Program in Marine Biotechnology, College of Marine Sciences, Doctoral Degree Program in Marine Biotechnology, Academia Sinica, Taipei,
 Cyclooxygenase 2 facilitates dengue virus replication and serves as a potential target for developing antiviral agents Chun-Kuang Lin 1,2, Chin-Kai Tseng 3,4, Yu-Hsuan Wu 3,4, Chih-Chuang Liaw 1,5, Chun-
BRaf V600E cooperates with Pten silencing to elicit metastatic melanoma (Nature Genetics Supplementary Information)
") BRaf V600E cooperates with Pten silencing to elicit metastatic melanoma (Nature Genetics Supplementary Information) David Dankort, David P. Curley, Robert A. Cartlidge, Betsy Nelson, Anthony N. Karnezis,
BRaf V600E cooperates with Pten silencing to elicit metastatic melanoma (Nature Genetics Supplementary Information) David Dankort, David P. Curley, Robert A. Cartlidge, Betsy Nelson, Anthony N. Karnezis,
A Hepatocyte Growth Factor Receptor (Met) Insulin Receptor hybrid governs hepatic glucose metabolism SUPPLEMENTARY FIGURES, LEGENDS AND METHODS
 Insulin Receptor hybrid governs hepatic glucose metabolism SUPPLEMENTARY FIGURES, LEGENDS AND METHODS") A Hepatocyte Growth Factor Receptor (Met) Insulin Receptor hybrid governs hepatic glucose metabolism Arlee Fafalios, Jihong Ma, Xinping Tan, John Stoops, Jianhua Luo, Marie C. DeFrances and Reza Zarnegar
A Hepatocyte Growth Factor Receptor (Met) Insulin Receptor hybrid governs hepatic glucose metabolism Arlee Fafalios, Jihong Ma, Xinping Tan, John Stoops, Jianhua Luo, Marie C. DeFrances and Reza Zarnegar
SUPPLEMENTARY INFORMATION
 SUPPLEMENTARY INFORMATION doi:10.10/nature10195 NCBI gene: Tagged Subunit(s: HA-Vpx; FLAG-Cul4 HA-DCAF1 FLAG-Cul4 HA-FLAG-Vpx Mock Vpx (SIVmac 100 (a ; 0.159 (b ; 0.05 DCAF1 DDB1 DDA1 Cul4A 1; 0.024591
DNA context and promoter activity affect gene expression in lentiviral vectors
 ACTA BIOMED 2008; 79: 192-196 Mattioli 1885 O R I G I N A L A R T I C L E DNA context and promoter activity affect gene expression in lentiviral vectors Gensheng Mao 1, Francesco Marotta 2, Jia Yu 3, Liang