a" b" 2N c" d" e" f" !!Aurora!A!!!CP110!
|
|
|
- Mary Curtis
- 5 years ago
- Views:
Transcription


 Comparative Genomic Hybridisation (CGH) analysis of DLD1 cells ( ) relative to a reference D ( ) and relative to")
 Cell cycle profile of early (p12; left) and late (p55; right) passage 2N and cells and CGH analysis of 2N and")
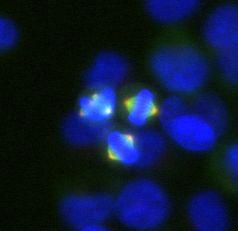
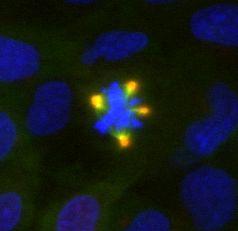
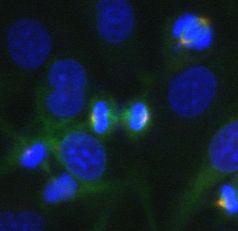
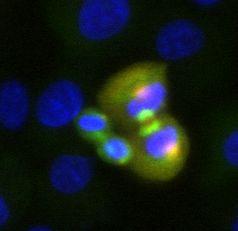
 Immunocytochemistry images of CA cells demonstrating asymmetrical clustering.")
1 DLD1/Reference a" 2N 2N 2N/DLD1 2N/ /DLD1 c" d" e" f" TargetID 2N.AVG_Sig 2N.Det Pval.AVG_Sig.Det Pval Diff Pval DiffScore SYMBOL ILMN_ KRTHA4 ILMN_ SLC2A3 ILMN_ PCGF4 ILMN_ RAB26 ILMN_ FGF20 ILMN_ RGL1 ILMN_ AKR1C3 ILMN_ SLC16A10 ILMN_ TSPAN3 ILMN_ NOV ILMN_ HIST2H4 ILMN_ E LOC ILMN_ E APIN ILMN_ E ABCB1 ILMN_ E METTL7B ILMN_ E CFTR ILMN_ E FAM112B ILMN_ E SGNE1 ILMN_ E TDO2! CA! D!>G2! no!dcb! 1.5%! 3.2%! Release!4h! 92.0%! :! Release!2d! 77.2%! 53.8%! Release!3d! 71.0%! :! Release!5d! 59.0%! :! Release!7d! 36.0%! 54.3%!!!Aurora!A!!!CP110! Release!17d! 13.3%! 42.5%! Release!25d! 5.8%! 42.8%! Supplementary Figure 1. Characterisation of DLD1 isogenic cell lines. (a) Comparative Genomic Hybridisation (CGH) analysis of DLD1 cells ( ) relative to a reference D ( ) and relative to early passage (p12) 2N and cells. (b) Cell cycle profile of early (p12; left) and late (p55; right) passage 2N and cells and CGH analysis of 2N and cells. (c) Parental DLD1, 2N, and CA cell growth rates. (d) Gene expression microarray analysis of 2N and cells. (e) Immunocytochemistry images of CA cells demonstrating asymmetrical clustering. (f) Pulse chase of 2N cells following 28h treatment with 5µM DCB; percentage of cells with multiple centrosomes (>2 centrosomes or >2 centrioles/ centrosome) across CA column and percentage of cells with D content higher than diploid G2 across D >G2 column.

\"*+,-.")


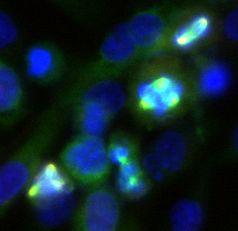
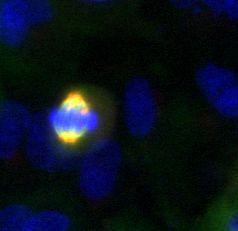
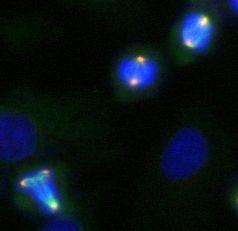
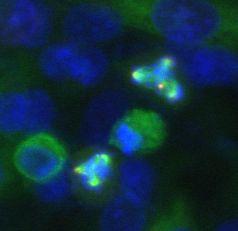
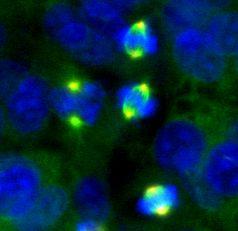
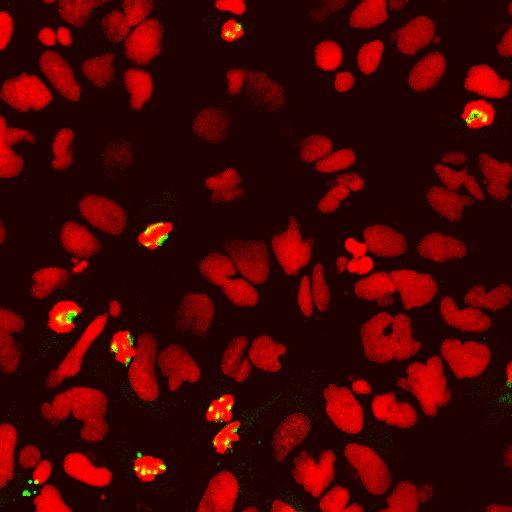
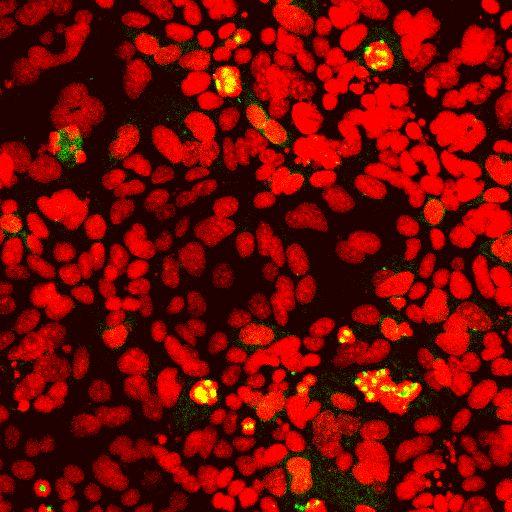
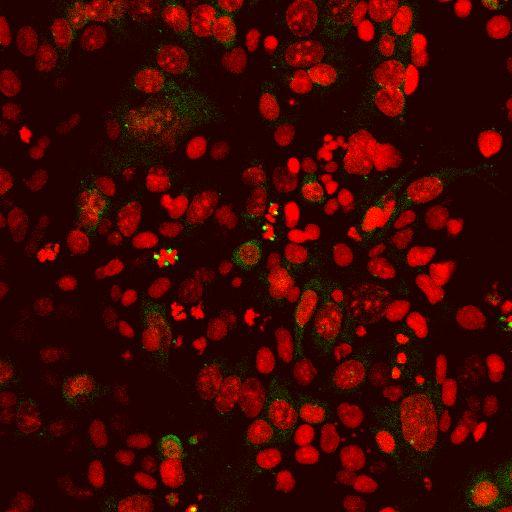
2 N 0.8 2N SF CA μ M SO 78 DM 8 sit OX M OC K d" e" CA siska2 sidnci2!"#$%&$'()"*+,-./0+ 1"'"#2&"+34"%$)53"+ 67('23$'89:+ 1"'"#2&"+)$;-#-)5+ <$73$(%*+ sidncl2a L 1 TR sic 0 0 sikifc1 CA SF c" CA a" siapc11 siapc5 siapc10 CA siactr1a siska3 f" Supplementary Figure 2. screening setup and hits. (a) Surviving fraction (SF) of 2N, and CA cells 96h after knocking down KIFC1 expression using 8 different oligos. (b) Surviving fraction (SF) of 2N, and CA cells after treatment with griseofulvin. (c) Immunocytochemistry images of cells treated with the positive control sikifc1. (d) Connectivity analysis of the hits from the screening overlaid by validation results. Coloured boxes indicate whether viability or phenotypic hits are confirmed by deconvolution of pool and/or chemical compound; pool results are shown where deconvolution was not performed. (e,f) Immunocytochemistry images of cells treated with the indicated representative hits. Cells were stained using Aurora A antibody (green) and propidium iodide (red).


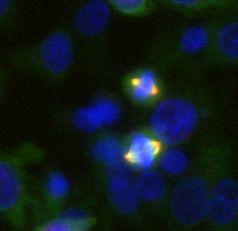

3 a" MDA MB468 SUM149 MDA MB453 T47D MDA MB231 BT549 DMSO!!Eg5!!!Aurora!A! protame ZR75.1 Hs578T MDA MB436 SUM159 MDA MB157 MDA MB361 DMSO protame sicdc2 siprc1 siespl1 CA Supplementary Figure 3. Mitotic spindle morphology in a panel of breast cancer cell lines treated with protame and false positives. (a) Immunocytochemistry images of cells treated with 20 µm protame for 24h. Cells were stained for Aurora A (red), Eg5 (green), and D using DAPI (blue). (b) Immunocytochemistry images or the indicated representative false positive hits. Cells were stained using Aurora A antibody (green) and propidium iodide (red).
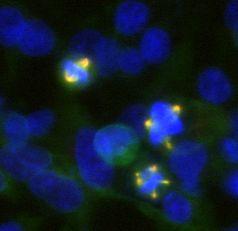
 Immunocytochemistry images of 2N cells transfected with the indicated s (pool and individual).")
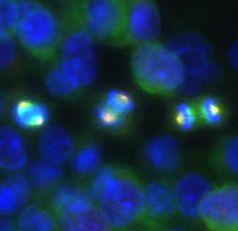
4 a" 100% 90% 80% 70% 60% 50% 40% 30% 20% 10% 0% sictrl CDC20 1 CDC20 2 CDC20 3 CDC20 4 CDC20pool CDC20p/MON5 CDC20p/MON15 CDH1 1 CDH1 2 CDH1 3 CDH1 4 CDH1pool CDH1p/MON5 CDH1p/MON15 2N!!!Eg5!!!Aurora!A! Supplementary Figure 4. Deconvolution of CDC20 pool and effect CDC20/CDH1 depletion in 2N cells. (a) Immunocytochemistry images of 2N cells transfected with the indicated s (pool and individual). pool-transfected cells were additionally treated with the indicated concentrations of monastrol. Cells were stained using specific antibodies against Eg5 (green), Aurora A (red) and DAPI for D (top). Quantification of bipolar, multipolar and monopolar spindles (n = >150 mitoses/ condition; bottom). (b) Immunoblot assays in lysates from sicdc20 transfected cells using the indicated pools or individual s. α-tubulin is used as loading control.
*+,-.+-/# 0123# 012(3# 45# 4560123# 456012(3# 789# 0:;<=>;.,# 0>*>=>;.,#?@=>;.")

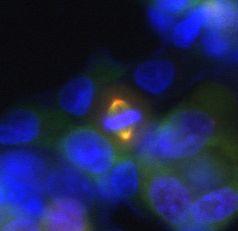
5 a" ($!"# (!!"# '!"# &!"# %!"# $!"#!"# )*+,-.+-/# 0123# 120% 100% 80% Asynchronous Nocodazole-released MG132-released 012(3# 45# # (3# 789# 5:;1<# ($!"# (!!"# '!"# &!"# %!"# $!"#!"# )*+,-.+-/# 0123# 012(3# 120% 45# # (3# 789# 5:;1<# ($!"# (!!"# 100%! CA! 80% '!"# &!"# %!"# $!"#!"# )*+,-.+-/# 0123# 012(3# 45# # (3# 789# 0:;<=>;.,# 60% 40% 20% 0% Untreated MON5 MON15 PT PT/MON5 PT/MON15 GSF TAXOL Multipolar Monopolar Bipolar 60% 40% 20% 0% Untreated MON5 MON15 PT PT/MON5 PT/MON15 GSF TAXOL Multipolar Monopolar Bipolar CA c" Overlay CP110 Eg5!!Eg5!!!Aurora!A!!!CP110!!!Eg5! Supplementary Figure 5. Effect of APC/C inhibition at different phases of the cell cycle in spindle multipolarity. (a) Quantification of bipolar, multipolar and monopolar mitoses in cells (corresponding to Fig. 3 a-c; n = >120 mitoses/condition). (b) Immunocytochemistry images of and CA cells after release from thymidine block and treated with the indicated compounds (right); quantification of bipolar, multipolar and monopolar mitoses in and CA cells (n = >120 mitoses/condition). Schematic of the treatment regimen used to assess the effect of the indicated compound treatment on spindle phenotype in and CA cells is shown (bottom). (c) Representative immunocytochemistry images (maximum projections of confocal z-stacks) of CA cells 20 h after release from 4 h MG132 block and treated with protame, experimental conditions are identical as in Figure 3c PT. PT=proTAME, MON=Monastrol


.")

6 Sor2ng!36h!a7er!transfec2on! 1!week!a7er!sor2ng! ΔCEg5BGFP! wteg5bgfp! GFP!nega2ve! Supplementary Figure 6. FACS sorting of Eg5-GFP populations. FACS sorting of 2N cells 36h after transfection with wteg5-gfp or ΔCEg5-GF at 36h after transfection (left; gate P4) and FACS analysis 7 days later (right). Untransfected 2N cells (GFP negative) are used as controls to determine GFP positive cells and are not sorted
\" *\" +\" #!")
\" 1 2 3 1 2 3 Mitosis Not measured 10 15 20 28 29 30 10 15 20 28 29 30 G1 c\" CDC27! High!")
 Corrected Total Fluorescence (CTF) measurements from 15 individual cells in mitosis and in the respective")
; CTF was measured in frames")
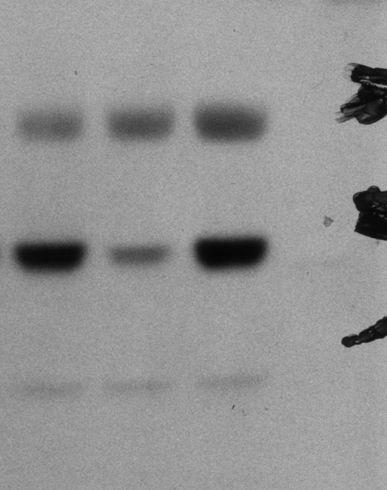
7 a" WTEg5-GFP ΔCEg5-GFP *!!!!" '$!!!!" )!!!!" '#!!!!" (!!!!" '!!!!!" CTF '!!!!" &!!!!" %!!!!",-./0-0" 1#" CTF &!!!!" %!!!!",-./0-0" 1'" $!!!!" $!!!!" #!!!!" #!!!!"!" #" $" %" &" '" (" )" *" +" #!" ##" #$" #%" #&" #'"!" '" #" (" $" )" %" *" &" +" '!" ''" '#" '(" '$" ')" Mitosis Not measured G1 c" CDC27! High! Exposure! Supplementary Figure 7. GFP Fluorescence measurements and in vitro ubiquitination assay. (a) Corrected Total Fluorescence (CTF) measurements from 15 individual cells in mitosis and in the respective daughter cells in G1 in WTEg5-GFP cells and ΔCEg5-GFP cells (top). Representative frames of WTEg5-GFP and ΔCEg5-GFP in mitosis and in G1 (bottom); CTF was measured in frames 1-3 (mitosis) and (G1) (b) Low exposure of blot shown in right panel of Fig. 4e. (c) High exposure of CDC27 blot shown in Figure 4d.

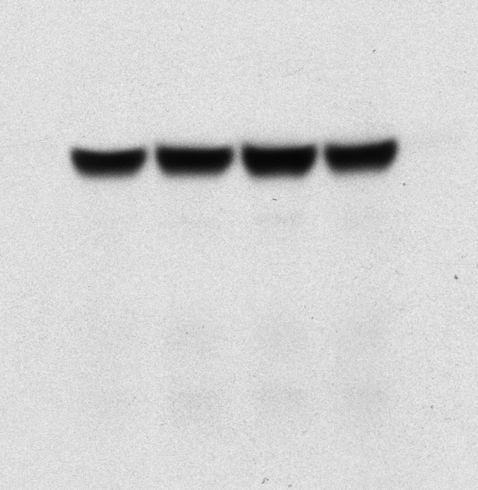
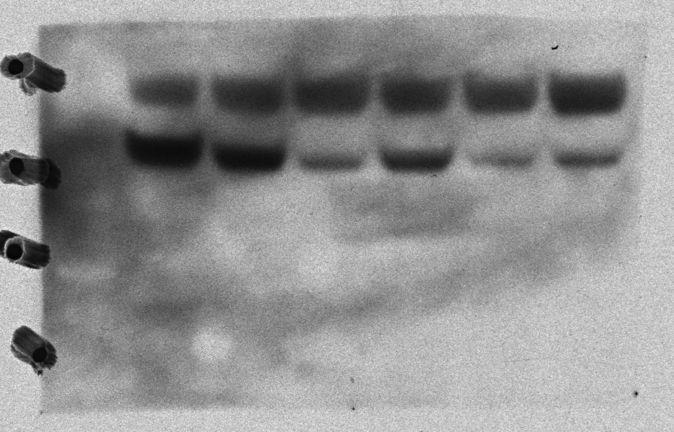
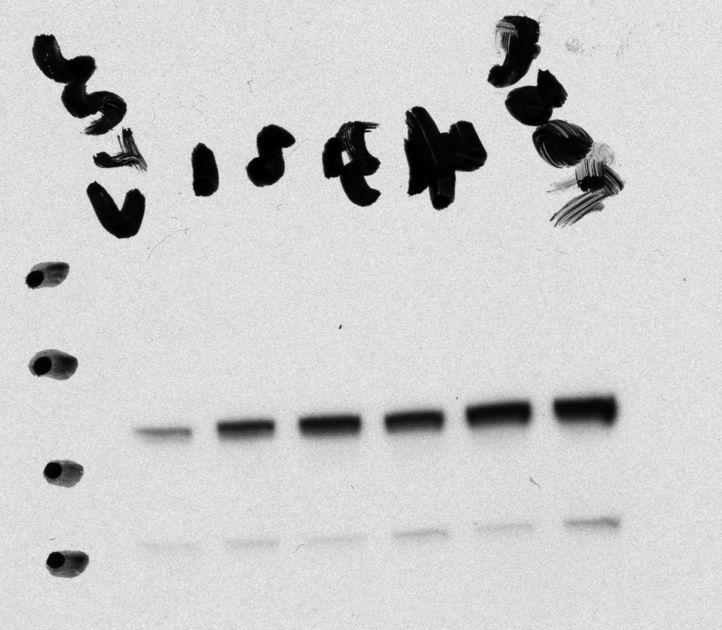
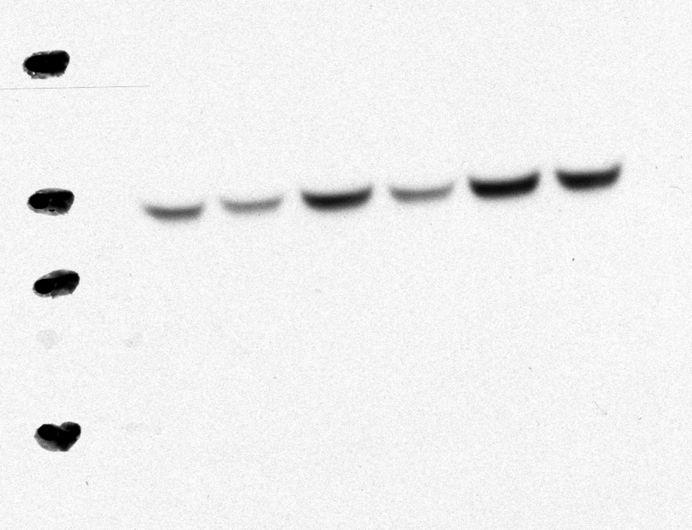
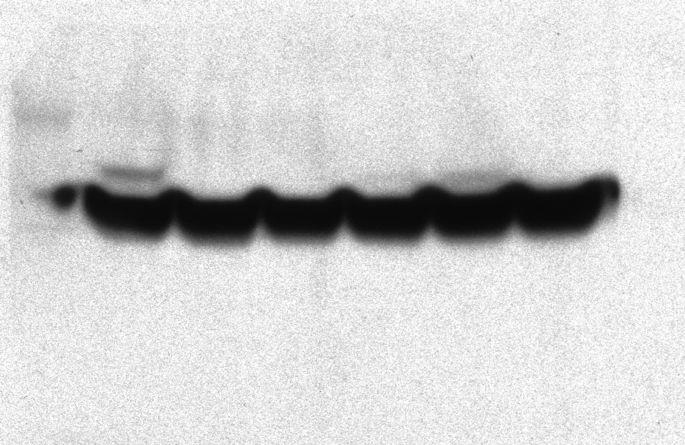
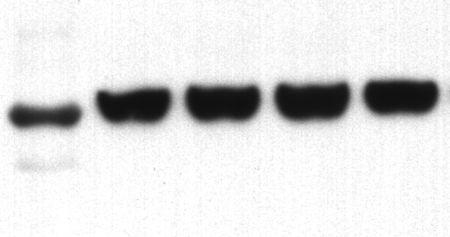
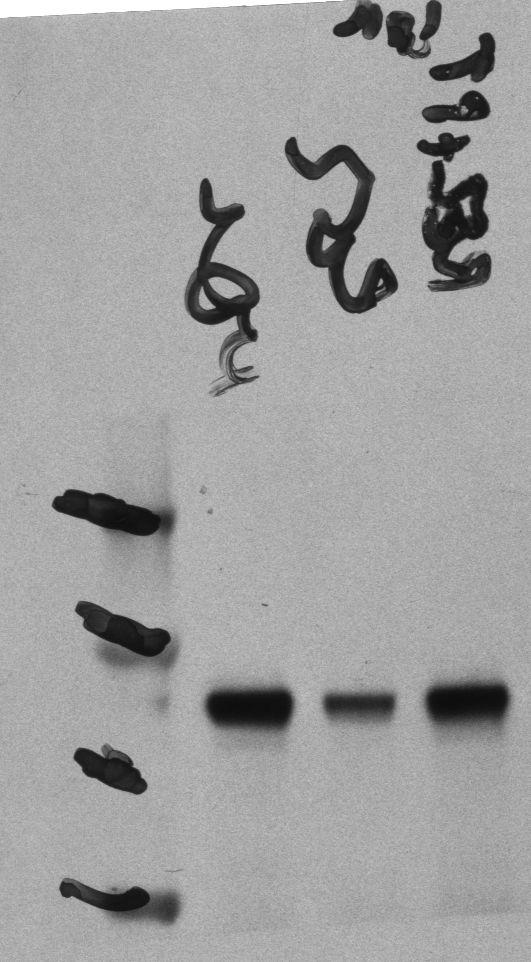
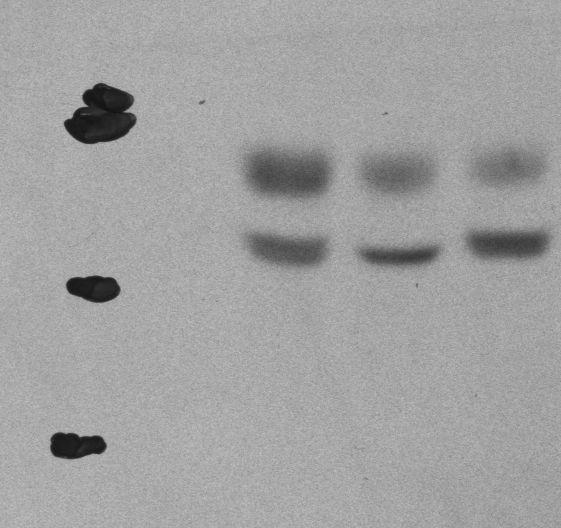
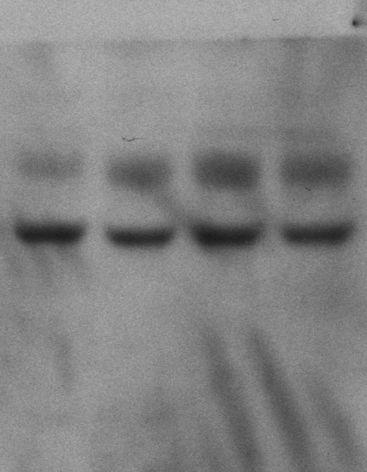

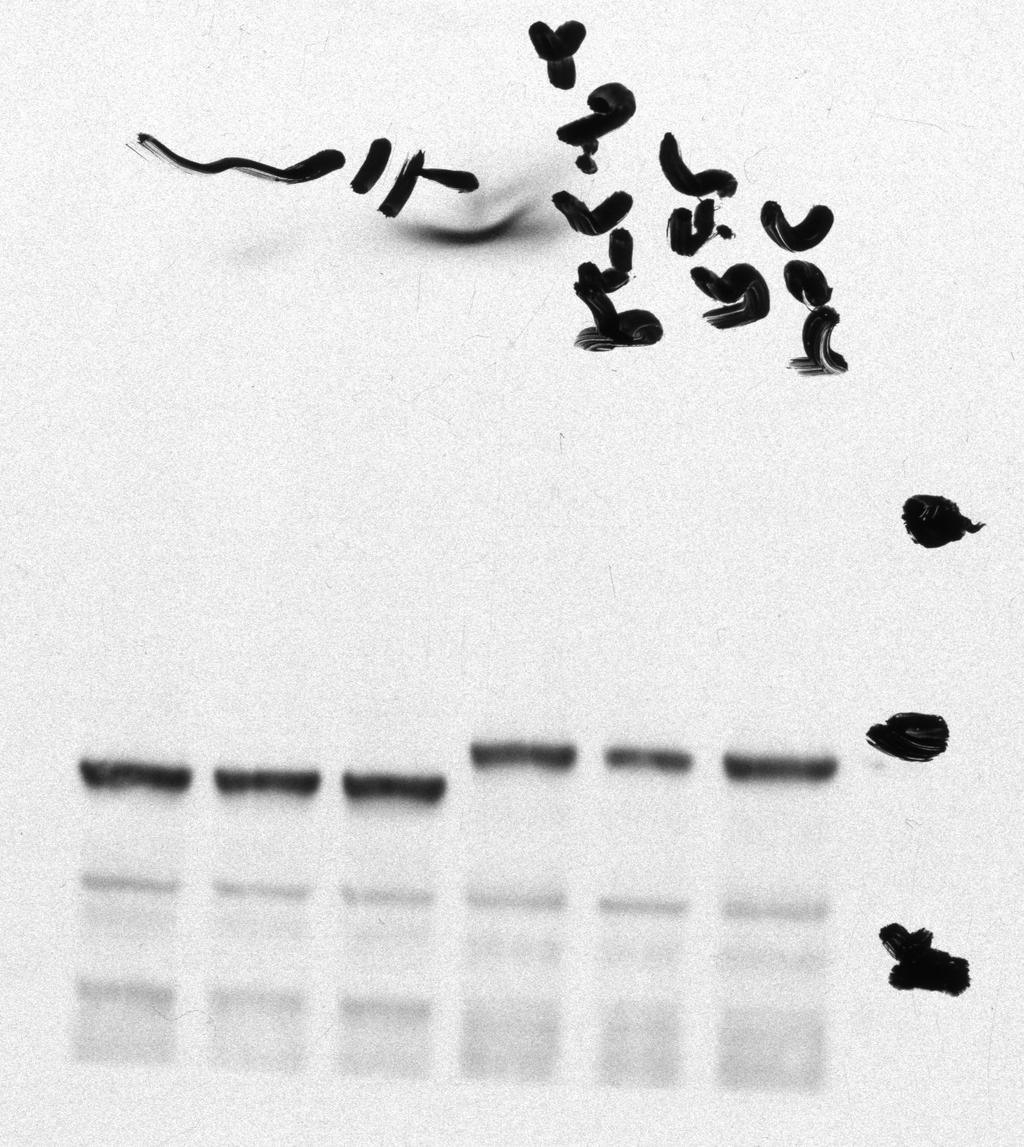
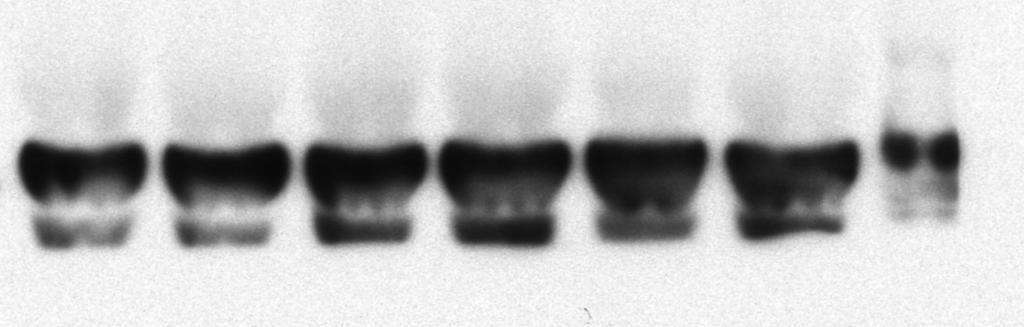
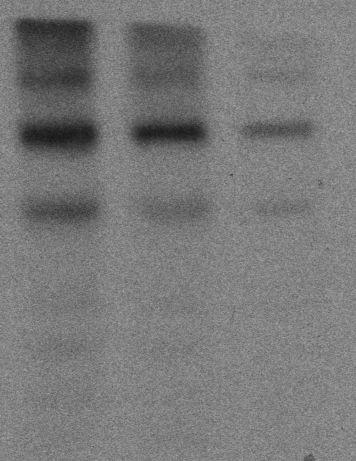
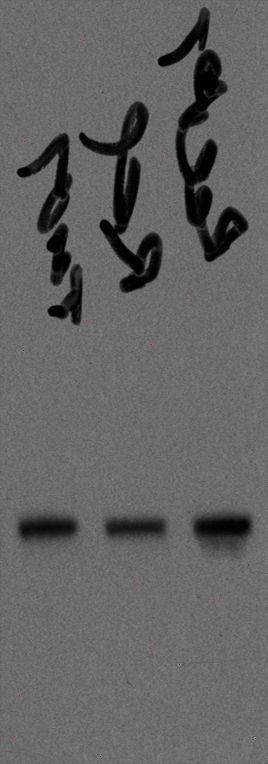
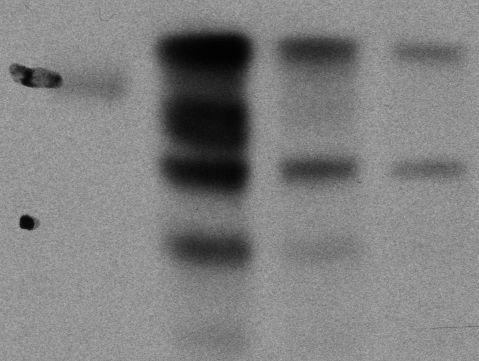
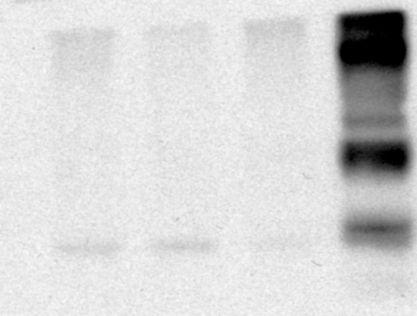
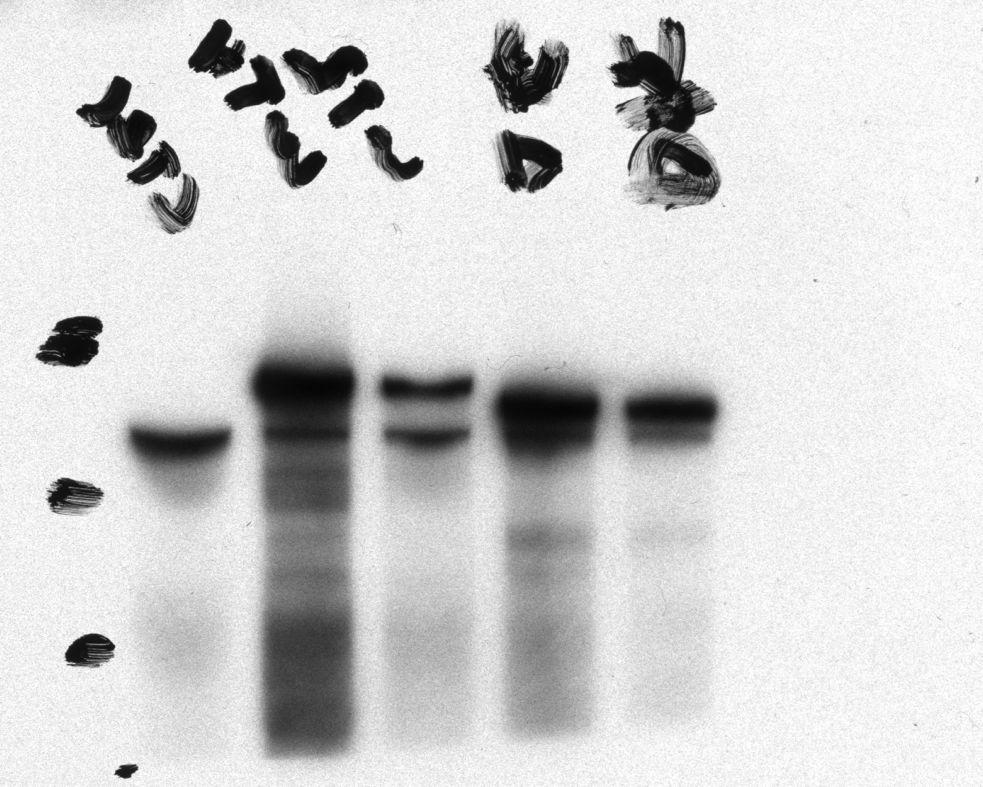
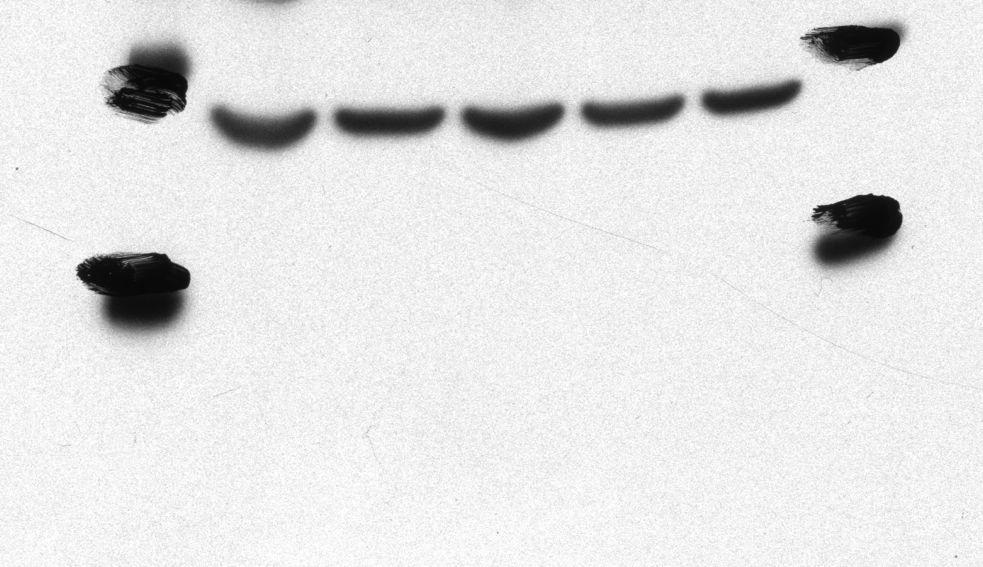
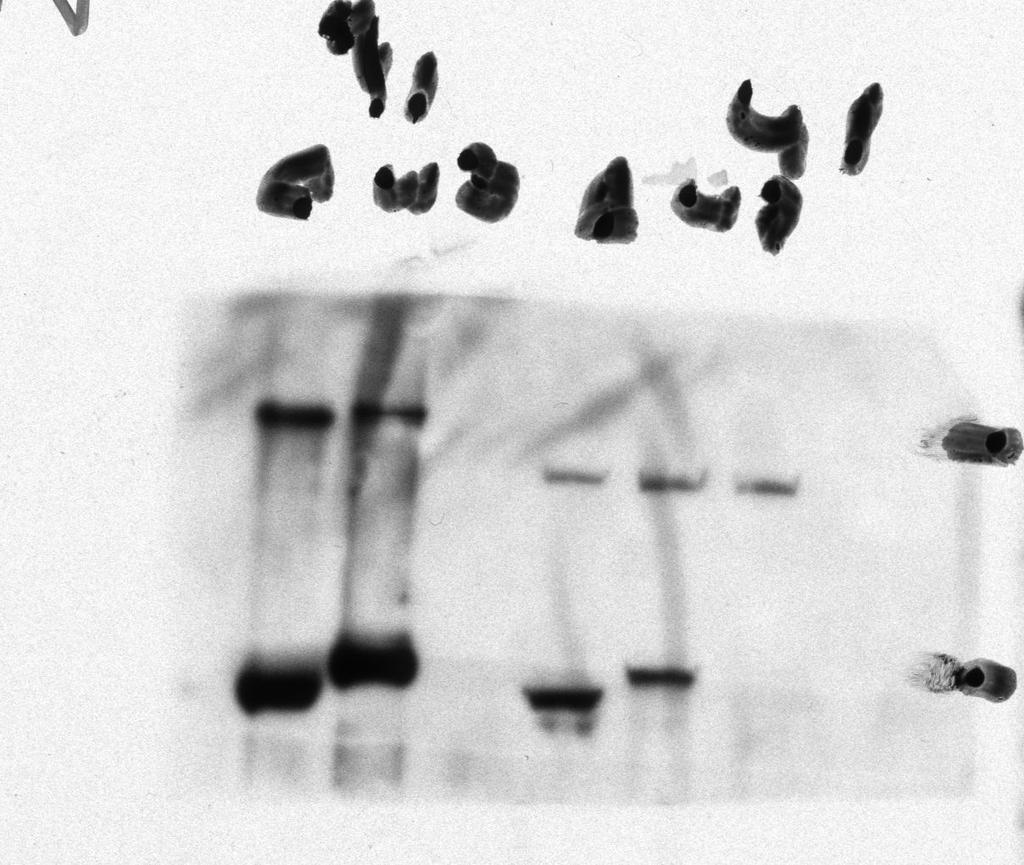
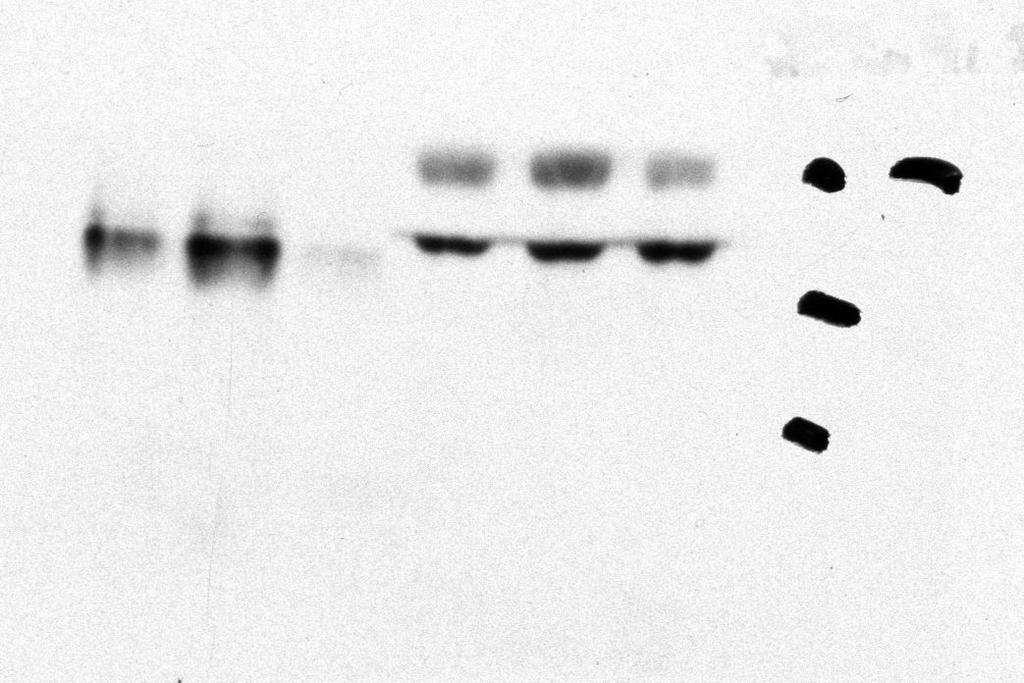
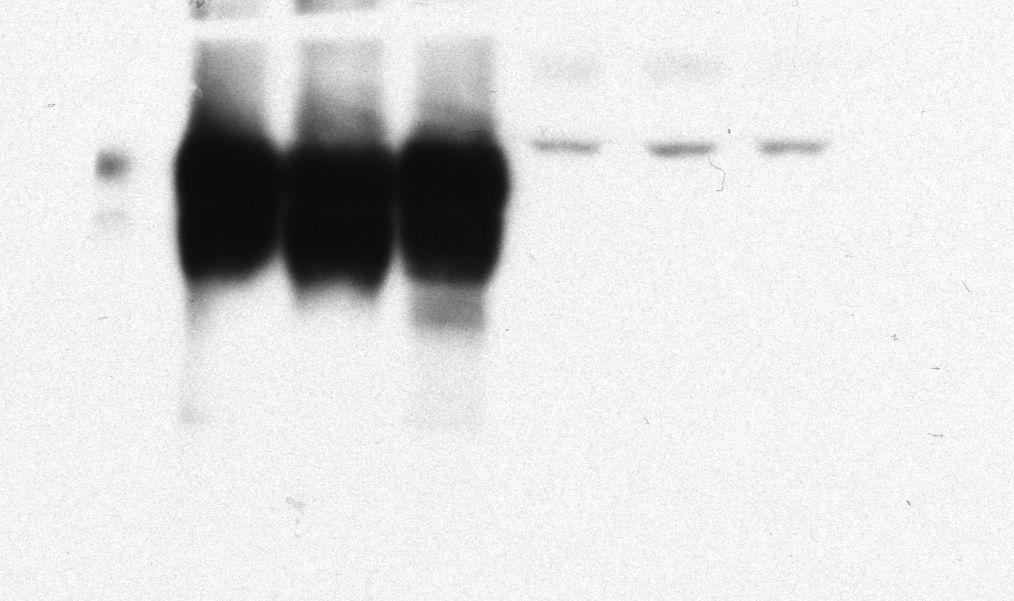
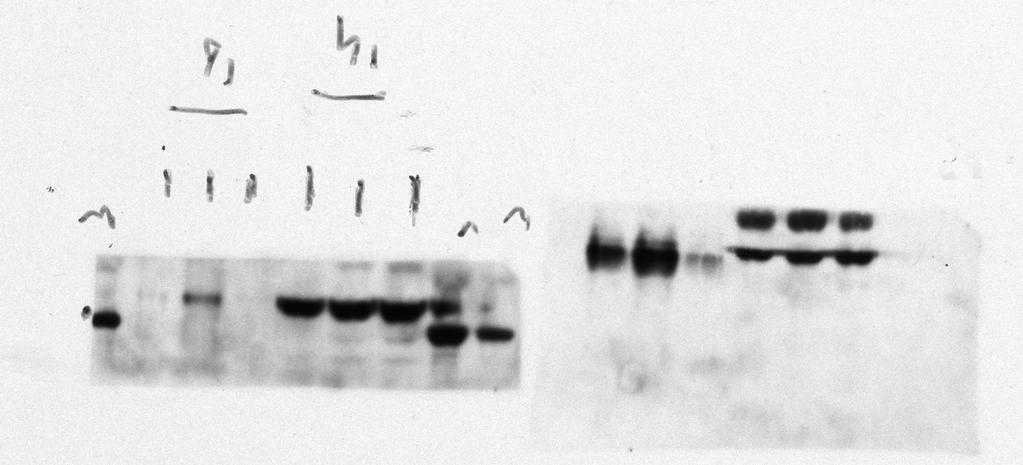
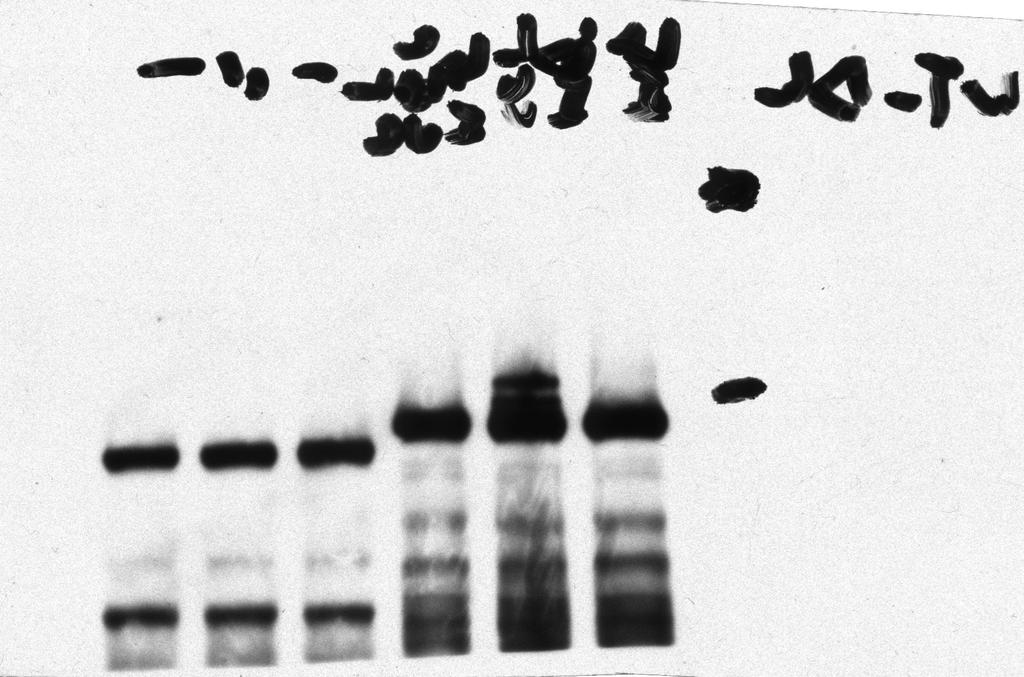
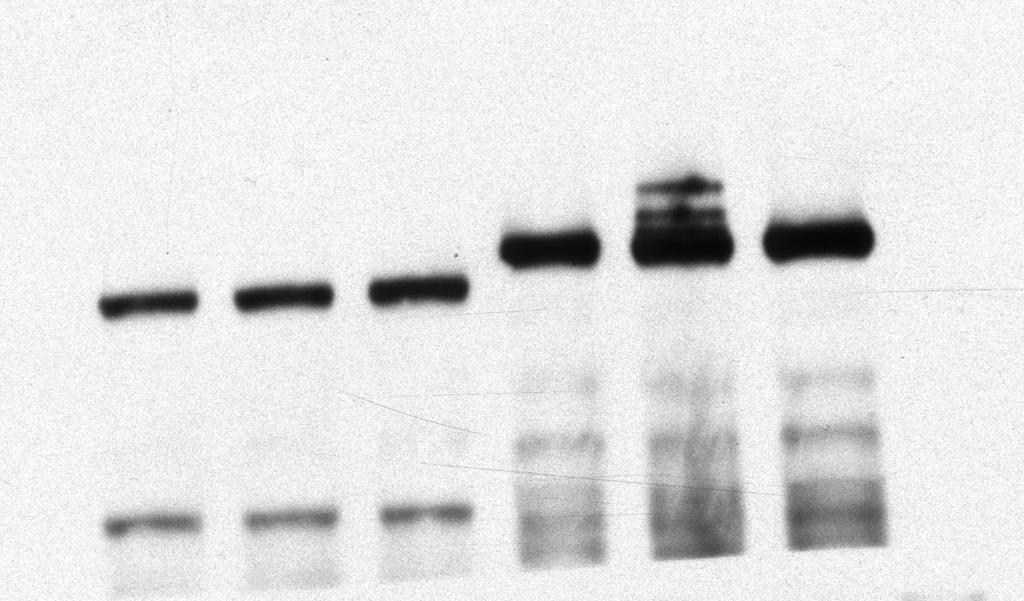
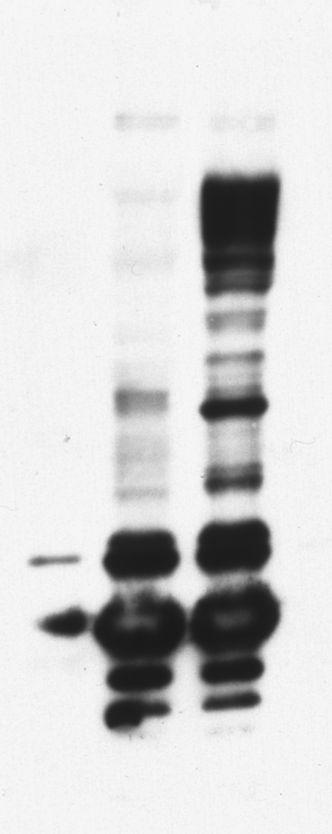
8 a" c" d" e" Supplementary Figure 8. Full scans of Blots blots shown in Figure 2c (a), 4b (b), 4c (c), 4d (d) and 4e (e)
9 Supplementary"Table"1."An5bodies"used"in"this"work."" Antigen Source Ig Source Dilution Catalogue No. Use Eg5 Mouse Abcam 1: WB Eg5 Mouse Abcam 1: IF Eg5 Mouse Santa Cruz 1:500 sc WB GFP Mouse Abcam 1:2000 ab1218 WB GFP Mouse Abcam 1:2000 ab1218 IF GFP Rabbit Abcam 1:3000 ab6556 IF GFP Rabbit Abcam 2 ug ab6556 IP Aurora A Mouse BD 1: WB Aurora A Mouse BD 1: IF CDC27 Mouse Abcam 1:1000 ab10538 WB CDH1 Mouse Abcam 1:1000 ab3242 WB CDC20 Rabbit Abcam 1:1000 ab26483 WB MPM2 Mouse Millipore 1: WB Tubulin Mouse Sigma 1:10000 T5168 WB FLAG Mouse Clontech 1: WB CP110 Rabbit Gift from E. Nigg 1: IF
SUPPLEMENTARY INFORMATION
 DOI: 10.1038/ncb3076 Supplementary Figure 1 btrcp targets Cep68 for degradation during mitosis. a) Cep68 immunofluorescence in interphase and metaphase. U-2OS cells were transfected with control sirna
Figure S1. HP1α localizes to centromeres in mitosis and interacts with INCENP. (A&B) HeLa
 HeLa") SUPPLEMENTARY FIGURES Figure S1. HP1α localizes to centromeres in mitosis and interacts with INCENP. (A&B) HeLa tet-on cells that stably express HP1α-CFP, HP1β-CFP, or HP1γ-CFP were monitored with livecell
SUPPLEMENTARY FIGURES Figure S1. HP1α localizes to centromeres in mitosis and interacts with INCENP. (A&B) HeLa tet-on cells that stably express HP1α-CFP, HP1β-CFP, or HP1γ-CFP were monitored with livecell
SUPPLEMENTARY INFORMATION
 DOI: 1.138/ncb222 / b. WB anti- WB anti- ulin Mitotic index (%) 14 1 6 2 T (h) 32 48-1 1 2 3 4 6-1 4 16 22 28 3 33 e. 6 4 2 Time (min) 1-6- 11-1 > 1 % cells Figure S1 depletion leads to mitotic defects
Supplementary information. The Light Intermediate Chain 2 Subpopulation of Dynein Regulates Mitotic. Spindle Orientation
 Supplementary information The Light Intermediate Chain 2 Subpopulation of Dynein Regulates Mitotic Spindle Orientation Running title: Dynein LICs distribute mitotic functions. Sagar Mahale a, d, *, Megha
Supplementary Figure S1
 Supplementary Figure S1 Supplementary Figure S1. PARP localization patterns using GFP-PARP and PARP-specific antibody libraries GFP-PARP localization in non-fixed (A) and formaldehyde fixed (B) GFP-PARPx
(a) Significant biological processes (upper panel) and disease biomarkers (lower panel)
 Significant biological processes (upper panel) and disease biomarkers (lower panel)") Supplementary Figure 1. Functional enrichment analyses of secretomic proteins. (a) Significant biological processes (upper panel) and disease biomarkers (lower panel) 2 involved by hrab37-mediated secretory
Supplementary Figure 1. Functional enrichment analyses of secretomic proteins. (a) Significant biological processes (upper panel) and disease biomarkers (lower panel) 2 involved by hrab37-mediated secretory
Supplemental Materials. STK16 regulates actin dynamics to control Golgi organization and cell cycle
 Supplemental Materials STK16 regulates actin dynamics to control Golgi organization and cell cycle Juanjuan Liu 1,2,3, Xingxing Yang 1,3, Binhua Li 1, Junjun Wang 1,2, Wenchao Wang 1, Jing Liu 1, Qingsong
Supplementary figures
 Supplementary figures Supplementary Figure 1. B cells stimulated with pokeweed mitogen display normal mitotic figures but not cells infected with B95-8. The figures show cells stimulated with pokeweed
Supplementary Figure 1.TRIM33 binds β-catenin in the nucleus. a & b, Co-IP of endogenous TRIM33 with β-catenin in HT-29 cells (a) and HEK 293T cells
 and HEK 293T cells") Supplementary Figure 1.TRIM33 binds β-catenin in the nucleus. a & b, Co-IP of endogenous TRIM33 with β-catenin in HT-29 cells (a) and HEK 293T cells (b). TRIM33 was immunoprecipitated, and the amount of
Supplementary Figure 1.TRIM33 binds β-catenin in the nucleus. a & b, Co-IP of endogenous TRIM33 with β-catenin in HT-29 cells (a) and HEK 293T cells (b). TRIM33 was immunoprecipitated, and the amount of
T H E J O U R N A L O F C E L L B I O L O G Y
 T H E J O U R N A L O F C E L L B I O L O G Y Supplemental material Dunsch et al., http://www.jcb.org/cgi/content/full/jcb.201202112/dc1 Figure S1. Characterization of HMMR and CHICA antibodies. (A) HeLa
Extracellular vesicles are transferred from melanocytes to keratinocytes after UVA irradiation
 Supplementary material; Title; Extracellular vesicles are transferred from melanocytes to keratinocytes after UVA irradiation Authors; Petra Wäster 1, Ida Eriksson 1, Linda Vainikka 1, Inger Rosdahl 2,
Nature Structural and Molecular Biology: doi: /nsmb Supplementary Figure 1
 Supplementary Figure 1 Mutational analysis of the SA2-Scc1 interaction in vitro and in human cells. (a) Autoradiograph (top) and Coomassie stained gel (bottom) of 35 S-labeled Myc-SA2 proteins (input)
Supporting Information
 Supporting Information ou et al..73/pnas.08791112 dd Thymidine Release & transfection dd Thymidine Release dd MG132 Fix and IF -14 h 0 h 8 h 24 h 34 h 36 h siontrol simps1-1 simps1-1 simps1-1 simps1-2
Tumor suppressor Spred2 interaction with LC3 promotes autophagosome maturation and induces autophagy-dependent cell death
 www.impactjournals.com/oncotarget/ Oncotarget, Supplementary Materials 2016 Tumor suppressor Spred2 interaction with LC3 promotes autophagosome maturation and induces autophagy-dependent cell death Supplementary
PKCζ Promotes Breast Cancer Invasion by Regulating Expression of E-cadherin and Zonula Occludens-1 (ZO-1) via NFκB-p65
 via NFκB-p65") SUPPLEMENTARY INFORMATION TITLE: PKCζ Promotes Breast Cancer Invasion by Regulating Expression of E-cadherin and Zonula Occludens-1 (ZO-1) via NFκB-p65 RUNNING TITLE: PKCζ-NFκB Signaling in Breast Cancer
SUPPLEMENTARY INFORMATION TITLE: PKCζ Promotes Breast Cancer Invasion by Regulating Expression of E-cadherin and Zonula Occludens-1 (ZO-1) via NFκB-p65 RUNNING TITLE: PKCζ-NFκB Signaling in Breast Cancer
SUPPLEMENTARY LEGENDS...
 TABLE OF CONTENTS SUPPLEMENTARY LEGENDS... 2 11 MOVIE S1... 2 FIGURE S1 LEGEND... 3 FIGURE S2 LEGEND... 4 FIGURE S3 LEGEND... 5 FIGURE S4 LEGEND... 6 FIGURE S5 LEGEND... 7 FIGURE S6 LEGEND... 8 FIGURE
(A) Dose response curves of HMLE_shGFP (blue circle), HMLE_shEcad (red square),
 Dose response curves of HMLE_shGFP (blue circle), HMLE_shEcad (red square),") Supplementary Figures and Tables Figure S1. Validation of EMT-selective small molecules (A) Dose response curves of HMLE_shGFP (blue circle), HMLE_shEcad (red square), and HMLE_Twist (black diamond) cells
Supplementary Figures and Tables Figure S1. Validation of EMT-selective small molecules (A) Dose response curves of HMLE_shGFP (blue circle), HMLE_shEcad (red square), and HMLE_Twist (black diamond) cells
Supplementary Figure 1: si-craf but not si-braf sensitizes tumor cells to radiation.
 Supplementary Figure 1: si-craf but not si-braf sensitizes tumor cells to radiation. (a) Embryonic fibroblasts isolated from wildtype (WT), BRAF -/-, or CRAF -/- mice were irradiated (6 Gy) and DNA damage
T H E J O U R N A L O F C E L L B I O L O G Y
 T H E J O U R N A L O F C E L L B I O L O G Y Supplemental material Krenn et al., http://www.jcb.org/cgi/content/full/jcb.201110013/dc1 Figure S1. Levels of expressed proteins and demonstration that C-terminal
Supplementary Materials
 Supplementary Materials Figure S1. MTT Cell viability assay. To measure the cytotoxic potential of the oxidative treatment, the MTT [3-(4,5-dimethylthiazol- 2-yl)-2,5-diphenyl tetrazolium bromide] assay
Supplementary Information POLO-LIKE KINASE 1 FACILITATES LOSS OF PTEN-INDUCED PROSTATE CANCER FORMATION
 Supplementary Information POLO-LIKE KINASE 1 FACILITATES LOSS OF PTEN-INDUCED PROSTATE CANCER FORMATION X. Shawn Liu 1, 3, Bing Song 2, 3, Bennett D. Elzey 3, 4, Timothy L. Ratliff 3, 4, Stephen F. Konieczny
SUPPLEMENTARY FIGURES
 SUPPLEMENTARY FIGURES 1 Supplementary Figure 1, Adult hippocampal QNPs and TAPs uniformly express REST a-b) Confocal images of adult hippocampal mouse sections showing GFAP (green), Sox2 (red), and REST
supplementary information
 DOI: 10.1038/ncb2133 Figure S1 Actomyosin organisation in human squamous cell carcinoma. (a) Three examples of actomyosin organisation around the edges of squamous cell carcinoma biopsies are shown. Myosin
IP: anti-gfp VPS29-GFP. IP: anti-vps26. IP: anti-gfp - + +
 FAM21 Strump. WASH1 IP: anti- 1 2 3 4 5 6 FAM21 Strump. FKBP IP: anti-gfp VPS29- GFP GFP-FAM21 tail H H/P P H H/P P c FAM21 FKBP Strump. VPS29-GFP IP: anti-gfp 1 2 3 FKBP VPS VPS VPS VPS29 1 = VPS29-GFP
293T cells were transfected with indicated expression vectors and the whole-cell extracts were subjected
 SUPPLEMENTARY INFORMATION Supplementary Figure 1. Formation of a complex between Slo1 and CRL4A CRBN E3 ligase. (a) HEK 293T cells were transfected with indicated expression vectors and the whole-cell
Prolonged mitotic arrest induces a caspase-dependent DNA damage
 SUPPLEMENTARY INFORMATION Prolonged mitotic arrest induces a caspase-dependent DNA damage response at telomeres that determines cell survival Karolina O. Hain, Didier J. Colin, Shubhra Rastogi, Lindsey
a b G75 G60 Sw-2 Sw-1 Supplementary Figure 1. Structure predictions by I-TASSER Server.
 a b G75 2 2 G60 Sw-2 Sw-1 Supplementary Figure 1. Structure predictions by I-TASSER Server. a. Overlay of top 10 models generated by I-TASSER illustrates the potential effect of 7 amino acid insertion
T H E J O U R N A L O F C E L L B I O L O G Y
 T H E J O U R N A L O F C E L L B I O L O G Y Supplemental material Lu et al., http://www.jcb.org/cgi/content/full/jcb.201012063/dc1 Figure S1. Kinetics of nuclear envelope assembly, recruitment of Nup133
SUPPLEMENTARY INFORMATION
 DOI: 10.1038/ncb2607 Figure S1 Elf5 loss promotes EMT in mammary epithelium while Elf5 overexpression inhibits TGFβ induced EMT. (a, c) Different confocal slices through the Z stack image. (b, d) 3D rendering
WDR62 is associated with the spindle pole and mutated in human microcephaly
 WDR62 is associated with the spindle pole and mutated in human microcephaly Adeline K. Nicholas, Maryam Khurshid, Julie Désir, Ofélia P. Carvalho, James J. Cox, Gemma Thornton, Rizwana Kausar, Muhammad
(a) Schematic diagram of the FS mutation of UVRAG in exon 8 containing the highly instable
 Schematic diagram of the FS mutation of UVRAG in exon 8 containing the highly instable") Supplementary Figure 1. Frameshift (FS) mutation in UVRAG. (a) Schematic diagram of the FS mutation of UVRAG in exon 8 containing the highly instable A 10 DNA repeat, generating a premature stop codon
Supplementary Figure 1. Frameshift (FS) mutation in UVRAG. (a) Schematic diagram of the FS mutation of UVRAG in exon 8 containing the highly instable A 10 DNA repeat, generating a premature stop codon
Supplementary Information Supplementary Fig. 1. Elevated Usp9x in melanoma and NRAS mutant melanoma cells are dependent on NRAS for 3D growth.
 Supplementary Information Supplementary Fig. 1. Elevated Usp9x in melanoma and NRAS mutant melanoma cells are dependent on NRAS for 3D growth. a. Immunoblot for Usp9x protein in NRAS mutant melanoma cells
TFEB-mediated increase in peripheral lysosomes regulates. Store Operated Calcium Entry
 TFEB-mediated increase in peripheral lysosomes regulates Store Operated Calcium Entry Luigi Sbano, Massimo Bonora, Saverio Marchi, Federica Baldassari, Diego L. Medina, Andrea Ballabio, Carlotta Giorgi
Downregulation of the small GTPase SAR1A: a key event underlying alcohol-induced Golgi fragmentation in hepatocytes
 Downregulation of the small GTPase SAR1A: a key event underlying alcohol-induced Golgi fragmentation in hepatocytes Armen Petrosyan 1*, Pi-Wan Cheng 1,3, Dahn L. Clemens 2,3 & Carol A. Casey 2,3 1 Department
Boucher et al NCOMMS B
 1 Supplementary Figure 1 (linked to Figure 1). mvegfr1 constitutively internalizes in endothelial cells. (a) Immunoblot of mflt1 from undifferentiated mouse embryonic stem (ES) cells with indicated genotypes;
Supplementary Figure 1: Characterisation of phospho-fgfr-y463 antibody. (A)
") Supplementary Figure 1: Characterisation of phospho-fgfr-y463 antibody. (A) Cells over-expressing hfgfr1-pcdna3 (+) or pcdna3 (-) were stimulated for 10 minutes with 50ng/ml FGF2 and lysates immunoblotted
Supplementary Figure 1: Characterisation of phospho-fgfr-y463 antibody. (A) Cells over-expressing hfgfr1-pcdna3 (+) or pcdna3 (-) were stimulated for 10 minutes with 50ng/ml FGF2 and lysates immunoblotted
Supplementary Figure 1. Mother centrioles can reduplicate while in the close association
 C1-GFP distance (nm) C1-GFP distance (nm) a arrested HeLa cell expressing C1-GFP and Plk1TD-RFP -3 s 1 2 3 4 5 6 7 8 9 11 12 13 14 16 17 18 19 2 21 22 23 24 26 27 28 29 3 b 9 8 7 6 5 4 3 2 arrested HeLa
File Name: Supplementary Information Description: Supplementary Figures and Supplementary Tables. File Name: Peer Review File Description:
 File Name: Supplementary Information Description: Supplementary Figures and Supplementary Tables File Name: Peer Review File Description: Primer Name Sequence (5'-3') AT ( C) RT-PCR USP21 F 5'-TTCCCATGGCTCCTTCCACATGAT-3'
Tankyrase 1 regulates centrosome function by controlling CPAP stability
 Manuscript EMBOR-2011-35655 Tankyrase 1 regulates centrosome function by controlling CPAP stability Mi Kyung Kim, Charles Dudognon and Susan Smith Corresponding author: Susan Smith, The Skirball Institute
Supplementary Figure 1 Induction of cellular senescence and isolation of exosome. a to c, Pre-senescent primary normal human diploid fibroblasts
 Supplementary Figure 1 Induction of cellular senescence and isolation of exosome. a to c, Pre-senescent primary normal human diploid fibroblasts (TIG-3 cells) were rendered senescent by either serial passage
Effects of UBL5 knockdown on cell cycle distribution and sister chromatid cohesion
 Supplementary Figure S1. Effects of UBL5 knockdown on cell cycle distribution and sister chromatid cohesion A. Representative examples of flow cytometry profiles of HeLa cells transfected with indicated
(A) SW480, DLD1, RKO and HCT116 cells were treated with DMSO or XAV939 (5 µm)
 SW480, DLD1, RKO and HCT116 cells were treated with DMSO or XAV939 (5 µm)") Supplementary Figure Legends Figure S1. Tankyrase inhibition suppresses cell proliferation in an axin/β-catenin independent manner. (A) SW480, DLD1, RKO and HCT116 cells were treated with DMSO or XAV939
Supplementary Figure Legends Figure S1. Tankyrase inhibition suppresses cell proliferation in an axin/β-catenin independent manner. (A) SW480, DLD1, RKO and HCT116 cells were treated with DMSO or XAV939
T H E J O U R N A L O F C E L L B I O L O G Y
 T H E J O U R N A L O F C E L L B I O L O G Y Supplemental material Posch et al., http://www.jcb.org/cgi/content/full/jcb.200912046/dc1 Figure S1. Biochemical characterization of the interaction between
SUPPLEMENTARY INFORMATION
 DOI: 10.1038/ncb2566 Figure S1 CDKL5 protein expression pattern and localization in mouse brain. (a) Multiple-tissue western blot from a postnatal day (P) 21 mouse probed with an antibody against CDKL5.
Type of file: PDF Title of file for HTML: Supplementary Information Description: Supplementary Figures
 Type of file: PDF Title of file for HTML: Supplementary Information Description: Supplementary Figures Type of file: MOV Title of file for HTML: Supplementary Movie 1 Description: NLRP3 is moving along
Supplementary Figure 1. HOPX is hypermethylated in NPC. (a) Methylation levels of HOPX in Normal (n = 24) and NPC (n = 24) tissues from the
 Methylation levels of HOPX in Normal (n = 24) and NPC (n = 24) tissues from the") Supplementary Figure 1. HOPX is hypermethylated in NPC. (a) Methylation levels of HOPX in Normal (n = 24) and NPC (n = 24) tissues from the genome-wide methylation microarray data. Mean ± s.d.; Student
Supplementary Figure 1. HOPX is hypermethylated in NPC. (a) Methylation levels of HOPX in Normal (n = 24) and NPC (n = 24) tissues from the genome-wide methylation microarray data. Mean ± s.d.; Student
Supplementary Figure 1. Spatial distribution of LRP5 and β-catenin in intact cardiomyocytes. (a) and (b) Immunofluorescence staining of endogenous
 and (b) Immunofluorescence staining of endogenous") Supplementary Figure 1. Spatial distribution of LRP5 and β-catenin in intact cardiomyocytes. (a) and (b) Immunofluorescence staining of endogenous LRP5 in intact adult mouse ventricular myocytes (AMVMs)
Supplementary Figure 1. Spatial distribution of LRP5 and β-catenin in intact cardiomyocytes. (a) and (b) Immunofluorescence staining of endogenous LRP5 in intact adult mouse ventricular myocytes (AMVMs)
Supplementary Figure (OH) 22 nanoparticles did not affect cell viability and apoposis. MDA-MB-231, MCF-7, MCF-10A and BT549 cells were
 22 nanoparticles did not affect cell viability and apoposis. MDA-MB-231, MCF-7, MCF-10A and BT549 cells were") Supplementary Figure 1. Gd@C 82 (OH) 22 nanoparticles did not affect cell viability and apoposis. MDA-MB-231, MCF-7, MCF-10A and BT549 cells were treated with PBS, Gd@C 82 (OH) 22, C 60 (OH) 22 or GdCl
Supplementary Figure 1. Gd@C 82 (OH) 22 nanoparticles did not affect cell viability and apoposis. MDA-MB-231, MCF-7, MCF-10A and BT549 cells were treated with PBS, Gd@C 82 (OH) 22, C 60 (OH) 22 or GdCl
Supplementary Figure 1 Chemokine and chemokine receptor expression during muscle regeneration (a) Analysis of CR3CR1 mrna expression by real time-pcr
 Analysis of CR3CR1 mrna expression by real time-pcr") Supplementary Figure 1 Chemokine and chemokine receptor expression during muscle regeneration (a) Analysis of CR3CR1 mrna expression by real time-pcr at day 0, 1, 4, 10 and 21 post- muscle injury. (b)
Supplementary Figure 1 Chemokine and chemokine receptor expression during muscle regeneration (a) Analysis of CR3CR1 mrna expression by real time-pcr at day 0, 1, 4, 10 and 21 post- muscle injury. (b)
SUPPLEMENTARY INFORMATION
 SUPPLEENTRY INFORTION DOI: 1.138/ncb2577 Early Telophase Late Telophase B icrotubules within the ICB (percent of total cells in telophase) D G ultinucleate cells (% total) 8 6 4 2 2 15 1 5 T without gaps
Supplementary Information
 Supplementary Information Targeted Disruption of the EZH2/EED Complex Inhibits EZH2- dependent Cancer Woojin Kim 1,2,3, Gregory H. Bird 2,3,4, Tobias Neff 5, Guoji Guo 1,2,3, Marc A. Kerenyi 1,2,3, Loren
SUPPLEMENTARY INFORMATION
 sirna pool: Control Tetherin -HA-GFP HA-Tetherin -Tubulin Supplementary Figure S1. Knockdown of HA-tagged tetherin expression by tetherin specific sirnas. HeLa cells were cotransfected with plasmids expressing
T H E J O U R N A L O F C E L L B I O L O G Y
 T H E J O U R N A L O F C E L L B I O L O G Y Supplemental material Courtheoux et al., http://www.jcb.org/cgi/content/full/jcb.200902093/dc1 S1 Figure S2. Visualization of multiple merotelic attachments.
SUPPLEMENTARY FIGURES
 SUPPLEMENTARY FIGURES Supplementary Figure 1. (A) Left, western blot analysis of ISGylated proteins in Jurkat T cells treated with 1000U ml -1 IFN for 16h (IFN) or left untreated (CONT); right, western
Supplemental Information. Supernumerary Centrosomes. Nucleate Extra Cilia and Compromise. Primary Cilium Signaling. Current Biology, Volume 22
 Current Biology, Volume 22 Supplemental Information Supernumerary Centrosomes Nucleate Extra Cilia and Compromise Primary Cilium Signaling Moe R. Mahjoub and Tim Stearns Supplemental Inventory 1. Supplemental
Supplementary Figure 1
 Supplementary Figure 1 AAV-GFP injection in the MEC of the mouse brain C57Bl/6 mice at 4 months of age were injected with AAV-GFP into the MEC and sacrificed at 7 days post injection (dpi). (a) Brains
Nature Immunology: doi: /ni.3631
 Supplementary Figure 1 SPT analyses of Zap70 at the T cell plasma membrane. (a) Total internal reflection fluorescent (TIRF) excitation at 64-68 degrees limits single molecule detection to 100-150 nm above
Supplementary Fig. 1 p38 MAPK negatively regulates DC differentiation. (a) Western blot analysis of p38 isoform expression in BM cells, immature DCs
 Western blot analysis of p38 isoform expression in BM cells, immature DCs") Supplementary Fig. 1 p38 MAPK negatively regulates DC differentiation. (a) Western blot analysis of p38 isoform expression in BM cells, immature DCs (idcs) and mature DCs (mdcs). A myeloma cell line expressing
Supplementary Fig. 1 p38 MAPK negatively regulates DC differentiation. (a) Western blot analysis of p38 isoform expression in BM cells, immature DCs (idcs) and mature DCs (mdcs). A myeloma cell line expressing
A new subtype of progenitor cell in the mouse embryonic neocortex. Xiaoqun Wang, Jin-Wu Tsai, Bridget LaMonica & Arnold R.
 A new subtype of progenitor cell in the mouse embryonic neocortex Xiaoqun Wang, Jin-Wu Tsai, Bridget LaMonica & Arnold R. Kriegstein Supplementary Figures 1-6: Supplementary Movies 1-9: Supplementary
MicroRNA sponges: competitive inhibitors of small RNAs in mammalian cells
 MicroRNA sponges: competitive inhibitors of small RNAs in mammalian cells Margaret S Ebert, Joel R Neilson & Phillip A Sharp Supplementary figures and text: Supplementary Figure 1. Effect of sponges on
Supplementary Information for. Shi and King, Chromosome Nondisjunction Yields Tetraploid Rather than Aneuploid Cells in Human Cell Lines.
 Supplementary Information for Shi and King, Chromosome Nondisjunction Yields Tetraploid Rather than Aneuploid Cells in Human Cell Lines Contains Supplementary Methods Supplementary Figures 1-7 Supplementary
SUPPLEMENTARY INFORMATION
 SUPPLEMENTARY INFORMATION doi:10.1038/nature11429 S1a 6 7 8 9 Nlrc4 allele S1b Nlrc4 +/+ Nlrc4 +/F Nlrc4 F/F 9 Targeting construct 422 bp 273 bp FRT-neo-gb-PGK-FRT 3x.STOP S1c Nlrc4 +/+ Nlrc4 F/F casp1
Supplementary Figure 1. PD-L1 is glycosylated in cancer cells. (a) Western blot analysis of PD-L1 in breast cancer cells. (b) Western blot analysis
 Western blot analysis of PD-L1 in breast cancer cells. (b) Western blot analysis") Supplementary Figure 1. PD-L1 is glycosylated in cancer cells. (a) Western blot analysis of PD-L1 in breast cancer cells. (b) Western blot analysis of PD-L1 in ovarian cancer cells. (c) Western blot analysis
Supplementary Figure 1. PD-L1 is glycosylated in cancer cells. (a) Western blot analysis of PD-L1 in breast cancer cells. (b) Western blot analysis of PD-L1 in ovarian cancer cells. (c) Western blot analysis
Supplementary Figure 1. The CagA-dependent wound healing or transwell migration of gastric cancer cell. AGS cells transfected with vector control or
 Supplementary Figure 1. The CagA-dependent wound healing or transwell migration of gastric cancer cell. AGS cells transfected with vector control or 3xflag-CagA expression vector were wounded using a pipette
Supplementary information
 Supplementary information Exosomes mediate the cell-to-cell transmission of interferon alpha-induced antiviral activity Jianhua Li, Kuancheng Liu, Yang Liu, Yan Xu, Fei Zhang, Huijuan Yang, Jiangxia Liu,
p = formed with HCI-001 p = Relative # of blood vessels that formed with HCI-002 Control Bevacizumab + 17AAG Bevacizumab 17AAG
 A.. Relative # of ECs associated with HCI-001 1.4 1.2 1.0 0.8 0.6 0.4 0.2 0.0 ol b p < 0.001 Relative # of blood vessels that formed with HCI-001 1.4 1.2 1.0 0.8 0.6 0.4 0.2 0.0 l b p = 0.002 Control IHC:
Supplemental Figure 1. Intracranial transduction of a modified ptomo lentiviral vector in the mouse
 Supplemental figure legends Supplemental Figure 1. Intracranial transduction of a modified ptomo lentiviral vector in the mouse hippocampus targets GFAP-positive but not NeuN-positive cells. (A) Stereotaxic
Figure S1: Effects on haptotaxis are independent of effects on cell velocity A)
") Supplemental Figures Figure S1: Effects on haptotaxis are independent of effects on cell velocity A) Velocity of MV D7 fibroblasts expressing different GFP-tagged Ena/VASP family proteins in the haptotaxis
Supplemental Figures Figure S1: Effects on haptotaxis are independent of effects on cell velocity A) Velocity of MV D7 fibroblasts expressing different GFP-tagged Ena/VASP family proteins in the haptotaxis
Supplementary Figure 1
 Supplementary Figure 1 Supplementary Figure 1. Neither the activation nor suppression of the MAPK pathway affects the ASK1/Vif interaction. (a, b) HEK293 cells were cotransfected with plasmids encoding
Supplementary Table; Supplementary Figures and legends S1-S21; Supplementary Materials and Methods
 Silva et al. PTEN posttranslational inactivation and hyperactivation of the PI3K/Akt pathway sustain primary T cell leukemia viability Supplementary Table; Supplementary Figures and legends S1-S21; Supplementary
TITLE: Crosstalk Between Cancer Cells and Bones Via the Hedgehog Pathway Determines Bone Metastasis of Breast Cancer
 AD Award Number: W81XWH-07-1-0400 TITLE: Crosstalk Between Cancer Cells and Bones Via the Hedgehog Pathway Determines Bone Metastasis of Breast Cancer PRINCIPAL INVESTIGATOR: Dr. Lalita Shevde-Samantrese
GFP-LC3 +/+ CLU -/- kda CLU GFP. Actin. GFP-LC3 +/+ CLU -/- kda CLU GFP. Actin
 Supplementary Fig. 1 a CQ treatment ScrB OGX11 MG132 I II AZD5363 I II b GFP / / GFP / / GFP / / GFP / / GFP GFP Actin Actin ctrl CQ GFP / / GFP / / GFP / / GFP / / GFP GFP Actin Actin rapamycin rapamycincq
marker. DAPI labels nuclei. Flies were 20 days old. Scale bar is 5 µm. Ctrl is
 Supplementary Figure 1. (a) Nos is detected in glial cells in both control and GFAP R79H transgenic flies (arrows), but not in deletion mutant Nos Δ15 animals. Repo is a glial cell marker. DAPI labels
SUPPLEMENTARY FIGURES
 SUPPLEMENTARY FIGURES Supplementary Figure S1: Fibroblast-induced elongation of cancer cells requires direct contact with living fibroblasts. A. Representative images of HT29-GFP cultured in the presence
Supplementary Materials
 Supplementary Materials Supplementary Figure S1 Regulation of Ubl4A stability by its assembly partner A, The translation rate of Ubl4A is not affected in the absence of Bag6. Control, Bag6 and Ubl4A CRISPR
Proteomic profiling of small-molecule inhibitors reveals dispensability of MTH1 for cancer cell survival
 Supplementary Information for Proteomic profiling of small-molecule inhibitors reveals dispensability of MTH1 for cancer cell survival Tatsuro Kawamura 1, Makoto Kawatani 1, Makoto Muroi, Yasumitsu Kondoh,
Supplementary Information
 Supplementary Information Supplementary Figure 1. CD4 + T cell activation and lack of apoptosis after crosslinking with anti-cd3 + anti-cd28 + anti-cd160. (a) Flow cytometry of anti-cd160 (5D.10A11) binding
Supplementary Figure 1: Validation of labeling specificity of immature OSNs and presynaptic terminals. (A) (B) (C) (D) (E)
 (B) (C) (D) (E)") Supplementary Figure 1: Validation of labeling specificity of immature OSNs and presynaptic terminals. (A) Confocal images of septal olfactory epithelium of an adult Gγ8-sypGFP-tdTom mouse showing colocalization
Supplementary Figure 1: Validation of labeling specificity of immature OSNs and presynaptic terminals. (A) Confocal images of septal olfactory epithelium of an adult Gγ8-sypGFP-tdTom mouse showing colocalization
Cesarini et al., http ://www.jcb.org /cgi /content /full /jcb /DC1
 Supplemental material JCB Cesarini et al., http ://www.jcb.org /cgi /content /full /jcb.201504035 /DC1 THE JOU RNAL OF CELL BIO LOGY Figure S1. Lamin A/C depletion generates two distinct phenotypes in
SUPPLEMENTARY FIGURE LEGENDS. atypical adenomatous hyperplasias (AAH); Grade II: adenomas; Grade III: adenocarcinomas;
; Grade II: adenomas; Grade III: adenocarcinomas;") SUPPLEMENTARY FIGURE LEGENDS Supplementary Figure S1: Tumor grades in Ras G12D ; p53 / lung tumors. Representative histology (H&E) of K-Ras G12D ; p53 / lung tumors 13 weeks after tumor initiation. Grade
SUPPLEMENTARY FIGURE LEGENDS Supplementary Figure S1: Tumor grades in Ras G12D ; p53 / lung tumors. Representative histology (H&E) of K-Ras G12D ; p53 / lung tumors 13 weeks after tumor initiation. Grade
Tel: ; Fax: ;
 Tel.: +98 216 696 9291; Fax: +98 216 696 9291; E-mail: mrasadeghi@pasteur.ac.ir Tel: +98 916 113 7679; Fax: +98 613 333 6380; E-mail: abakhshi_e@ajums.ac.ir A Soluble Chromatin-bound MOI 0 1 5 0 1 5 HDAC2
SUPPLEMENTARY INFORMATION
 DOI: 10.1038/ncb2988 Supplementary Figure 1 Kif7 L130P encodes a stable protein that does not localize to cilia tips. (a) Immunoblot with KIF7 antibody in cell lysates of wild-type, Kif7 L130P and Kif7
SUPPLEMENTARY DATA. Assessment of cell survival (MTT) Assessment of early apoptosis and cell death
 Assessment of early apoptosis and cell death") Overexpression of a functional calcium-sensing receptor dramatically increases osteolytic potential of MDA-MB-231 cells in a mouse model of bone metastasis through epiregulinmediated osteoprotegerin downregulation
Overexpression of a functional calcium-sensing receptor dramatically increases osteolytic potential of MDA-MB-231 cells in a mouse model of bone metastasis through epiregulinmediated osteoprotegerin downregulation
SUPPLEMENTARY INFORMATION
 doi:10.1038/nature12652 Supplementary Figure 1. PRDM16 interacts with endogenous EHMT1 in brown adipocytes. Immunoprecipitation of PRDM16 complex by flag antibody (M2) followed by Western blot analysis
Real-time imaging reveals the single steps of brain metastasis fo mation r
 Real-time imaging reveals the single steps of brain metastasis fo mation r Yvonne Kienast, Louisa von Baumgarten, Martin Fuhrmann, Wolfgang E.F. Klinkert, Roland Goldbrunner, Jochen Herms and Frank Winkler
IL-13 Augments Compressive Stress-induced Tissue Factor Expression in Human Airway Epithelial Cells
 IL-13 Augments Compressive Stress-induced Tissue Factor Expression in Human Airway Epithelial Cells Jennifer A. Mitchel, Silvio Antoniak, Joo-Hyeon Lee, Sae-Hoon Kim, Maureen McGill, David I. Kasahara,
SUPPLEMENTARY DATA. Supplementary Table 2. Antibodies used for Immunofluoresence. Supplementary Table 3. Real-time PCR primer sequences.
 Supplementary Table 2. Antibodies used for Immunofluoresence. Antibody Dilution Source Goat anti-pdx1 1:100 R&D Systems Rabbit anti-hnf6 1:100 Santa Cruz Biotechnology Mouse anti-nkx6.1 1:200 Developmental
Figure S1A. Blood glucose levels in mice after glucose injection
 ## Figure S1A. Blood glucose levels in mice after glucose injection Blood glucose (mm/l) 25 2 15 1 5 # 15 3 6 3+3 Time after glucose injection (min) # Figure S1B. α-kg levels in mouse livers after glucose
hexahistidine tagged GRP78 devoid of the KDEL motif (GRP78-His) on SDS-PAGE. This
 on SDS-PAGE. This") SUPPLEMENTAL FIGURE LEGEND Fig. S1. Generation and characterization of. (A) Coomassie staining of soluble hexahistidine tagged GRP78 devoid of the KDEL motif (GRP78-His) on SDS-PAGE. This protein was expressed
SUPPLEMENTAL FIGURE LEGEND Fig. S1. Generation and characterization of. (A) Coomassie staining of soluble hexahistidine tagged GRP78 devoid of the KDEL motif (GRP78-His) on SDS-PAGE. This protein was expressed
SUPPLEMENTARY MATERIAL
 SUPPLEMENTARY MATERIAL IL-1 signaling modulates activation of STAT transcription factors to antagonize retinoic acid signaling and control the T H 17 cell it reg cell balance Rajatava Basu 1,5, Sarah K.
Supplementary Figures
 Supplementary Figures Supplementary Figure 1 Characterization of stable expression of GlucB and sshbira in the CT26 cell line (a) Live cell imaging of stable CT26 cells expressing green fluorescent protein
Supplementary Figure 1
 Supplementary Figure 1 6 HE-50 HE-116 E-1 HE-108 Supplementary Figure 1. Targeted drug response curves of endometrial cancer cells. Endometrial cancer cell lines were incubated with serial dilutions of
TRAF6 ubiquitinates TGFβ type I receptor to promote its cleavage and nuclear translocation in cancer
 Supplementary Information TRAF6 ubiquitinates TGFβ type I receptor to promote its cleavage and nuclear translocation in cancer Yabing Mu, Reshma Sundar, Noopur Thakur, Maria Ekman, Shyam Kumar Gudey, Mariya
Supplementary Materials for
 www.sciencesignaling.org/cgi/content/full/8/364/ra18/dc1 Supplementary Materials for The tyrosine phosphatase (Pez) inhibits metastasis by altering protein trafficking Leila Belle, Naveid Ali, Ana Lonic,
Supplemental Figures Supplemental Figure 1:
 Supplemental Figures Supplemental Figure 1: Representative FACS data showing Concurrent Brain cell type Acquisition using either Percoll PLUS (top row) or myelin removal beads (bottom two rows). Debris
Supplementary Figure S1. Venn diagram analysis of mrna microarray data and mirna target analysis. (a) Western blot analysis of T lymphoblasts (CLS)
 Western blot analysis of T lymphoblasts (CLS)") Supplementary Figure S1. Venn diagram analysis of mrna microarray data and mirna target analysis. (a) Western blot analysis of T lymphoblasts (CLS) and their exosomes (EXO) in resting (REST) and activated
Supplementary Figure S1. Venn diagram analysis of mrna microarray data and mirna target analysis. (a) Western blot analysis of T lymphoblasts (CLS) and their exosomes (EXO) in resting (REST) and activated
Supplementary Information
 Supplementary Information Figure S1. Int6 gene silencing efficiency. (A) Western Blot analysis of Int6 expression at different times after sirna transfection. Int6 expression is strongly silenced in Int6
Supplemental figure 1. PDGFRα is expressed dominantly by stromal cells surrounding mammary ducts and alveoli. A) IHC staining of PDGFRα in
 IHC staining of PDGFRα in") Supplemental figure 1. PDGFRα is expressed dominantly by stromal cells surrounding mammary ducts and alveoli. A) IHC staining of PDGFRα in nulliparous (left panel) and InvD6 mouse mammary glands (right
Supplemental figure 1. PDGFRα is expressed dominantly by stromal cells surrounding mammary ducts and alveoli. A) IHC staining of PDGFRα in nulliparous (left panel) and InvD6 mouse mammary glands (right
CD3 coated cover slips indicating stimulatory contact site, F-actin polymerization and
 SUPPLEMENTAL FIGURES FIGURE S1. Detection of MCs. A, Schematic representation of T cells stimulated on anti- CD3 coated cover slips indicating stimulatory contact site, F-actin polymerization and microclusters.
SUPPLEMENTARY INFORMATION. Supplementary Figures S1-S9. Supplementary Methods
 SUPPLEMENTARY INFORMATION SUMO1 modification of PTEN regulates tumorigenesis by controlling its association with the plasma membrane Jian Huang 1,2#, Jie Yan 1,2#, Jian Zhang 3#, Shiguo Zhu 1, Yanli Wang