In Vivo Pancreatic β Cell-Specific Expression of Anti-aging Gene Klotho, A Novel Approach for Preserving β Cells in Type II Diabetes
|
|
|
- Jody George
- 6 years ago
- Views:
Transcription
1 Page 1 of 38 In Vivo Pancreatic β Cell-Specific Expression of Anti-aging Gene Klotho, A Novel Approach for Preserving β Cells in Type II Yi Lin and Zhongjie Sun Department of Physiology, College of Medicine, University of Oklahoma Health Sciences Center, Oklahoma City, OK7314, USA Running title: Klotho Protects β Cells Total word count: 4686 Figures: 8 Address Correspondence to: Zhongjie Sun, MD, PhD, FAHA Professor of Physiology Chair, Research Committee Director, The Robert & Mary Cade Laboratory BMSB 662A, Box 2691 Department of Physiology, BMSB 662A College of Medicine University of Oklahoma Health Sciences Center (OUHSC) 94 S.L. Young Blvd. Oklahoma City, OK USA Zhongjie-sun@ouhsc.edu Tel x Fax Disclosures: Nothing to disclose 1 Publish Ahead of Print, published online November 5, 214
2 Page 2 of 38 Abstract Protein expression of an anti-aging gene Klotho was depleted in pancreatic islets in patients with type 2 diabetes mellitus (T2DM) and in db/db mice, an animal model of T2DM. The objective of this study is to investigate if in vivo expression of Klotho would preserve pancreatic β cell function in db/db mice. Here, we report for the first time that β cell-specific expression of Klotho attenuated the development of diabetes in db/db mice. β cell-specific expression of Klotho decreased hyperglycemia and enhanced glucose tolerance. The beneficial effects of Klotho were associated with significant improvements in T2DM-induced decreases in the number of β cells, insulin storage levels in pancreatic islets, and glucose-stimulated insulin secretion from pancreatic islets which led to increased blood insulin levels in diabetic mice. In addition, β cell-specific expression of Klotho decreased the intracellular superoxide levels, oxidative damage, apoptosis, and DNAJC3 (a marker for endoplasmic reticulum stress) in pancreatic islets. Furthermore, β cell-specific expression of Klotho increased expression levels of Pdx-1 (insulin transcription factor), PCNA (a marker of cell proliferation), and LC3 (a marker of autophagy) in pancreatic islets in db/db mice. These results revealed that β cell-specific expression of Klotho improved β cell function and attenuated the development of T2DM. Therefore, in vivo expression of Klotho may offer a novel strategy for protecting β cells in T2DM. Key words: Klotho, β cells, insulin, diabetes, autophagy, pdx-1, glucose tolerance 2
3 Page 3 of 38 Introduction affects about 15 million people worldwide and this figure is expected to be doubled in next 2 years (1). About 9 95% of all North American cases of diabetes are type 2 diabetes mellitus (T2DM) (1). Physiologically, the pancreatic β cells constantly synthesize insulin. Insulin is stored within vacuoles and released once triggered by an elevation of the blood glucose level. Insulin is the principal hormone that regulates uptake of glucose from the blood into most cells including skeletal muscle cells and adipocytes. Insulin is also the major signal that promotes the conversion of glucose to glycogen for internal storage in liver and skeletal muscle cells. T2DM was for many years recognized only owing to insulin resistance. There is now a common agreement that T2DM is a complex pathophysiologic spectrum including insulin resistance and β cell failure. Significant β cell failure is now believed to take place at an early stage in the disease progression, i.e., β cell function declines sharply before and after diagnosis of T2DM (2). In the United Kingdom Prospective Study, for example, the secretory capacity of β cells was reduced by 5% at the time fasting hyperglycemia was diagnosed (3). Generally, the β cell s compensatory ability with respect to an increase in insulin resistance keeps blood glucose at the near-normal level through proportionate enhancements of β cell function (4). It has been shown that there is no hyperglycermia without β cell dysfunction (5). Maintaining recommended targets of blood glucose control is difficult for many patients with T2DM due to the progressive loss of β cell function. Thus, one of the goals in the treatment of T2DM is to preserve functional β cells in pancreatic islets. The mouse Klotho (also called α Klotho) gene contains 5 exons and encodes a singlepass transmembrane protein with 114 amino acids, predominantly expressed in the kidney and the brain choroid plexus (6). The majority of amino acids in the Klotho peptide resides in the amino-terminal extracellular domain, which is followed by 21 amino acids trans-membrane domain, and an 11 amino acid short intracellular carboxyl terminus (6). There are two forms of Klotho, the full-length Klotho (13 kda) and the short-form Klotho (65 kda), which can be generated by alternative RNA splicing or proteolytic cleavage (6; 7). Overexpression of Klotho extended life span in mice whereas mutation of Klotho gene caused multiple premature-aging phenotypes and shortened lifespan (6; 8). Klohto has been reported to function as a cofactor for activation of FGFR1c by FGF23 in the regulation of calcium, phosphate, and vitamin D metabolism in kidneys (9). It is noted that Klotho -/- mutant mice display pancreatic islet atrophy, decreases in insulin content and mrna levels in pancreatic islets, and decreases in serum 3
4 Page 4 of 38 insulin levels (1). Most recently, we reported that Klotho mrna and proteins are expressed in the mouse pancreatic islets and that silencing of Klotho impaired glucose-stimulated insulin secretion in MIN6 β cells (11). It is not known, however, if Klotho expression is altered in pancreatic β cells in T2DM. Whether Klotho protects β cell function in T2DM has never been investigated but is an interesting topic to pursue. The db/db (diabetic) mouse was originally derived from an autosomal recessive mutation in db gene, which encodes for leptin receptors. This model resembles key features of human T2DM including peripheral insulin resistance and progressive deterioration of pancreatic β cells (12). Our preliminary study showed that the Klotho level in pancreatic islets is decreased significantly in patients with T2DM and in db/db mice, an animal model of T2DM. The objective of this study is to investigate if β cell-specific expression of Klotho protects β cell function and attenuates the development of diabetes in db/db mice. Research Design and Methods Cell culture. Pancreatic insulinoma MIN6 β cells were kindly provided by Drs. Miyazaki and Steiner (13). MIN6 cells were cultured and maintained in DMEM containing 25 mm glucose, 1% FBS, 1% penicillin/streptomycin, 2 mm glutamine, and 1 µm β-mercaptoethanol. MIN6 β cells of less than 2 passages were used in this experiment. 3T3-L1 preadipocytes and mouse renal inner medullary collecting duct (mimcd3) cells were cultured in the above media without β-mercaptoethanol. Human pancreas. The use of human pancreas was approved by the Institutional Review Board (IRB) at the University of Oklahoma Health Sciences Center. Human pancreases from normal donors (age: 37 to 5; mixed gender) and T2DM donors (age: 42 to 49; mixed gender) were obtained from National Disease Research Interchange, the National Resource Center (Philadelphia, PA). AAV vector construction and recombinant viral production. The procedures for plasmid construction and AAV packaging were described in our recent studies (14; 15). Plasmid of paav2.1-minsulin-nlacz with 1.13-Kb mouse preproinsulin gene II promoter was kindly provided by Dr. Xiao (16). A plasmid of pefmklcft with the full-length mouse Klotho cdna 4
5 Page 5 of 38 and C-terminal Flag tag was kindly provided by Dr. M. Kuro-o (University of Texas Southwestern Medical Center). The full length Klotho cdna with the C-terminal Flag tag (3.1 kb in total) was cloned into AAV serotype-2 (AAV2) (Startagen, La Jolla, CA, USA). The mouse insulin II promoter was cloned into AAV2 by replacing the original CMV promoter and intron. Insulin II promoter and GFP cdna (7 bs) were cloned into the AAV2 vector as the control constructs. The constructs of paav-mkl and paav-gfp were then packaged with phelper and paav-rc to produce recombinant adeno-associated viruses by following the manufactory instruction manual (Startagen, La Jolla, CA, USA). Recombinant viruses were purified via a method of CsCl gradient as described (17). The titers of recombinant viral genome particles were determined on a Bio-Rad CFX96 Real-Time PCR Detection Systems with a pair of primers targeted insulin II promoter region (F: 5 -AAATGCTCAGCCAAGGACAA-3 and R: 5 - GGACTTTGCTGTTTGACCCATT-3 ) and with the method as described (18; 19). For the remainder of this manuscript, these recombinant viruses will be referred as raav-gfp and raav-mkl, respectively. Transfection with plasmid DNA. Plasmid DNA including paav-mkl, paav-gfp, and paav- CMV-mKL were purified with Qiagen Maxi Kit. MIN6 cells, 3T3-L1 preadipocytes, and mimcd3 cells cultured in 6-well plate were transfected with various plasmid DNA at the concentration of.72 µg/ml using Optifect TM reagent according to the manufacturer s protocol, followed by 48- hour incubation in DMEM with 1% FBS at 37 C in a 5% CO 2 incubator. Phase-contrast images and fluorescence images of cells transfected with paav-gfp for 48 hours were collected at equal exposure conditions under Nikon Eclipse Ti microscopy (magnification x1) with the software NIS-Elements BR 3. (Nikon). Western blotting. Cells (or mouse pancreas) were lysed in Ripa buffer 48 hours after the transfection. The lysates were directly subjected to SDS-PAGE followed by western blotting with antibody against Klotho (R&D Systems), Rac-1 and p-rac-1 as we described previously (2; 21). The blot was rinsed and reprobed with antibody against β-actin or α-tubulin for loading controls. Animal study protocol. This study was carried out according to the guidelines of the National Institutes of Health on the Care and Use of Laboratory Animals. This project was approved by the Institutional Animal Care and Use Committee at the University of Oklahoma Health Sciences Center. 5
6 Page 6 of 38 Eight week old male BKS.Cg-Dock7m+/+ Lepr db /J HOM (db/db) mice and BKS.Cg- Dock7m+/+ Lepr db /J HET (lean) mice were purchased from Jackson Laboratory (Bar Harbor, Maine USA). All mice were housed in cages at room temperatures (25±1 C) and were provided with Purina laboratory chow (No. 51) and tap water ad libitum throughout the experiment. Three groups of db/db mice and 3 groups of lean mice were used (7 to 8 mice/group). Body weight was monitored weekly. Blood glucose was measured weekly from the tail vein blood using a Reli On Ultima glucose reader (Solartek Products, Inc; Alameda, CA). The mice were fasted for 12 hours before glucose measurement. PBS, raav-gfp, or raav-mkl were carefully injected (IP) into the region of pancreas of lean and db/db mice (1 weeks) at the dose of 2.57 x 1 9 of viral genome copies/g.bw in a total volume of 5 µl. Glucose tolerance test and insulin sensitivity test. The glucose tolerance test (GTT) was performed during weeks 2, 4, and 6 after the treatments. The insulin sensitivity test (IST) was performed during weeks 3 and 5 after the treatments. Briefly, blood glucose levels were measured at 3, 6, 9 and 12 minutes after subcutaneous injections of D-glucose (1 g/kg, Fisher Scientific) or insulin (1. U/Kg, Sigma). The baseline glucose levels were determined after 12-hour fasting. Tissue collections. At the end of week 6 of the treatments, 5 animals from each treatment group were euthanized with an overdose of sodium pentobarbital (1 mg/kg, i.p.) and blood was collected in EDTA. The plasma samples were stored at -8 C. Following blood collections, animals were perfused transcardiacally using heparinized saline. One fifth of pancreas was embedded in optimal cutting temperature (OCT) compound (Tissue-Tek) on dry ice and stored at -8 C until use. The rest of pancreas was fixed in 4% PBS-buffered paraformaldehyde (PFA) for 24 hours and then embedded in paraffin. For preliminary experiments, BKS.Cg -+ Leprdb/+Leprdb/OlaHsd mice (db/db mice) and BKS.Cg-m +/+ Leprdb/OlaHsd (lean mice) (all male, 2 weeks old) were purchased from Harlan (Indianapolis, USA). Four to five animals from each stain were euthanized with an overdose of sodium pentobarbital (1 mg/kg, i.p.). The animals were perfused transcardiacally using heparinized saline. One forth of pancreas was used western blot analysis of Klotho protein expression. The rest of pancreas was fixed in 4% PBS-buffered paraformaldehyde (PFA) for 24 hours and then embedded in paraffin for immunohistochemical analysis of Klotho and insulin protein expression. A total of 2-25 islets were examined for each mouse. 6
7 Page 7 of 38 Pancreatic islet isolation. At the end of week 6 of the treatments, 3 animals from each treatment group were euthanatized. Mouse pancreatic islets were isolated with a modified protocol as described previously (22). Briefly, collagenase-p was injected into the common bile duct of a mouse. The pancreas was then excised and digested at 37 C. The islets were first purified with premixed Histopaque gradient and then purified by handpicking the separated islets with low-retention pipette tips under a dissecting microscope. When viewed under the microscope, spherical and golden-brown particles (darker color) with diameter of 1-3 µm were considered as islets. 5 size-matched islets from each animal were cultured with RPMI164 with 1% FBS in a 24-well plate for overnight. The rest of isolated islets were stored at -8 C until use. Glucose-stimulated insulin secretion. After overnight incubation of isolated islets in 1% FBS RPMI164, islets were starved with KRB (125 mm NaCl, 4.74 mm KCl, 1 mm CaCl2, 1.2 mm KH2PO4, 1.2 mm MgSO4, 5 mm NaHCO3, and 25 mm HEPES, ph 7.4) supplemented with.1% bovine serum albumin and 2.8 mm glucose for 1 hour. Islets were washed with PBS and incubated with KRB buffer supplemented with 2.8 or 16.7 mm glucose for 1 h. Medium was collected and stored at -8 C for measuring insulin levels. Insulin measurement. Insulin levels in plasma or supernatants from glucose-treated islets were measured using an insulin EIA kit according to the manufacturer s instruction (ALPCO Diagnostics, Salem, NH). Immunohistochemistry (IHC). A series of 5-µm-thick sections of paraffin-embedded pancreas were cut at a 1-µm interval on three levels. For immunohistochemical analysis, consecutive pancreatic cross sections were deparaffinized, rinsed in xylene, and rehydrated. After heatinduced antigen retrieval in a microwave, the cross sections were blocked first with 3% hydrogen peroxide. The sections were incubated with antibodies against GFP (ab29, Abcam), Flag-tag (ET-DY1, Aves Labs), Klotho (R&D SYSTEM), insulin (sc-9168, Santa Cruz Biotechnology), Pdx-1 (AB353, Millipore), 4-hydroxyonenal (4-HNE) (ab4856, Abcam), DNAJC3 ( ab784, Abcam), PCNA (ab2426, Abcam), or LC3 (L1564-5A, US Biological) overnight at 4 C and then with appropriated secondary antibodies conjugated with HRP at room temperature for 6 minutes. Stable diaminobenzidine (DAB, Invitrogen) was used as a substrate for peroxidase. Hematoxylin was used as counterstaining. The islets of Langerhans in the cross-sections of pancreas for each mouse were located under a microscopy (Nikon 7
8 Page 8 of 38 Eclipse Ti). Images of islets from consecutive cross sections for each animal were collected at equal exposure conditions and at the same magnification (4X objective lens). The staining for Klotho, insulin, Pdx-1, or LC3 staining was quantified using Image J (NIH freeware) as mean gray value/pixel. Briefly, the selection line was drawn along the islet of Langerhans after the original RGB image was converted to a gray scale image. A TUNEL assay on the crosssections of mouse pancreas was performed using TACS XL -Blue Label in Situ Apoptosis Detection Kit (Trevgen, Gaithersburg, MD). The number of cells with positive insulin, 4-HNE, DNAJC3, TUNEL, or PCNA-staining in the islet was counted in NIS-Elements BR 3. (Nikon). A total of 2-25 islets were examined for each animal. In situ measurement of superoxide. Dihydroethidium (DHE) (D78, Sigma) was used to measure superoxide levels in pancreatic islets as we described previously (15; 2; 21; 23; 24). Briefly, 6-µm-thick cross sections of frozen OCT compound-embedded pancreas were cut on a cryomicrotome and fixed with 4% paraformaldehyde for 1 minutes. 2.5 µm DHE was added to the sections and incubated at 37 C for 2 minutes. Fluorescence images of ethidium-stained islets for each sample were collected at equal exposure conditions under Nikon Eclipse Ti microscopy (magnification x4) with the software NIS-Elements BR 3. (Nikon). Mean fluorescence density of pancreatic islets (2-25 islets/mouse) was analyzed using NIS-Elements BR 3.. RNA isolation and real time RT-PCR. Total RNA was purified from isolated mouse pancreatic islets using TRIzol Reagent, followed by Qiagen RNeasy Mini Kit. RNA (2 µg) was reversetranscribed using SuperScript TM III Reverse Transcriptase with random hexamer in the presence of 1ul dntp for 1hour at 5ºC. The resulting cdnas were used as templates for real time PCR with oligonucleotides primers to amplify the mrnas of insulin I (F: 5 - CCTGTTGGTGCACTTCCTAC-3 ; R: 5 -TGCAGTAGTTCTCCAGCTGG-3 ; size: 317 bp), insulin II (F: 5 -AGCCCTAAGTGATCCGCTACAA-3 ; R: 5 -CATGTTGAAACAATAACCTGGAAGA-3 ; size: 178 bp), Pdx-1 (F: 5 -CCACCCCAGTTTACAAGCTC-3 ; R: 5- ACGGGTCCTCTTGTTTTCCT-3 ; size: 315 bp), DNAJC3, (F; 5 - AAGCCCGTGGAAGCCATTAG-3 ; R: 5 -GGTCATTTTCATTGTGCTCCTGAG-3 ; size: 16 bp), PCNA (F; 5 -TAAAGAAGAGGAGGCGGTAA-3 ; R: 5 -TAAGTGTCCCATGTCAGCAA-3 ; size: 175 bp), and LC3 (F: 5 -CGAGCGCTACAAGGGTGAG-3 ; R: 5 -CCGGATGATCTTGACCAAC- 3 ; size: 1 bp) and β-actin (F: 5 -AGGTCATCACTATTGGCAACGA-3 ; R: 5 - CACTTCATGATGGAATTGAATGTAGTT-3 ; size: 118 bp) (25-29). Real-time PCR was 8
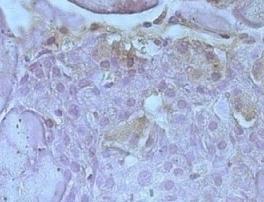
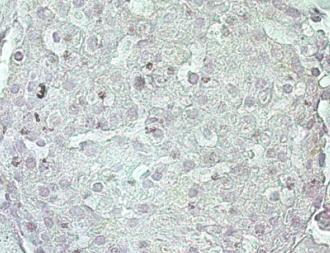
9 Page 9 of 38 performed on a Bio-Rad CFX96 Real-Time PCR Detection Systems. PCR were cycled 4 times using the following conditions: 95 C for 5 s, 58 C for 5 s. Homogeneity of PCR products from each reaction was confirmed by melt curve analysis and 1.5% agarose gel analysis. Statistical Analysis. The data of human and mouse Klotho and insulin in pancreases were analyzed using the unpaired t test. Blood glucose and body weight were analyzed by a repeated measure one-way ANOVA. The remaining data were analyzed by one-way ANOVA. The Newman-Keuls procedure was used to reveal differences between groups. A probability value with p<.5 was considered to be statistically significant. Results Klotho was depleted in pancreatic islets in T2DM patients and diabetic mice We performed immunohistochemical (IHC) staining of Klotho and insulin in human pancreas. Both Klotho and insulin staining was significantly decreased in pancreatic islets of patients with T2DM vs those of healthy donors (Fig. 1A &B). We further quantified Klotho protein expression levels in human pancreas using Western blot. Klotho protein expression was significantly decreased in pancreas in patients with T2DM (Fig. 1C). We next assessed klotho expression in pancreases in a mouse model of T2DM (db/db mice). The IHC analysis showed a significant decrease in Klotho protein expression in pancreatic islets in db/db mice (Fig. 1D&E). The insulin storage was also decreased significantly in pancreatic islets in db/db mice compared to lean mice (Fig. 1D&E). We recently reported that Klotho protein is expressed in mouse pancreatic islets of Langerhans with an apparent molecular weight of 65 kda (11). Western blot analysis indicated that Klotho protein expression levels were decreased significantly in pancreas in db/db mice (2 weeks) vs the age-matched lean mice (Fig. 1F). These results indicate that down-regulation of Klotho protein expression was associated with a decrease in insulin storage in pancreatic β cells in patients with T2DM and in db/db mice. β cell-specific expression of mkl in vitro To test the β cell specificity of the mouse insulin II promoter, we transfected MIN6 β cells, 3T3-L1 preadipocytes, and mimcd3 cells with.72 µg/ml of paav-gfp, paav-mkl, or paav-cmv-mkl DNAs for 48 hours. In paav-gfp and paav-mkl, the original CMV promoter 9
10 Page 1 of 38 was replaced by the mouse insulin II promoter. paav-gfp (GFP protein) was specifically expressed in MIN6 cells but not in 3T3-L1 or mimcd3 cells (Fig. S1A), indicating that the insulin II promoter is β cell-specific. The constructed insulin II promoter and the conventional CMV promoter are equally potent in driving mkl expression in MIN6 β cells (Fig. S1B). β cell-specific expression of mkl attenuated the development of diabetes in db/db mice We carefully injected raav-gfp or raav-mkl into the region of pancreas via IP delivery in lean and db/db mice. These db/db mice were developing severe hyperglycemia at the age of 1 weeks (Fig. 2A). Interestingly, raav-mkl significantly attenuated hyperglycemia and dampened the development of overt diabetes in db/db within 2 weeks, compared to the PBS and raav-gfp treated control groups (Fig. 2A). The anti-hyperglycemic effects of raav-mkl were sustained for 6 weeks (length of the study) although it did not eventually prevent the rise of blood glucose (Fig. 2A). The raav-mkl did not alter blood glucose levels significantly in lean mice (Fig. 2A). To gain insights into the mechanism of the Klotho action, we performed the glucose tolerance test (GTT) at weeks 2, 4, and 6 and the insulin sensitivity test (IST) at weeks 3 and 5 following klotho gene delivery. The db/db mice displayed overt glucose intolerance vs the lean mice (Fig. 2B-D). Treatments with raav-mkl markedly improved glucose tolerance in db/db mice (Fig. 2B-D). Glucose tolerance was not altered by raav-mkl in lean mice (Fig. 2B-D). The db/db mice developed severe insulin resistance (Fig. 2E&F). However, β cell-specific expression of Klotho did not affect insulin sensitivity in either db/db or lean mice (Fig. 2E&F). These data suggest that the treatments with raav-mkl improved the function of β cell but did not affect insulin sensitivity in peripheral tissues in diabetic mice. The group displayed slightly higher levels of plasma insulin compared to the group (Fig. 2G&H). raav-mkl further increased plasma insulin levels significantly in db/db mice but not in lean mice (Fig. 2G&H). These results suggest that raav-mkls may increase insulin release in response to hyperglycemia in db/db mice. Fasting urine glucose levels in db/db mice were significantly higher compared to those of lean mice, and raav-mkl significantly decreased urine glucose levels in db/db mice at weeks 2 and 4 after gene delivery (Fig. 2I). Effects of β cell-specific expression of mkl on body weight, food intake, water intake, and urine output in diabetic mice 1
11 Page 11 of 38 The control db/db mice displayed much greater body weights compared to the control lean mice (Fig. S2A). β cell-specific delivery of mkl did not affect the body weights significantly in either lean or db/db mice (Fig. S2A). The raav-mkl slightly but significantly decreased food intake in db/db mice (normalized to body weight) at week 5 after gene delivery (Fig. S2B-D). The control group had greater water intake and urine output vs the lean mice (Fig. S2E-J). raav-mkl attenuated both water intake and urine output in diabetic mice at weeks 3 and 5 after gene delivery (Fig. S2E-J). Immunohistochemical and functional analysis of mouse pancreatic islets of Langerhans Different serotypes of raav with single or double-stranded DNA have been used in pancreatic islet gene transfer with various efficiencies via different routes (16; 3; 31). Given that our insert genes ranged from.7 to 3.1 kb, AAV2 vector with single stranded DNA was used in the gene transfer. A Flag-tag sequence is inserted at the 3 end of mouse Klotho gene. At 6 weeks after gene delivery, we at first examined GFP and FLAG-tag protein expression in cross-sections of paraffin-embedded pancreatic islets, livers, or kidneys via immunohistochemistry. Obviously, raav-gfp drove GFP expression in pancreatic islets of lean and db/db mice whereas GFP was not detectable in livers and kidneys of animals injected with raav-gfp (Fig. S3A-B). In addition, raav-mkl drove FLAG-tag expression in islets of animals treated with raav-mkl (Fig. S3C). Thus, the intraperitoneal delivery of raav coupled with mouse insulin II promoter led to islet-specific gene transfer in mice. Secondly, we studied Klotho expression in pancreatic islets in diabetic mice. Klotho staining in pancreatic islets of langerhans in control db/db mice was significantly decreased compared to that of control lean mice (Fig. 3A&B). The treatments with raav-mkl increased Klotho staining in pancreatic islets of both lean and db/db mice (Fig. 3A&B). Western blot analysis also showed that the treatments with raav-mkl increased Klotho protein expression in pancreas of lean and db/db mice (Fig. S 3D&E). To investigate whether the β cell-specific expression of mkl exerts beneficial effects on pancreatic islets of Langerhans, we performed insulin staining in pancreatic cross sections. Insulin staining in pancreatic islets was significantly decreased in db/db mice compared to that of lean mice (Fig. 3C&D). Interestingly, β cell-specific expression of mkl increased insulin staining in pancreatic islet of db/db mice by 1.26 folds (Fig. 3D). In addition, the number of insulin-positive cells in pancreatic islets of Langerhans in db/db mice was significantly less than that of lean mice (Fig. 3E). In contrast, β cell-specific expression of mkl partially restored the number of insulin-positive cells in pancreatic islets in db/db mice (by 55%) (Fig. 3E). 11
12 Page 12 of 38 We further tested the glucose-stimulated insulin secretion in isolated mouse pancreatic islets (ex vivo). Insulin secretion was lower both at 2.8 mm and 16.7 mm glucose in islets isolated from db/db mice compared to that of lean mice (Fig. 3F). β cell-specific expression of mkl promoted insulin secretion in response to 16.7 mm glucose but not 2.8 mm glucose in islets of lean and db/db mice (Fig. 3F). These results revealed, for the first time, that the pancreatic islets of db/db mice are losing the compensatory ability in response to increased blood glucose levels and that β cell-specific expression of mkl improved the impaired response of pancreatic β cells to the glucose challenge in db/db mice. Effects of β cell-specific expression of mkl on oxidative stress, superoxide levels, and Pdx-1 expression in pancreatic islets of db/db mice To study the mechanisms for the preservation of β cell function by Klotho in db/db mice, we evaluated oxidative stress markers (4-HNE), intracellular superoxide (DHE staining), and insulin transcription factors (Pdx-1) in pancreatic islets. The number of 4-HNE-positive cells and the intracellular superoxide level were significantly increased in pancreatic islets of db/db mice (Fig. 4A-D), indicating oxidative damage. In vivo expression of mouse Klotho attenuated the oxidative stress levels in pancreatic islets of db/db mice (Fig. 4A-D). In addition, the Pdx-1 expression level (staining) was significantly lower in pancreatic islets of db/db animals while β cell-specific expression of mkl increased Pdx-1 in islets of db/db mice (Fig. 4E&F). Thus, the beneficial effects of Klotho on β cells may involve suppression of oxidative stress and enhancement of Pdx-1 expression in diabetic mice. Effects of β cell-specific expression of mkl on DNAJC3, LC3, cell proliferation, and apoptosis in pancreatic islets of db/db mice Because oxidative stress could damage cells, we further assessed the ER stress marker (DNAJC3), autophagy marker (LC3), cell proliferation, and cell apoptosis in pancreatic islets in diabetic mice. The number of DNAJC3-positive cells in the pancreatic islets was increased significantly in db/db mice vs lean mice. In contrast, β cell-specific expression of mkl decreased the number of DNAJC3-positive cells in islets of db/db mice, suggesting that expression of Klotho may suppress ER stress in islets of db/db mice (Fig. 5A&B). LC3 staining was lower in islets of db/db mice compared to that of lean mice, suggesting that the autophagic activity was decreased in pancreatic islets of db/db mice. Interestingly, β cell-specific expression of mkl restored autophagic activity in db/db mice (Fig. 5C&D). 12
13 Page 13 of 38 On the other hand, the number of PCNA-positive cells in islets was increased in db/db mice compared to lean mice, and β cell-specific expression of Klotho further increased the number of PCNA-positive cells in islets of db/db mice (Fig. 6A&B). Therefore, in vivo expression of Klotho further promoted cell proliferation in pancreatic islets of db/db mice. The number of apoptotic cells was increased in islets of db/db mice, which can be dampened by expression of Klotho (Fig. 6C&D). Thus, raav-mkl treatments attenuated apoptosis in pancreatic islets of db/db mice (Fig. 6C&D). Therefore, the preservation of β cell function in db/db mice may be partially attributed to suppression of ER stress and apoptosis, restoration of autophagic activity, and enhancement of β cell proliferation. Effects of β cell-specific expression of mkl on gene expression in islets of diabetic mice We also assessed if Klotho affects the corresponding gene expressions in line with the changes in several proteins involved in the preservation of pancreatic islets. The db/db mice displayed significant lower mrna expression levels of insulin I, insulin II, Pdx-1, and LC3 while the treatments with raav-mkl increased mrna levels of these genes in islets in diabetic mice (Fig. 7A, B, C, D). In addition, db/db mice had higher mrna expression levels of DNAJC3 and PCNA while the raav-mkl treatments decreased DNAJC3 mrna expression but further increased PCNA mrna expression levels in islets (Fig. 7E&F). These data suggest that the β cell-specific expression of mkl preserved β cells via regulating gene expressions of isulin I, insulin II, Pdx-1, PCNA, and LC3 mrna. Effects of overexpression of mkl on NADPH oxidase activity, superoxide production, p- Rac1, and Rac1 in MIN6 β cells treated with high glucose Since the beneficial effects of Klotho on β cells involved suppression of superoxide production and oxidative stress (Fig. 4A-D), we further investigated the underlying mechanism in MIN6 β cells. It is noted that high glucose increased the activity of NADPH oxidases (Fig. 8A), an important source of superoxide in MIN6 β cells. Interestingly, overexpression of mkl abolished high glucose-induced activation of NADPH oxidases and superoxide production in MIN6 β cells (Fig. 8A-C), suggesting that the NADPH oxidase is involved in the upregulation of superoxide generation. Interestingly, overexpression of mkl eliminated high glucose-induced activation of Rac1 (p-rac1) without altering the total Rac1 level (Fig. 8D-F), a key regulator of the NADPH oxidase activity. These results suggest that the suppressor effect of mkl on NADPH oxidase activity may be mediated by inhibition of Rac1 phosphorylation. 13
14 Page 14 of 38 We next assessed the subcellular localization of the short-form Klotho (65 kda) using confocal microscopy. Endogenous 65 kda Klotho (red) was found in the cytosol and nucleus (Fig. S4A). Our recent study indicated that the short-form Klotho is also expressed in the plasma membrane (11) although the current ICC method cannot show its membrane localization. The transgene-expressed Klotho which was detected using flag-tag staining (green) was located in the cytosol and outside of the nucleus (Fig. S4B). Effects of short-form and full-length Klotho protein on glucose-induced insulin release in isolated β islets We further assessed the effects of recombinant short-form Klotho (65 kda) and fulllength Klotho (13 kda) protein on β cell function in the β islets isolated from lean mice. The β islets were treated with 65 kda and 13 kda Klotho proteins, respectively. We found that only short-form Klotho (65 kda) promoted insulin secretion in β islets (Fig. S5). The full-length klotho (13 kda) did not have obvious effects on insulin secretion in β islets (Fig. S5). Exogenous short-form Klotho could bind to the cell membrane. We demonstrated recently that the shortform Klotho in cell membrane enhances glucose-induced insulin secretion by upregulating membrane levels of transient receptor potential V2 (TRPV2) which increases glucose-induced calcium responses (11). Discussion The pancreatic β cells are essential to the regulation of glucose homeostasis. Substantial β cell failure is now believed to occur at an early stage in the progression of T2DM (2). Thus, one of the goals in the treatment of T2DM is to preserve functional β cells. Klotho, a recently-discovered aging-suppressor gene, was believed to be expressed in kidneys (21). Our most recent study indicates that Klotho gene and protein are expressed in pancreatic islets (11). Notably, Klotho protein expression in β cells was decreased both in patients with T2DM and in db/db mice (Fig. 1A-F), a mouse model of T2DM. The exciting finding of the present study is that β cell-specific expression of Klotho attenuated the development of diabetes and enhanced the performance in glucose tolerance in db/db mice. The beneficial effects of Klotho is likely due to the increases in the number of insulin-positive β cells, insulin storage levels in pancreatic islets, and the glucose-stimulated insulin secretion from pancreatic islets which led to the increased blood insulin levels in db/db mice. 14
15 Page 15 of 38 It is noticed that the depleted Klotho protein expression was associated with the decreased insulin storage in pancreatic islets (Fig. 1A&B, D&E) and the impaired glucosestimulated insulin release in pancreatic islets of db/db mice (Fig. 3F). β cell-specific expression of Klotho improved or preserved β cell function (Figs. 2&3). It is new and interesting that β cell function may be regulated by Klotho. These findings are supported by our recent cell culture study that silencing of Klotho gene impaired glucose-stimulated insulin release and that overexpression of Klotho promoted glucose-stimulated insulin secretion in MIN6 β cells (11). Klotho enhances glucose-induced insulin secretion by regulating plasma membrane levels of TRPV2 and intracellular levels of calcium (11). Klotho-deficient mice exhibit hypoinsulinmia and pancreatic islet atrophy with diminished insulin protein and mrna levels (1). The present study further demonstrated that β cell-specific expression of Klotho increased Pdx-1, insulin I, and insulin II mrna levels and their corresponding proteins levels in pancreatic islets in db/db mice. Pdx-1 is the major regulator of glucose-stimulated insulin gene transcription. Specific point mutations in Pdx-1 are associated with MODY (maturity-onset diabetes of the young) 4 and lateonset T2DM, characterized by a decline in β cell function (32). The present studies suggest that the promoting effects of Klotho on insulin synthesis may be attributed partially to the increased Pdx-1 expression. A further study is required to elucidate the mechanism for the regulation of Pdx-1 gene expression by Klotho in pancreatic islets. β cell-specific expression of Klotho did not alter insulin sensitivity. The Insulin II promoter was specific in driving gene expression in pancreatic β cells as GFP was exclusively detected in pancreatic islets but was not detectable in peripheral tissues (liver and kidneys) in mice treated with raav-gfp (Fig. S3A). raav-mkl was expressed in pancreatic islets as indicated by expression of FLAG-tag (Fig. S3C). The insulin II promoter was also potent in driving Klotho gene expression in β islets (Fig. S3D-E). This promoter is as potent as the CMV promoter (Fig. S1B). We further explored the potential mechanisms by which β cell-specific expression of Klotho protected against β cell failure in pancreatic islets of db/db mice. raav-mkl decreased reactive oxygen species (ROS) and oxidative damage as measured by DHE and 4- hydroxynonenal (4-HNE), respectively, in pancreatic islets of db/db mice. Oxidative stress induced by reactive oxygen species is critically involved in the impairment of β cell function during the development of diabetes (33). Because of their low antioxidant capacity, β cells are extremely susceptible to oxidative stress (34). Hyperglycemia and hyperlipidemia cause oxidative damage to proteins, lipids and DNA in β cells as the result of a combination of increased free radical production and an impaired ability of cells to detoxify the radicals and 15
16 Page 16 of 38 repair damaged molecules (33). By covalently modifying membrane-associated proteins, the membrane lipid peroxidation product 4-HNE may play particularly sinister roles in the metabolic syndrome and associated disease processes (35). Since superoxide is the major source of ROS that causes oxidative damage, we further explored the mechanism of Klotho-induced reduction of superoxide production under the hyperglycemia condition. Because a study of the mechanistic link of Klotho and superoxide generation may be compromised in the in vivo animal experiment, we investigated into how Klotho attenuates high glucose-induced superoxide production in MIN6 β cells. The data suggested that Klotho decreased high glucose-induced upregulation of NADPH oxidase activity and superoxide production likely via suppressing phosphorylation of Rac1 (Fig. 8), a key regulator of the NADPH oxidase. Thus, this result reveals a previously unidentified role of Klotho in the regulation of Rac-1 and NADPH oxidase activity in β cells. Interestingly, Klotho attenuates high glucose-induced upregulation of NADPH oxidase activity and superoxide production without alteration of glucose levels, suggesting that Klotho has direct protective effect in β cells. On the other hand, in the animal study, the beneficial effects of overexpression of Klotho in β cells may also be partially attributed to the euglycemic effect of Klotho due to increased insulin secretion. Collectively, these data indicated that β cell-specific expression of Klotho may preserve β cells partially by suppressing superoxide production and oxidative stress in pancreatic β islets in T2DM. Oxidative stress could impair endoplasmic reticulum (ER) function leading to ER stress (36; 37). As a secretory cell that synthesizes and releases a large amount of insulin, the β-cell is expected to be susceptible to alterations in ER homeostasis, which can result in the accumulation of unfolded, misfolded and/or aggregated proteins (a phenomenon known as ER stress) (38). Eukaryotic cells respond to ER stress by activating the unfolded protein response (UPR), a process that allows cells to adapt to and attempt to relieve ER stress conditions (38). Hyperactivation of the UPR is indispensible for ER homeostasis and may be involved in β cell dysfunction and death during the progression of T2DM. The level of ER chaperone protein DnaJ (Hsp4) homologue C3 (DNAJC3) is elevated in pancreatic islets of db/db mice and human T2DM (39). β cell-specific expression of mkl attenuated diabetes-induced increases in DNAJC3 expression in pancreatic islets (Fig. 5). Thus, this result reveals that Klotho attenuated ER stress which may contribute to the preservation of β cells and protection against diabetes by β cell-specific expression of Klotho. The present study demonstrated that β cell-specific expression of Klotho enhanced cell proliferation and decreased cell apoptosis in pancreatic islets of db/db mice (Fig. 6A-D). These 16
17 Page 17 of 38 results suggest, for the first time, that β cell-specific expression of Klotho may preserve β cells partially via attenuating apoptosis and promoting cell proliferation in pancreatic islets of db/db mice. This beneficial effect may be partially mediated by Klotho-induced suppression of superoxide production and oxidative stress which are known to cause cell apoptosis and impair cell proliferation (4). Regulation of β cell mass is dynamic and is tightly matched to meet the body s demand for insulin (41). The rates of β cell apoptosis or necrosis and β cell proliferation or neogenesis equilibrate at a frequency of.5% under steady-state conditions (42). It was reported that β cell apoptosis contributes to the reduction of β cell mass in patients with T2DM (43; 44). It has been shown that Klotho and FGF23 together promote cell proliferation in vitro (45; 46). It is noticed that the frequency of proliferative and apoptotic events per islet is relatively low (1-2%) in this diabetic model. We believe that the accumulated effects of proliferation and apoptosis in β cell mass may take time. Unexpectedly, the expression of LC3, a marker of autophagy, was decreased in pancreatic islets of db/db mice while β cell-specific expression of mkl reversed the downregulation of LC3 expression in islets of db/db mice (Fig. 5D, Fig. 7D). Autophagy is a physiologically preserved process that maintains homeostatic functions like protein degradation and organelle turnover (47). A major member of this family is the microtubule associated-protein 1 light chain 3 (LC3), which is associated with the autophagosome from its formation up to its maturation into autolysosome and serves as a bona fide marker for autophagy (48). Loss-offunction experiments (Atg7 f/f :RIP-Cre mice) have demonstrated that autophagy in β cells is critical in the preservation of pancreatic β cell function (49). Accumulation of p62, a substrate for autophagy, in β-cells of db/db mice has been observed (5). Autophagy deficiency may be involved in lipotoxicity-induced β cell failure in T2DM (2; 48). Therefore, the present study indicated that the restoration of autophagic activity by expression of Klotho may contribute to the preservation of β cells in pancreatic islets of diabetic mice. The regulation of autophagy by Klotho may be partially attributed to suppression of superoxide production and oxidative stress which are known to disrupt autophagy (4). The major type of endogenous Klotho in pancreatic β cells is about 65 kda based on the western blot analysis (Fig. 1C&F, Fig. 8D). It is noted that overexpression of Klotho produced two types of Klotho, short-form (65 kda) and full-length Klotho (13 kda) (Fig. 8D, Fig. S3D). However, the 65 kda Klotho seems to be the functional protein because treatment with 65 kda, not 13 kda, Klotho protein promoted glucose-induced insulin secretion (Fig. S5). Therefore, the beneficial effects of in vivo β cell-specific expression of Klotho in T2DM may be mediated by the 65 kda Klotho. Interestingly, Klotho only promotes high glucose-stimulated insulin secretion 17
18 Page 18 of 38 in β cells but did not affect insulin secretion at low glucose levels (Fig. 3F, Fig. S5). This finding is consistent with our recent observation in MIN6 β cells (11). In Summary, β cell-specific expression of Klotho preserved the β cell function and protected against the development of T2DM in db/db mice. Particularly, β cell-specific expression of Klotho attenuated hyperglycemia and improved the performance in glucose tolerance in diabetic mice. This protection was associated with significant increases in the number of β cells, Pdx-1 levels, and insulin storage levels in pancreatic islets, the glucosestimulated insulin secretion from pancreatic islets, and blood insulin levels. β cell-specific expression of Klotho preserved the β cell function likely by suppressing oxidative stress, ER stress and apoptosis, increasing cell proliferation, and normalizing autophagy in pancreatic islets of db/db mice. Therefore, in vivo expression of Klotho in pancreatic β cells may offer a new and effective therapeutic strategy for β cell dysfunction in T2DM. These promising findings warrant further mechanistic investigation into the role of Klotho in regulating β cell function. It is noted that β cell-specific expression of Klotho attenuated but did not eventually prevented the development of T2DM. Therefore, simultaneous management of hyperglycemia and insulin resistance is also important for the protection of β cells in T2DM. Author Contributions Z.S. developed the concepts and hypotheses, designed the study, and participated in writing the manuscript. Y.L conducted the experiments, analyzed the data, and participated in writing the manuscript. ACKNOWLEDGEMENTS This work was supported by DK 9343, NIH R1 HL1532, HL1274, and HL This publication was made possible by NIH Grant Number 9P2GM from the COBRE Program of the National Institute of General Medical Sciences. 18
19 Page 19 of 38 Dr. Zhongjie Sun is the guarantor of this work and, as such, had full access to all the data in the study and takes responsibility for the integrity of the data and the accuracy of the data analysis. Competing Financial Interests The authors declare no competing financial interests. 19
20 Page 2 of 38 Figure Legends Figure 1. Expressions of Klotho in pancreatic islets of patients with T2DM and db/db mice (2 weeks-old). A. Representative images of Klotho and insulin staining (brown color) in crosssections of human pancreatic islets. B. Semi-quantification of Klotho and insulin staining in human pancreatic islets. n = 4 to 6; *p<.5 vs the normal samples. C. Western blot analysis of Klotho protein expression in human pancreas. Results were standardized to β-actin. n = 3 to 4; *p <.5 vs the normal samples. D. Representative images of Klotho and insulin staining (brown color) in cross-sections of mouse pancreatic islets. E. Semi-quantification of Klotho and insulin staining in mouse pancreatic islets. n = 4 to 5. **p <.1, p<.1 vs the lean mice. F. Western blot analysis of Klotho protein expression in mouse pancreas. Results were standardized to β-actin vs the lean mice. n = 4 to 5. **p <.1 vs the lean mice. Figure 2. Effects of the β cell-specific expression of mkl on blood glucose levels, glucose tolerance, insulin sensitivity, and plasma insulin levels in diabetic mice. The time course of fasting blood glucose levels (A). Glucose tolerance test (GTT) results at week 2 (B), week 4 (C), and week 6 (D) after gene delivery. Insulin sensitivity test (IST) results at week 3 (E) and week 5 (F) after the treatments. Plasma insulin levels at week 3 (G) and week 6 (H) after gene delivery. Urine glucose levels at week 2 and 4 after gene delivery (I). Data = mean ± SEM. n = 6-8 animals/group (except for plasma samples n = 3 to 5). *p<5, **p<.1, p <.1 vs the group; ++ p<.1, +++ p <.1 vs the group. Figure 3. Expressions of Klotho and insulin in pancreatic islets and analysis of the islet function in diabetic mice. Animals were sacrificed 6 weeks after gene delivery. A. Representative images of Klotho staining (brown color) in cross-sections of mouse pancreatic islets. B. Semiquantification of Klotho staining in pancreatic islets (n=4 to 5). C. Representative images of insulin staining (brown color) in cross-sections of islets. D. Semi-quantification of insulin staining in pancreatic islets (n=4 to 5). E. The percentage of insulin-positive cells in pancreatic islets (n=4 to 5). p <.1 vs the group; +++ p <.1 vs the group. F. Glucose-stimulated insulin secretion from pancreatic islets. Isolated islets were stimulated with 2.8 mm or 16.7 mm glucose. Insulin levels in the medium were measured. Data = mean ± SEM, n = 3 animals/group. p<.1 vs the group treated with 2.8 mm glucose; ^^^p<.1 vs the group treated with 2.8mM glucose; ### p<.1 vs the db/db- 2
21 Page 21 of 38 PBS group treated with 16.7 mm glucose; ++p<.1 vs the group treated with 16.7 mm glucose. Figure 4. Oxidative stress, superoxide, and Pdx-1 levels in pancreatic islets of diabetic mice. A. Representative images of 4-HNE staining (indicated by arrows, brown color) in cross-sections of mouse pancreatic islets. B. The percentage of 4-HNE-positive cells in pancreatic islets. C. Representative images of DHE staining (red color) in pancreatic islets. D. Quantification of superoxide levels (DHE staining) in pancreatic islets. E. Representative images of Pdx-1 staining in pancreatic islets. F. Semi-quantification of Pdx-1 staining in pancreatic islets. Data = mean ± SEM, n=4-5 animals/group. p <.1 vs the group; + p<.5, +++ p <.1 vs the group. Figure 5. Effects of β cell-specific expression of mkl on ER stress and autophagy in pancreatic islets. A. Representative images of DNAJC3 staining (indicated by arrows, brown color) in mouse pancreatic islets. B. The percentage of DNAJC3 positive-staining cells in pancreatic islets. C. Representative images of LC3 staining (brown color) in cross-sections of mouse pancreatic islets. D. Semi-quantification of LC3 staining in pancreatic islets. Data = mean ± SEM, n=4-5 animals/group. **p<.1, p <.1 vs the group; ++ p<.1, +++ p <.1 vs the group. Figure 6. Effects of β cell-specific expression of mkl on cell proliferation and apoptosis in pancreatic islets. A. Representative images of PCNA staining (indicated by arrows, brown color) in mouse pancreatic islets. B. The percentage of PCNA-positive cells in pancreatic islets. C. Representative images of TUNEL staining (indicated by arrows, blue color) in pancreatic islets. D. The percentage of TUNEL-positive apoptotic cells in pancreatic islets. Data = mean ± SEM, n=4-5 animals/group. p <.1 vs the group; ++ p<.1, +++ p <.1 vs the db/db- PBS group. Figure 7. Gene expressions in islets isolated from diabetic mice. Real time RT-PCR analysis of mrna expression of insulin I (A), insulin II (B), Pdx-1(C), LC3 (D), DNAJC3 (E), and PCNA (F). Results were standardized to β-actin mrna levels and then expressed as fold changes vs the mice. Data = mean ± SEM, n = 3 animals/group. *p<.5, **p<.1, p <.1 vs the group; + p<.5, ++ p<.1, +++ p <.1 vs the group. 21
22 Page 22 of 38 Figure 8. Effects of overexpression of Klotho on NADPH oxidase activity, superoxide production, p-rac1, and Rac1 in MIN6 β cells. MIN6 β cells were transfected with pmkl (with Flag tag) or pmcs (multiple cloning site, control plasmid) for 48 hours and then incubated with 5 mm or 25 mm glucose for 18 hours. A. NADPH oxidase activity (arrows indicating addition of NADPH). RLU indicates relative light unit. NADPH oxidase activity in MIN6 cells was measured using lucigenin chemiluminescence assay. B. Representative images of DHE staining (superoxide production) in MIN6 β cells. C. Quantification of DHE staining density. D. Representative Western blot bands of Klotho, p-rac1 and Rac1 protein expressions in MIN6 β cells. Quantification of p-rac1 (E) and Rac1 (F). Results were normalized to α-tubulin level and expressed as fold changes vs the control (5 mm G). Data = means + SEM, n = 3 to 6. *p<.5, p<.1 vs 5 mm glucose group; + p<.5, ++ p<.1, +++ p<.1 vs 25 mm Glucose + pmcs group. 22
23 Page 23 of 38 References 1. Zimmet P, Alberti KG, Shaw J: Global and societal implications of the diabetes epidemic. Nature 21;414: Leahy JL, Hirsch IB, Peterson KA, Schneider D: Targeting beta-cell function early in the course of therapy for type 2 diabetes mellitus. J Clin Endocrinol Metab 21;95: Matthews DR, Cull CA, Stratton IM, Holman RR, Turner RC: UKPDS 26: Sulphonylurea failure in non-insulin-dependent diabetic patients over six years. UK Prospective Study (UKPDS) Group. Diabet Med 1998;15: Leahy JL: Pathogenesis of type 2 diabetes mellitus. Arch Med Res 25;36: Ferrannini E, Mari A: Beta cell function and its relation to insulin action in humans: a critical appraisal. Diabetologia 24;47: Kuro-o M, Matsumura Y, Aizawa H, Kawaguchi H, Suga T, Utsugi T, Ohyama Y, Kurabayashi M, Kaname T, Kume E, Iwasaki H, Iida A, Shiraki-Iida T, Nishikawa S, Nagai R, Nabeshima YI: Mutation of the mouse klotho gene leads to a syndrome resembling ageing. Nature 1997;39: Chen CD, Podvin S, Gillespie E, Leeman SE, Abraham CR: Insulin stimulates the cleavage and release of the extracellular domain of Klotho by ADAM1 and ADAM17. Proc Natl Acad Sci U S A 27;14: Kurosu H, Yamamoto M, Clark JD, Pastor JV, Nandi A, Gurnani P, McGuinness OP, Chikuda H, Yamaguchi M, Kawaguchi H, Shimomura I, Takayama Y, Herz J, Kahn CR, Rosenblatt KP, Kuro-o M: Suppression of aging in mice by the hormone Klotho. Science 25;39: Kurosu H, Kuro OM: The Klotho gene family as a regulator of endocrine fibroblast growth factors. Mol Cell Endocrinol 29;299: Utsugi T, Ohno T, Ohyama Y, Uchiyama T, Saito Y, Matsumura Y, Aizawa H, Itoh H, Kurabayashi M, Kawazu S, Tomono S, Oka Y, Suga T, Kuro-o M, Nabeshima Y, Nagai R: Decreased insulin production and increased insulin sensitivity in the klotho mutant mouse, a novel animal model for human aging. Metabolism 2;49: Lin Y, Sun Z: Antiaging gene Klotho enhances glucose-induced insulin secretion by upregulating plasma membrane levels of TRPV2 in MIN6 beta-cells. Endocrinology 212;153: Shafrir E: in animals: Contribution to the understanding of diabetes by study of its etiopathology in animal models. In mellitus Porte D, Sherwin, RS., Baron, A., Ed. New York, McGraw-Hill 23, p Miyazaki J, Araki K, Yamato E, Ikegami H, Asano T, Shibasaki Y, Oka Y, Yamamura K: Establishment of a pancreatic beta cell line that retains glucose-inducible insulin secretion: special reference to expression of glucose transporter isoforms. Endocrinology 199;127: Crosswhite P, Chen K, Sun Z: AAV Delivery of Tumor Necrosis Factor-alpha Short Hairpin RNA Attenuates Cold-Induced Pulmonary Hypertension and Pulmonary Arterial Remodeling. Hypertension 214;64: Wang X, Skelley L, Wang B, Mejia A, Sapozhnikov V, Sun Z: AAV-based RNAi silencing of NADPH oxidase gp91(phox) attenuates cold-induced cardiovascular dysfunction. Hum Gene Ther 212;23: Wang Z, Zhu T, Rehman KK, Bertera S, Zhang J, Chen C, Papworth G, Watkins S, Trucco M, Robbins PD, Li J, Xiao X: Widespread and stable pancreatic gene transfer by adenoassociated virus vectors via different routes. 26;55: Auricchio A, Hildinger M, O'Connor E, Gao GP, Wilson JM: Isolation of highly infectious and pure adeno-associated virus type 2 vectors with a single-step gravity-flow column. Hum Gene Ther 21;12:
24 Page 24 of Rohr UP, Wulf MA, Stahn S, Steidl U, Haas R, Kronenwett R: Fast and reliable titration of recombinant adeno-associated virus type-2 using quantitative real-time PCR. J Virol Methods 22;16: Veldwijk MR, Topaly J, Laufs S, Hengge UR, Wenz F, Zeller WJ, Fruehauf S: Development and optimization of a real-time quantitative PCR-based method for the titration of AAV-2 vector stocks. Mol Ther 22;6: Wang Y, Kuro OM, Sun Z: Klotho Gene Delivery Suppresses Nox2 Expression and Attenuates Oxidative Stress in Rat Aortic Smooth Muscle Cells via the camp-pka Pathway. Aging Cell 212;11: Wang Y, Sun Z: Klotho gene delivery prevents the progression of spontaneous hypertension and renal damage. Hypertension 29;54: Carter JD, Dula SB, Corbin KL, Wu R, Nunemaker CS: A Practical Guide to Rodent Islet Isolation and Assessment. Biol Proced Online, 29;11: Crosswhite P, Sun Z: Ribonucleic acid interference knockdown of interleukin 6 attenuates cold-induced hypertension. Hypertension 21;55: Wang X, Sun Z: RNAi silencing of brain klotho potentiates cold-induced elevation of blood pressure via the endothelin pathway. Physiol Genomics 21;41: da Silva Xavier G, Sun G, Qian Q, Rutter GA, Leclerc I: ChREBP regulates Pdx-1 and other glucose-sensitive genes in pancreatic beta-cells. Biochem Biophys Res Commun 21;42: Li H, Lam A, Xu AM, Lam KS, Chung SK: High dosage of Exendin-4 increased early insulin secretion in differentiated beta cells from mouse embryonic stem cells. Acta Pharmacol Sin 21;31: Lu H, Yang Y, Allister EM, Wijesekara N, Wheeler MB: The identification of potential factors associated with the development of type 2 diabetes: a quantitative proteomics approach. Mol Cell Proteomics 28;7: Mosley AL, Ozcan S: Glucose regulates insulin gene transcription by hyperacetylation of histone h4. J Biol Chem 23;278: Xu B, Hua J, Zhang Y, Jiang X, Zhang H, Ma T, Zheng W, Sun R, Shen W, Sha J, Cooke HJ, Shi Q: Proliferating cell nuclear antigen (PCNA) regulates primordial follicle assembly by promoting apoptosis of oocytes in fetal and neonatal mouse ovaries. PLoS One 211;6:e Gaddy DF, Riedel MJ, Pejawar-Gaddy S, Kieffer TJ, Robbins PD: In vivo expression of HGF/NK1 and GLP-1 From dsaav vectors enhances pancreatic ss-cell proliferation and improves pathology in the db/db mouse model of diabetes. 21;59: Wang AY, Peng PD, Ehrhardt A, Storm TA, Kay MA: Comparison of adenoviral and adenoassociated viral vectors for pancreatic gene delivery in vivo. Hum Gene Ther 24;15: Al-Quobaili F, Montenarh M: Pancreatic duodenal homeobox factor-1 and diabetes mellitus type 2 (review). Int J Mol Med 28;21: Poitout V, Robertson RP: Glucolipotoxicity: fuel excess and beta-cell dysfunction. Endocr Rev 28;29: Robertson RP: Beta-cell deterioration during diabetes: what's in the gun? Trends Endocrinol Metab 29;2: Mattson MP: Roles of the lipid peroxidation product 4-hydroxynonenal in obesity, the metabolic syndrome, and associated vascular and neurodegenerative disorders. Exp Gerontol 29;44: Chao YM, Lai MD, Chan JY: Redox-sensitive endoplasmic reticulum stress and autophagy at rostral ventrolateral medulla contribute to hypertension in spontaneously hypertensive rats. Hypertension 213;61: Inoue T, Suzuki-Karasaki Y: Mitochondrial superoxide mediates mitochondrial and endoplasmic reticulum dysfunctions in TRAIL-induced apoptosis in Jurkat cells. Free Radic Biol Med 213;61:
25 Page 25 of Volchuk A, Ron D: The endoplasmic reticulum stress response in the pancreatic beta-cell. Obes Metab 21;12 Suppl 2: Laybutt DR, Preston AM, Akerfeldt MC, Kench JG, Busch AK, Biankin AV, Biden TJ: Endoplasmic reticulum stress contributes to beta cell apoptosis in type 2 diabetes. Diabetologia 27;5: Varga ZV, Giricz Z, Liaudet L, Hasko G, Ferdinandy P, Pacher P: Interplay of oxidative, nitrosative/nitrative stress, inflammation, cell death and autophagy in diabetic cardiomyopathy. Biochim Biophys Acta 214 July 2; DOI: 1.116/j.bbadis 41. Finegood DT, Scaglia L, Bonner-Weir S: Dynamics of beta-cell mass in the growing rat pancreas. Estimation with a simple mathematical model. 1995;44: Bonner-Weir S: Perspective: Postnatal pancreatic beta cell growth. Endocrinology 2;141: Butler AE, Janson J, Bonner-Weir S, Ritzel R, Rizza RA, Butler PC: Beta-cell deficit and increased beta-cell apoptosis in humans with type 2 diabetes. 23;52: Leonardi O, Mints G, Hussain MA: Beta-cell apoptosis in the pathogenesis of human type 2 diabetes mellitus. Eur J Endocrinol 23;149: Medici D, Razzaque MS, Deluca S, Rector TL, Hou B, Kang K, Goetz R, Mohammadi M, Kuro OM, Olsen BR, Lanske B: FGF-23-Klotho signaling stimulates proliferation and prevents vitamin D-induced apoptosis. J Cell Biol 28;182: Shalhoub V, Ward SC, Sun B, Stevens J, Renshaw L, Hawkins N, Richards WG: Fibroblast growth factor 23 (FGF23) and alpha-klotho stimulate osteoblastic MC3T3.E1 cell proliferation and inhibit mineralization. Calcif Tissue Int 211;89: Levine B, Klionsky DJ: Development by self-digestion: molecular mechanisms and biological functions of autophagy. Dev Cell 24;6: Las G, Shirihai OS: The role of autophagy in beta-cell lipotoxicity and type 2 diabetes. Obes Metab 21;12 Suppl 2: Ebato C, Uchida T, Arakawa M, Komatsu M, Ueno T, Komiya K, Azuma K, Hirose T, Tanaka K, Kominami E, Kawamori R, Fujitani Y, Watada H: Autophagy is important in islet homeostasis and compensatory increase of beta cell mass in response to high-fat diet. Cell Metab 28;8: Ichimura Y, Kominami E, Tanaka K, Komatsu M: Selective turnover of p62/a17/sqstm1 by autophagy. Autophagy 28;4:

 Relative Klotho")
 insulin klotho insulin klotho")


.75.")


26 Relative Klotho staining in mouse pancreatic islets (relative mean gray value/pixel) Relative insulin staining in mouse pancreatic islets (relative mean gray value/pixel) Relative Klotho levels in mouse pancreas (normalized to -actin) insulin klotho insulin klotho Relative levels of short form Klotho in human pancreas (normalized ot Relative Klotho staining in human panceatic islet (relative mean gray value/pixel) Relative insulin staining in human panceatic islet (relative mean gray value/pixel) A B Page 26 of 38 1 μm Normal * T2DM Normal * T2DM W/O primary anibody Normal T2DM C 65 KD Klotho D 45 KD -actin) * β-actin lean 1 μm 1 μm db/db E 4. Normal T2DM 1 F 65 kda 42 kda Klotho β-actin ** lean mice db/db mice lean mice db/db mice.5 **. lean mice db/db mice Figure 1
27 Glucose levels (normalized to basal value, 1%) Glucose levels (normalized to the basal, 1%) Urine glucose (mg/dl) Glucose levels (mg/dl) Blood glucose levels (mg/dl) Plasma insulin levels (ng/ml) Plasma insulin levels (ng/ml) Area under the curve (mg/dl*min) Area under the curve (mg/dl*min) Area under the curve (mg/dl*min) Glucose levels (mg/dl) Glucose levels (mg/dl) Glucose levels (mg/dl) Blood glucose levels (mg/dl) Page 27 of 38 A B C D raav injected Age (weeks) GTT in week GTT in week 2 Minutes ++ * GTT in week GTT in week 4 Time (minutes) GTT in week GTT in week 6 Minutes +++ E F G H IST in week IST in week week 3 ** week Minutes Time (minutes) 15 IST in week IST in week ** I week 2 week Minutes Time (minutes) Age (weeks) Figure 2


28 The percentage of insulin-positive cells in islets Insulin release (ng/5 islets/hour) Relatve mean intensity of insulin staining in mouse pancreatic islets (relative mean gray value/pixel) Relatve mean intensity of Klotho staining in mouse pancreatic islets (relative mean gray value/pixel) A Page 28 of 38 B 5 μm without primary ab C 5 μm D without primary ab E F ^^^^^^ ### ^^^ 2.8 mm Glucose 16.7 mm Glucose Figure 3


29 Relatve intensity of PDX-1 staining in islets (relative mean gray value/pixel) DHE staining intensity in islets (mean fluoresence intensity) The number 4-HNE-positive staining cells in islet (%) A Page 29 of 38 5 μm lean-raav-mkl B w/o anti-4-hne antibody C db/db-raav-mkl 5 μm lean-raav-mkl w/o DHE D db/db-raav-mkl E 5 μm lean-raav-mkl F without primary ab db/db-raav-mkl Figure 4


30 Relatve mean intensity of LC3 staining in islets (relative mean gray value/pixel) The number of DNAJC3-positive cells in islets (%) Page 3 of 38 A 5 μm lean-raav-mkl B w/o primary antibody db/db-raav-mkl C lean-raav-mkl D 5 μm w/o primary antibody ** ** ++ db/db-raav-mkl Figure 5


31 Percentage of TUNEL staining postitive cells/islet Percentage of PCNA-positive staining cells/islet Page 31 of 38 A B 5 μm 5 μm lean-raav-mip-gfp lean-raav-mip-mkl db/db-raav-mip-gfp db/db-raav-mip-mkl C D 5 μm lean-raav-mip-gfp lean-raav-mip-mkl db/db-raav-mip-gfp db/db-raav-mip-mkl Figure 6
32 Relative DNAJC3 mrna levels in islets Relative PCNA mrna levels in islets Relative Pdx-1 mrna levels Relative LC3 mrna levels Relative insulin I mrna levels in islets Relative insulin II mrna levels Page 32 of 38 A B 2 1 * * ** ** C D 2 1 * E F * Figure 7
 Relative")
 DHE staining density")


33 Relative p-rac1 level (normlized to Rac1) Relative Rac1 level (normalized to -tubulin) DHE staining density NADPH oxidade activity (superoxide generation, RLU/min/cell) Page 33 of 38 A NADPH Minutes 5 mm G 25 mm G 25 mm G + pmcs 25 mm G + pmkl B DAPI DHE C * * + Bright field 5 mm G 25 mm G 25 mm G + pmcs 25 mm G + pmkl 5 mm Glucose 25 mm Glucose 25 mm Glucose + pmcs 25 mm Glucose + pmkl D E F 22 kda 22 kda 42 kda 13 kda 65 kda 42 kda 5 mm Glucose mm Glucose pmcs pmkl p-rac1 Rac1 α-tubulin Full-length KL Short form KL α-tubulin mm G * * + 25 mm G 25 mm G + pmcs 25 mm G + pmkl mm G 25 mm G 25 mm G + pmcs 25 mm G + pmkl Figure 8
Online Data Supplement. Anti-aging Gene Klotho Enhances Glucose-induced Insulin Secretion by Upregulating Plasma Membrane Retention of TRPV2
 Online Data Supplement Anti-aging Gene Klotho Enhances Glucose-induced Insulin Secretion by Upregulating Plasma Membrane Retention of TRPV2 Yi Lin and Zhongjie Sun Department of physiology, college of
General Laboratory methods Plasma analysis: Gene Expression Analysis: Immunoblot analysis: Immunohistochemistry:
 General Laboratory methods Plasma analysis: Plasma insulin (Mercodia, Sweden), leptin (duoset, R&D Systems Europe, Abingdon, United Kingdom), IL-6, TNFα and adiponectin levels (Quantikine kits, R&D Systems
(A) PCR primers (arrows) designed to distinguish wild type (P1+P2), targeted (P1+P2) and excised (P1+P3)14-
 PCR primers (arrows) designed to distinguish wild type (P1+P2), targeted (P1+P2) and excised (P1+P3)14-") 1 Supplemental Figure Legends Figure S1. Mammary tumors of ErbB2 KI mice with 14-3-3σ ablation have elevated ErbB2 transcript levels and cell proliferation (A) PCR primers (arrows) designed to distinguish
1 Supplemental Figure Legends Figure S1. Mammary tumors of ErbB2 KI mice with 14-3-3σ ablation have elevated ErbB2 transcript levels and cell proliferation (A) PCR primers (arrows) designed to distinguish
Supplementary Materials and Methods
 Supplementary Materials and Methods Immunoblotting Immunoblot analysis was performed as described previously (1). Due to high-molecular weight of MUC4 (~ 950 kda) and MUC1 (~ 250 kda) proteins, electrophoresis
Impact factor: Reporter:4A1H0019 Chen Zi Hao 4A1H0023 Huang Wan ting 4A1H0039 Sue Yi Zhu 4A1H0070 Lin Guan cheng 4A1H0077 Chen Bo xuan
 Curcumin Protects Neonatal Rat Cardiomyocytes against High Glucose-Induced Apoptosis via PI3K/Akt Signalling Pathway Wei Yu,1,2 Wenliang Zha,1 Zhiqiang Ke,1 Qing Min,2 Cairong Li,1 Huirong Sun,3 and Chao
Sestrin2 and BNIP3 (Bcl-2/adenovirus E1B 19kDa-interacting. protein3) regulate autophagy and mitophagy in renal tubular cells in. acute kidney injury
 regulate autophagy and mitophagy in renal tubular cells in. acute kidney injury") Sestrin2 and BNIP3 (Bcl-2/adenovirus E1B 19kDa-interacting protein3) regulate autophagy and mitophagy in renal tubular cells in acute kidney injury by Masayuki Ishihara 1, Madoka Urushido 2, Kazu Hamada
Sestrin2 and BNIP3 (Bcl-2/adenovirus E1B 19kDa-interacting protein3) regulate autophagy and mitophagy in renal tubular cells in acute kidney injury by Masayuki Ishihara 1, Madoka Urushido 2, Kazu Hamada
Supplementary Fig. 1. Identification of acetylation of K68 of SOD2
 Supplementary Fig. 1. Identification of acetylation of K68 of SOD2 A B H. sapiens 54 KHHAAYVNNLNVTEEKYQEALAK 75 M. musculus 54 KHHAAYVNNLNATEEKYHEALAK 75 X. laevis 55 KHHATYVNNLNITEEKYAEALAK 77 D. rerio
(a) Significant biological processes (upper panel) and disease biomarkers (lower panel)
 Significant biological processes (upper panel) and disease biomarkers (lower panel)") Supplementary Figure 1. Functional enrichment analyses of secretomic proteins. (a) Significant biological processes (upper panel) and disease biomarkers (lower panel) 2 involved by hrab37-mediated secretory
Supplementary Figure 1. Functional enrichment analyses of secretomic proteins. (a) Significant biological processes (upper panel) and disease biomarkers (lower panel) 2 involved by hrab37-mediated secretory
Supporting Information
 Supporting Information Pang et al. 10.1073/pnas.1322009111 SI Materials and Methods ELISAs. These assays were performed as previously described (1). ELISA plates (MaxiSorp Nunc; Thermo Fisher Scientific)
SUPPLEMENTARY INFORMATION
 SUPPLEMENTARY INFORMATION FOR Liver X Receptor α mediates hepatic triglyceride accumulation through upregulation of G0/G1 Switch Gene 2 (G0S2) expression I: SUPPLEMENTARY METHODS II: SUPPLEMENTARY FIGURES
Yi Lin and Zhongjie Sun. Department of Physiology, College of Medicine, University of Oklahoma Health Sciences Center, Oklahoma City, OK73104, USA
 Page 1 of 35 Anti-aging Gene Klotho Attenuates Pancreatic β Cell Apoptosis in Type I Yi Lin and Zhongjie Sun Department of Physiology, College of Medicine, University of Oklahoma Health Sciences Center,
Islet viability assay and Glucose Stimulated Insulin Secretion assay RT-PCR and Western Blot
 Islet viability assay and Glucose Stimulated Insulin Secretion assay Islet cell viability was determined by colorimetric (3-(4,5-dimethylthiazol-2-yl)-2,5- diphenyltetrazolium bromide assay using CellTiter
TFEB-mediated increase in peripheral lysosomes regulates. Store Operated Calcium Entry
 TFEB-mediated increase in peripheral lysosomes regulates Store Operated Calcium Entry Luigi Sbano, Massimo Bonora, Saverio Marchi, Federica Baldassari, Diego L. Medina, Andrea Ballabio, Carlotta Giorgi
SUPPLEMENTARY INFORMATION
 Supplementary Figures Supplementary Figure S1. Binding of full-length OGT and deletion mutants to PIP strips (Echelon Biosciences). Supplementary Figure S2. Binding of the OGT (919-1036) fragments with
SUPPLEMENTAL MATERIAL. Supplementary Methods
 SUPPLEMENTAL MATERIAL Supplementary Methods Culture of cardiomyocytes, fibroblasts and cardiac microvascular endothelial cells The isolation and culturing of neonatal rat ventricular cardiomyocytes was
SUPPLEMENTARY INFORMATION. Supplementary Figures S1-S9. Supplementary Methods
 SUPPLEMENTARY INFORMATION SUMO1 modification of PTEN regulates tumorigenesis by controlling its association with the plasma membrane Jian Huang 1,2#, Jie Yan 1,2#, Jian Zhang 3#, Shiguo Zhu 1, Yanli Wang
p47 negatively regulates IKK activation by inducing the lysosomal degradation of polyubiquitinated NEMO
 Supplementary Information p47 negatively regulates IKK activation by inducing the lysosomal degradation of polyubiquitinated NEMO Yuri Shibata, Masaaki Oyama, Hiroko Kozuka-Hata, Xiao Han, Yuetsu Tanaka,
MTC-TT and TPC-1 cell lines were cultured in RPMI medium (Gibco, Breda, The Netherlands)
") Supplemental data Materials and Methods Cell culture MTC-TT and TPC-1 cell lines were cultured in RPMI medium (Gibco, Breda, The Netherlands) supplemented with 15% or 10% (for TPC-1) fetal bovine serum
Supplemental data Materials and Methods Cell culture MTC-TT and TPC-1 cell lines were cultured in RPMI medium (Gibco, Breda, The Netherlands) supplemented with 15% or 10% (for TPC-1) fetal bovine serum
MicroRNA sponges: competitive inhibitors of small RNAs in mammalian cells
 MicroRNA sponges: competitive inhibitors of small RNAs in mammalian cells Margaret S Ebert, Joel R Neilson & Phillip A Sharp Supplementary figures and text: Supplementary Figure 1. Effect of sponges on
Protocol for Gene Transfection & Western Blotting
 The schedule and the manual of basic techniques for cell culture Advanced Protocol for Gene Transfection & Western Blotting Schedule Day 1 26/07/2008 Transfection Day 3 28/07/2008 Cell lysis Immunoprecipitation
Supplementary Fig. 1. GPRC5A post-transcriptionally down-regulates EGFR expression. (a) Plot of the changes in steady state mrna levels versus
 Plot of the changes in steady state mrna levels versus") Supplementary Fig. 1. GPRC5A post-transcriptionally down-regulates EGFR expression. (a) Plot of the changes in steady state mrna levels versus changes in corresponding proteins between wild type and Gprc5a-/-
Supplementary Fig. 1. GPRC5A post-transcriptionally down-regulates EGFR expression. (a) Plot of the changes in steady state mrna levels versus changes in corresponding proteins between wild type and Gprc5a-/-
Figure S1. Generation of inducible PTEN deficient mice and the BMMCs (A) B6.129 Pten loxp/loxp mice were mated with B6.
 B6.129 Pten loxp/loxp mice were mated with B6.") Figure S1. Generation of inducible PTEN deficient mice and the BMMCs (A) B6.129 Pten loxp/loxp mice were mated with B6.129-Gt(ROSA)26Sor tm1(cre/ert2)tyj /J mice. To induce deletion of the Pten locus,
Figure S1. Generation of inducible PTEN deficient mice and the BMMCs (A) B6.129 Pten loxp/loxp mice were mated with B6.129-Gt(ROSA)26Sor tm1(cre/ert2)tyj /J mice. To induce deletion of the Pten locus,
(Stratagene, La Jolla, CA) (Supplemental Fig. 1A). A 5.4-kb EcoRI fragment
 (Supplemental Fig. 1A). A 5.4-kb EcoRI fragment") SUPPLEMENTAL INFORMATION Supplemental Methods Generation of RyR2-S2808D Mice Murine genomic RyR2 clones were isolated from a 129/SvEvTacfBR λ-phage library (Stratagene, La Jolla, CA) (Supplemental Fig.
SUPPLEMENTAL INFORMATION Supplemental Methods Generation of RyR2-S2808D Mice Murine genomic RyR2 clones were isolated from a 129/SvEvTacfBR λ-phage library (Stratagene, La Jolla, CA) (Supplemental Fig.
Chapter 3. Expression of α5-megfp in Mouse Cortical Neurons. on the β subunit. Signal sequences in the M3-M4 loop of β nachrs bind protein factors to
 22 Chapter 3 Expression of α5-megfp in Mouse Cortical Neurons Subcellular localization of the neuronal nachr subtypes α4β2 and α4β4 depends on the β subunit. Signal sequences in the M3-M4 loop of β nachrs
SUPPLEMENTARY INFORMATION
 doi:10.1038/nature12652 Supplementary Figure 1. PRDM16 interacts with endogenous EHMT1 in brown adipocytes. Immunoprecipitation of PRDM16 complex by flag antibody (M2) followed by Western blot analysis
Supplemental Materials and Methods Plasmids and viruses Quantitative Reverse Transcription PCR Generation of molecular standard for quantitative PCR
 Supplemental Materials and Methods Plasmids and viruses To generate pseudotyped viruses, the previously described recombinant plasmids pnl4-3-δnef-gfp or pnl4-3-δ6-drgfp and a vector expressing HIV-1 X4
Supplementary Figures
 Supplementary Figures Supplementary Figure 1 Characterization of stable expression of GlucB and sshbira in the CT26 cell line (a) Live cell imaging of stable CT26 cells expressing green fluorescent protein
The Schedule and the Manual of Basic Techniques for Cell Culture
 The Schedule and the Manual of Basic Techniques for Cell Culture 1 Materials Calcium Phosphate Transfection Kit: Invitrogen Cat.No.K2780-01 Falcon tube (Cat No.35-2054:12 x 75 mm, 5 ml tube) Cell: 293
Supplementary Table 1. The primers used for quantitative RT-PCR. Gene name Forward (5 > 3 ) Reverse (5 > 3 )
 Reverse (5 > 3 )") 770 771 Supplementary Table 1. The primers used for quantitative RT-PCR. Gene name Forward (5 > 3 ) Reverse (5 > 3 ) Human CXCL1 GCGCCCAAACCGAAGTCATA ATGGGGGATGCAGGATTGAG PF4 CCCCACTGCCCAACTGATAG TTCTTGTACAGCGGGGCTTG
770 771 Supplementary Table 1. The primers used for quantitative RT-PCR. Gene name Forward (5 > 3 ) Reverse (5 > 3 ) Human CXCL1 GCGCCCAAACCGAAGTCATA ATGGGGGATGCAGGATTGAG PF4 CCCCACTGCCCAACTGATAG TTCTTGTACAGCGGGGCTTG
Suppl. Figure 1. T 3 induces autophagic flux in hepatic cells. (A) RFP-GFP-LC3 transfected HepG2/TRα cells were visualized and cells were quantified
 RFP-GFP-LC3 transfected HepG2/TRα cells were visualized and cells were quantified") Suppl. Figure 1. T 3 induces autophagic flux in hepatic cells. (A) RFP-GFP-LC3 transfected HepG2/TRα cells were visualized and cells were quantified for RFP-LC3 puncta (red dots) representing both autolysosomes
Suppl. Figure 1. T 3 induces autophagic flux in hepatic cells. (A) RFP-GFP-LC3 transfected HepG2/TRα cells were visualized and cells were quantified for RFP-LC3 puncta (red dots) representing both autolysosomes
(A) RT-PCR for components of the Shh/Gli pathway in normal fetus cell (MRC-5) and a
 RT-PCR for components of the Shh/Gli pathway in normal fetus cell (MRC-5) and a") Supplementary figure legends Supplementary Figure 1. Expression of Shh signaling components in a panel of gastric cancer. (A) RT-PCR for components of the Shh/Gli pathway in normal fetus cell (MRC-5) and
Supplementary figure legends Supplementary Figure 1. Expression of Shh signaling components in a panel of gastric cancer. (A) RT-PCR for components of the Shh/Gli pathway in normal fetus cell (MRC-5) and
Supplementary Figure 1.
 Supplementary Figure 1. Increased β cell mass and islet diameter in βtsc2 -/- mice up to 35 weeks A: Reconstruction of multiple anti-insulin immunofluorescence images showing differences in β cell mass
Antibodies for Unfolded Protein Response
 Novus-lu-2945 Antibodies for Unfolded rotein Response Unfolded roteins ER lumen GR78 IRE-1 GR78 ERK Cytosol GR78 TRAF2 ASK1 JNK Activator Intron RIDD elf2α Degraded mrna XB1 mrna Translation XB1-S (p50)
HEK293FT cells were transiently transfected with reporters, N3-ICD construct and
 Supplementary Information Luciferase reporter assay HEK293FT cells were transiently transfected with reporters, N3-ICD construct and increased amounts of wild type or kinase inactive EGFR. Transfections
Supplementary Figure 1.TRIM33 binds β-catenin in the nucleus. a & b, Co-IP of endogenous TRIM33 with β-catenin in HT-29 cells (a) and HEK 293T cells
 and HEK 293T cells") Supplementary Figure 1.TRIM33 binds β-catenin in the nucleus. a & b, Co-IP of endogenous TRIM33 with β-catenin in HT-29 cells (a) and HEK 293T cells (b). TRIM33 was immunoprecipitated, and the amount of
Supplementary Figure 1.TRIM33 binds β-catenin in the nucleus. a & b, Co-IP of endogenous TRIM33 with β-catenin in HT-29 cells (a) and HEK 293T cells (b). TRIM33 was immunoprecipitated, and the amount of
Impact of hyper-o-glcnacylation on apoptosis and NF-κB activity SUPPLEMENTARY METHODS
 SUPPLEMENTARY METHODS 3D culture and cell proliferation- MiaPaCa-2 cell culture in 3D was performed as described previously (1). Briefly, 8-well glass chamber slides were evenly coated with 50 µl/well
Oncolytic Adenovirus Complexes Coated with Lipids and Calcium Phosphate for Cancer Gene Therapy
 Oncolytic Adenovirus Complexes Coated with Lipids and Calcium Phosphate for Cancer Gene Therapy Jianhua Chen, Pei Gao, Sujing Yuan, Rongxin Li, Aimin Ni, Liang Chu, Li Ding, Ying Sun, Xin-Yuan Liu, Yourong
Chemical Chaperones Mitigate Experimental Asthma By Attenuating Endoplasmic
 Chemical Chaperones Mitigate Experimental Asthma By Attenuating Endoplasmic Reticulum Stress Lokesh Makhija, BE, Veda Krishnan, MSc, Rakhshinda Rehman, MTech, Samarpana Chakraborty, MSc, Shuvadeep Maity,
Supplementary data Supplementary Figure 1 Supplementary Figure 2
 Supplementary data Supplementary Figure 1 SPHK1 sirna increases RANKL-induced osteoclastogenesis in RAW264.7 cell culture. (A) RAW264.7 cells were transfected with oligocassettes containing SPHK1 sirna
Supplemental Information
 Supplemental Information Tobacco-specific Carcinogen Induces DNA Methyltransferases 1 Accumulation through AKT/GSK3β/βTrCP/hnRNP-U in Mice and Lung Cancer patients Ruo-Kai Lin, 1 Yi-Shuan Hsieh, 2 Pinpin
hexahistidine tagged GRP78 devoid of the KDEL motif (GRP78-His) on SDS-PAGE. This
 on SDS-PAGE. This") SUPPLEMENTAL FIGURE LEGEND Fig. S1. Generation and characterization of. (A) Coomassie staining of soluble hexahistidine tagged GRP78 devoid of the KDEL motif (GRP78-His) on SDS-PAGE. This protein was expressed
SUPPLEMENTAL FIGURE LEGEND Fig. S1. Generation and characterization of. (A) Coomassie staining of soluble hexahistidine tagged GRP78 devoid of the KDEL motif (GRP78-His) on SDS-PAGE. This protein was expressed
Insulin mrna to Protein Kit
 Insulin mrna to Protein Kit A 3DMD Paper BioInformatics and Mini-Toober Folding Activity Student Handout www.3dmoleculardesigns.com Insulin mrna to Protein Kit Contents Becoming Familiar with the Data...
Construction of a hepatocellular carcinoma cell line that stably expresses stathmin with a Ser25 phosphorylation site mutation
 Construction of a hepatocellular carcinoma cell line that stably expresses stathmin with a Ser25 phosphorylation site mutation J. Du 1, Z.H. Tao 2, J. Li 2, Y.K. Liu 3 and L. Gan 2 1 Department of Chemistry,
c Ischemia (30 min) Reperfusion (8 w) Supplementary Figure bp 300 bp Ischemia (30 min) Reperfusion (4 h) Dox 20 mg/kg i.p.
 Reperfusion (8 w) Supplementary Figure bp 300 bp Ischemia (30 min) Reperfusion (4 h) Dox 20 mg/kg i.p.") a Marker Ripk3 +/ 5 bp 3 bp b Ischemia (3 min) Reperfusion (4 h) d 2 mg/kg i.p. 1 w 5 w Sacrifice for IF size A subset for echocardiography and morphological analysis c Ischemia (3 min) Reperfusion (8
a Marker Ripk3 +/ 5 bp 3 bp b Ischemia (3 min) Reperfusion (4 h) d 2 mg/kg i.p. 1 w 5 w Sacrifice for IF size A subset for echocardiography and morphological analysis c Ischemia (3 min) Reperfusion (8
Supplementary Figure S1. Venn diagram analysis of mrna microarray data and mirna target analysis. (a) Western blot analysis of T lymphoblasts (CLS)
 Western blot analysis of T lymphoblasts (CLS)") Supplementary Figure S1. Venn diagram analysis of mrna microarray data and mirna target analysis. (a) Western blot analysis of T lymphoblasts (CLS) and their exosomes (EXO) in resting (REST) and activated
Supplementary Figure S1. Venn diagram analysis of mrna microarray data and mirna target analysis. (a) Western blot analysis of T lymphoblasts (CLS) and their exosomes (EXO) in resting (REST) and activated
Cells and reagents. Synaptopodin knockdown (1) and dynamin knockdown (2)
 and dynamin knockdown (2)") Supplemental Methods Cells and reagents. Synaptopodin knockdown (1) and dynamin knockdown (2) podocytes were cultured as described previously. Staurosporine, angiotensin II and actinomycin D were all obtained
Supplemental Methods Cells and reagents. Synaptopodin knockdown (1) and dynamin knockdown (2) podocytes were cultured as described previously. Staurosporine, angiotensin II and actinomycin D were all obtained
Supplementary Figure 1. Normal T lymphocyte populations in Dapk -/- mice. (a) Normal thymic development in Dapk -/- mice. Thymocytes from WT and Dapk
 Normal thymic development in Dapk -/- mice. Thymocytes from WT and Dapk") Supplementary Figure 1. Normal T lymphocyte populations in Dapk -/- mice. (a) Normal thymic development in Dapk -/- mice. Thymocytes from WT and Dapk -/- mice were stained for expression of CD4 and CD8.
Supplementary Figure 1. Normal T lymphocyte populations in Dapk -/- mice. (a) Normal thymic development in Dapk -/- mice. Thymocytes from WT and Dapk -/- mice were stained for expression of CD4 and CD8.
Data Sheet TIGIT / NFAT Reporter - Jurkat Cell Line Catalog #60538
 Data Sheet TIGIT / NFAT Reporter - Jurkat Cell Line Catalog #60538 Background: TIGIT is a co-inhibitory receptor that is highly expressed in Natural Killer (NK) cells, activated CD4+, CD8+ and regulatory
Student name ID # 2. (4 pts) What is the terminal electron acceptor in respiration? In photosynthesis?
 What is the terminal electron acceptor in respiration? In photosynthesis?") 1. Membrane transport. A. (4 pts) What ion couples primary and secondary active transport in animal cells? What ion serves the same function in plant cells? 2. (4 pts) What is the terminal electron acceptor
1. Membrane transport. A. (4 pts) What ion couples primary and secondary active transport in animal cells? What ion serves the same function in plant cells? 2. (4 pts) What is the terminal electron acceptor
BIOL212 Biochemistry of Disease. Metabolic Disorders - Obesity
 BIOL212 Biochemistry of Disease Metabolic Disorders - Obesity Obesity Approx. 23% of adults are obese in the U.K. The number of obese children has tripled in 20 years. 10% of six year olds are obese, rising
Supplemental Data. Short Article. ATF4-Mediated Induction of 4E-BP1. Contributes to Pancreatic β Cell Survival. under Endoplasmic Reticulum Stress
 Cell Metabolism, Volume 7 Supplemental Data Short Article ATF4-Mediated Induction of 4E-BP1 Contributes to Pancreatic β Cell Survival under Endoplasmic Reticulum Stress Suguru Yamaguchi, Hisamitsu Ishihara,
TITLE: The Role of hcdc4 as a Tumor Suppressor Gene in Genomic Instability Underlying Prostate Cancer
 AD Award Number: TITLE: The Role of hcdc4 as a Tumor Suppressor Gene in Genomic Instability Underlying Prostate Cancer PRINCIPAL INVESTIGATOR: Audrey van Drogen, Ph.D. CONTRACTING ORGANIZATION: Sidney
Supplementary Figure 1. SC35M polymerase activity in the presence of Bat or SC35M NP encoded from the phw2000 rescue plasmid.
 1 2 3 4 5 6 7 8 9 10 11 12 13 14 15 16 17 18 19 20 21 22 23 24 25 26 27 Supplementary Figure 1. SC35M polymerase activity in the presence of Bat or SC35M NP encoded from the phw2000 rescue plasmid. HEK293T
Supplementary Materials for
 immunology.sciencemag.org/cgi/content/full/2/16/eaan6049/dc1 Supplementary Materials for Enzymatic synthesis of core 2 O-glycans governs the tissue-trafficking potential of memory CD8 + T cells Jossef
Insulin Resistance. Biol 405 Molecular Medicine
 Insulin Resistance Biol 405 Molecular Medicine Insulin resistance: a subnormal biological response to insulin. Defects of either insulin secretion or insulin action can cause diabetes mellitus. Insulin-dependent
SUPPLEMENTARY INFORMATION
 Figure S1 Induction of non-apoptotic death of SV40-transformed and primary DKO MEFs, and DKO thymocytes. (A-F) STS-induced non-apoptotic death of DKO MEF. (A, B) Reduced viability of DKO MEFs after exposure
Supplementary Table 1. Primer sequences for conventional RT-PCR on mouse islets
 Supplementary Table 1. Primer sequences for conventional RT-PCR on mouse islets Gene 5 Forward 3 5 Reverse 3.T. Product (bp) ( C) mnox1 GTTCTTGGGCTGCCTTGG GCTGGGGCGGCGG 60 300 mnoxa1 GCTTTGCCGCGTGC GGTTCGGGTCCTTTGTGC
A Central Role of MG53 in Metabolic Syndrome. and Type-2 Diabetes
 A Central Role of MG53 in Metabolic Syndrome and Type-2 Diabetes Yan Zhang, Chunmei Cao, Rui-Ping Xiao Institute of Molecular Medicine (IMM) Peking University, Beijing, China Accelerated Aging in China
The Annexin V Apoptosis Assay
 The Annexin V Apoptosis Assay Development of the Annexin V Apoptosis Assay: 1990 Andree at al. found that a protein, Vascular Anticoagulant α, bound to phospholipid bilayers in a calcium dependent manner.
A Hepatocyte Growth Factor Receptor (Met) Insulin Receptor hybrid governs hepatic glucose metabolism SUPPLEMENTARY FIGURES, LEGENDS AND METHODS
 Insulin Receptor hybrid governs hepatic glucose metabolism SUPPLEMENTARY FIGURES, LEGENDS AND METHODS") A Hepatocyte Growth Factor Receptor (Met) Insulin Receptor hybrid governs hepatic glucose metabolism Arlee Fafalios, Jihong Ma, Xinping Tan, John Stoops, Jianhua Luo, Marie C. DeFrances and Reza Zarnegar
A Hepatocyte Growth Factor Receptor (Met) Insulin Receptor hybrid governs hepatic glucose metabolism Arlee Fafalios, Jihong Ma, Xinping Tan, John Stoops, Jianhua Luo, Marie C. DeFrances and Reza Zarnegar
Supporting Information
 Supporting Information Palmisano et al. 10.1073/pnas.1202174109 Fig. S1. Expression of different transgenes, driven by either viral or human promoters, is up-regulated by amino acid starvation. (A) Quantification
Soft Agar Assay. For each cell pool, 100,000 cells were resuspended in 0.35% (w/v)
") SUPPLEMENTARY MATERIAL AND METHODS Soft Agar Assay. For each cell pool, 100,000 cells were resuspended in 0.35% (w/v) top agar (LONZA, SeaKem LE Agarose cat.5004) and plated onto 0.5% (w/v) basal agar.
SUPPLEMENTARY MATERIAL AND METHODS Soft Agar Assay. For each cell pool, 100,000 cells were resuspended in 0.35% (w/v) top agar (LONZA, SeaKem LE Agarose cat.5004) and plated onto 0.5% (w/v) basal agar.
Supporting Information
 Supporting Information Franco et al. 10.1073/pnas.1015557108 SI Materials and Methods Drug Administration. PD352901 was dissolved in 0.5% (wt/vol) hydroxyl-propyl-methylcellulose, 0.2% (vol/vol) Tween
Supplemental Materials, Nishimura et al, Page1 of 22 1
 Supplemental Materials, Nishimura et al, Page of 5 Quantitative assessment of Pdx promoter activity in vivo using a secreted luciferase reporter system 6 7 8 9 Wataru Nishimura, Koki Eto, Atsushi Miki,
doi: /nature14508 Rappsilber et al.
 SUPPLEMENTARY INFORMATION doi:1.138/nature1458 Grosso et al. Barbosa et al. 74 72 45 33 47 7 51 Rappsilber et al. Supplementary Figure 1 a, Venn-Diagram of identified splice factors in the work of Barbossa
Supplementary Figure 1.
 Supplementary Figure 1. Visualization of endoplasmic reticulum-mitochondria interaction by in situ proximity ligation assay. A) Illustration of targeted proteins in mitochondria (M), endoplasmic reticulum
Protection against doxorubicin-induced myocardial dysfunction in mice by cardiac-specific expression of carboxyl terminus of hsp70-interacting protein
 Protection against doxorubicin-induced myocardial dysfunction in mice by cardiac-specific expression of carboxyl terminus of hsp70-interacting protein Lei Wang 1, Tian-Peng Zhang 1, Yuan Zhang 2, Hai-Lian
Project report October 2012 March 2013 CRF fellow: Principal Investigator: Project title:
 Project report October 2012 March 2013 CRF fellow: Gennaro Napolitano Principal Investigator: Sergio Daniel Catz Project title: Small molecule regulators of vesicular trafficking to enhance lysosomal exocytosis
Human Leptin ELISA Kit
 Product Manual Human Leptin ELISA Kit Catalog Numbers MET-5057 MET-5057-5 96 assays 5 x 96 assays FOR RESEARCH USE ONLY Not for use in diagnostic procedures Introduction Leptin is a polypeptide hormone
Supplemental Information. Increased 4E-BP1 Expression Protects. against Diet-Induced Obesity and Insulin. Resistance in Male Mice
 Cell Reports, Volume 16 Supplemental Information Increased 4E-BP1 Expression Protects against Diet-Induced Obesity and Insulin Resistance in Male Mice Shih-Yin Tsai, Ariana A. Rodriguez, Somasish G. Dastidar,
ab SREBP-2 Translocation Assay Kit (Cell-Based)
") ab133114 SREBP-2 Translocation Assay Kit (Cell-Based) Instructions for Use For analysis of translocation of SREBP-2 into nuclei. This product is for research use only and is not intended for diagnostic
ab133114 SREBP-2 Translocation Assay Kit (Cell-Based) Instructions for Use For analysis of translocation of SREBP-2 into nuclei. This product is for research use only and is not intended for diagnostic
Supplementary Figure 1. DJ-1 modulates ROS concentration in mouse skeletal muscle.
 Supplementary Figure 1. DJ-1 modulates ROS concentration in mouse skeletal muscle. (a) mrna levels of Dj1 measured by quantitative RT-PCR in soleus, gastrocnemius (Gastroc.) and extensor digitorum longus
Supplementary Information POLO-LIKE KINASE 1 FACILITATES LOSS OF PTEN-INDUCED PROSTATE CANCER FORMATION
 Supplementary Information POLO-LIKE KINASE 1 FACILITATES LOSS OF PTEN-INDUCED PROSTATE CANCER FORMATION X. Shawn Liu 1, 3, Bing Song 2, 3, Bennett D. Elzey 3, 4, Timothy L. Ratliff 3, 4, Stephen F. Konieczny
18. PANCREATIC FUNCTION AND METABOLISM. Pancreatic secretions ISLETS OF LANGERHANS. Insulin
 18. PANCREATIC FUNCTION AND METABOLISM ISLETS OF LANGERHANS Some pancreatic functions have already been discussed in the digestion section. In this one, the emphasis will be placed on the endocrine function
Supporting Information
 Supporting Information Soltani et al. 10.1073/pnas.1102715108 SI Experimental Procedures Evaluation of Mice and Drug Administration. IPGTT, insulin tolerance test, and glucagon tolerance test were performed
Name Animal source Vendor Cat # Dilutions
 Supplementary data Table S1. Primary and Secondary antibody sources Devi et al, TXNIP in mitophagy A. Primary Antibodies Name Animal source Vendor Cat # Dilutions 1. TXNIP mouse MBL KO205-2 1:2000 (WB)
Cell Adaptation, Cell Injury and Cell Death
 Cell Adaptation, Cell Injury and Cell Death Pathology:- is the study of structural and functional abnormalities that are expressed as diseases of organs and systems. Modern pathology, proposed that injury
Total Phosphatidic Acid Assay Kit
 Product Manual Total Phosphatidic Acid Assay Kit Catalog Number MET- 5019 100 assays FOR RESEARCH USE ONLY Not for use in diagnostic procedures Introduction Phosphatidic Acid (PA) is a critical precursor
Introduction. Acute sodium overload produces renal tubulointerstitial inflammation in normal rats
 Acute sodium overload produces renal tubulointerstitial inflammation in normal rats MI Roson, et al. Kidney International (2006) Introduction Present by Kanya Bunnan and Wiraporn paebua Tubular sodium
Product Manual. Human LDLR ELISA Kit. Catalog Number. FOR RESEARCH USE ONLY Not for use in diagnostic procedures
 Product Manual Human LDLR ELISA Kit Catalog Number STA-386 96 assays FOR RESEARCH USE ONLY Not for use in diagnostic procedures Introduction Cholesterol is an essential component of cellular membranes,
Supplemental Figure 1
 Supplemental Figure 1 A S100A4: SFLGKRTDEAAFQKLMSNLDSNRDNEVDFQEYCVFLSCIAMMCNEFFEGFPDK Overlap: SF G DE KLM LD N D VDFQEY VFL I M N FF G PD S100A2: SFVGEKVDEEGLKKLMGSLDENSDQQVDFQEYAVFLALITVMCNDFFQGCPDR
ZL ZDF ZDF + E2 *** Visceral (g) ZDF
 ZDF") Body Weight (g) 4 3 2 1 ** * ZL ZDF 6 8 1 12 14 16 Age (weeks) B * Sub-cutaneous (g) 16 12 8 4 ZL ZDF Visceral (g) 25 2 15 1 5 ZL ZDF Total fat pad weight (g) 4 3 2 1 ZDF ZL Supplemental Figure 1: Effect
Body Weight (g) 4 3 2 1 ** * ZL ZDF 6 8 1 12 14 16 Age (weeks) B * Sub-cutaneous (g) 16 12 8 4 ZL ZDF Visceral (g) 25 2 15 1 5 ZL ZDF Total fat pad weight (g) 4 3 2 1 ZDF ZL Supplemental Figure 1: Effect
Cell Quality Control. Peter Takizawa Department of Cell Biology
 Cell Quality Control Peter Takizawa Department of Cell Biology Cellular quality control reduces production of defective proteins. Cells have many quality control systems to ensure that cell does not build
Constitutive Reporter Lentiviral Vectors Expressing Fluorescent Proteins
 Constitutive Reporter Lentiviral Vectors Expressing Fluorescent Proteins www.vectalys.com/products/ Constitutive Reporter Lentiviral Vectors Catalog Number referring to this User Manual: 0008VCT; 0009VCT;
Figure S1 Time-dependent down-modulation of HER3 by EZN No Treatment. EZN-3920, 2 μm. Time, h
 Figure S1 Time-dependent down-modulation of HER3 by EZN-392 HE ER3 mrna A, %Contr rol 12 No Treatment EZN-392, 2 μm 1 8 6 4 2 2 8 24 Time, h Figure S2. Specific target down-modulation by HER3 (EZN-392)
Supplemental Figure 1. Western blot analysis indicated that MIF was detected in the fractions of
 Supplemental Figure Legends Supplemental Figure 1. Western blot analysis indicated that was detected in the fractions of plasma membrane and cytosol but not in nuclear fraction isolated from Pkd1 null
1. Materials and Methods 1.1 Animals experiments process The experiments were approved by the Institution Animal Ethics Committee of Jilin University
 1. Materials and Methods 1.1 Animals experiments process The experiments were approved by the Institution Animal Ethics Committee of Jilin University (Reference NO. 2015-003). 96 Kunming (KM) mice (8 weeks;
Supplementary Figure 1: si-craf but not si-braf sensitizes tumor cells to radiation.
 Supplementary Figure 1: si-craf but not si-braf sensitizes tumor cells to radiation. (a) Embryonic fibroblasts isolated from wildtype (WT), BRAF -/-, or CRAF -/- mice were irradiated (6 Gy) and DNA damage
Electron micrograph of phosphotungstanic acid-stained exosomes derived from murine
 1 SUPPLEMENTARY INFORMATION SUPPLEMENTARY FIGURES Supplementary Figure 1. Physical properties of murine DC-derived exosomes. a, Electron micrograph of phosphotungstanic acid-stained exosomes derived from
The Interaction of Alcohol and Iron-Overload in the in-vivo Regulation of Iron Responsive Genes
 Cantaurus, Vol. 5, -, May 7 McPherson College Division of Science and Technology The Interaction of Alcohol and Iron-Overload in the in-vivo Regulation of Iron Responsive Genes Callie Crist, Elizabeth
Supplementary information
 Supplementary information Human Cytomegalovirus MicroRNA mir-us4-1 Inhibits CD8 + T Cell Response by Targeting ERAP1 Sungchul Kim, Sanghyun Lee, Jinwook Shin, Youngkyun Kim, Irini Evnouchidou, Donghyun
SUPPLEMENTARY INFORMATION
 DOI: 10.1038/ncb3461 In the format provided by the authors and unedited. Supplementary Figure 1 (associated to Figure 1). Cpeb4 gene-targeted mice develop liver steatosis. a, Immunoblot displaying CPEB4
A. Generation and characterization of Ras-expressing autophagycompetent
 Supplemental Material Supplemental Figure Legends Fig. S1 A. Generation and characterization of Ras-expressing autophagycompetent and -deficient cell lines. HA-tagged H-ras V12 was stably expressed in
For pair feeding, mice were fed 2.7g of HFD containing tofogliflozin
 Materials and Methods Pair Feeding Experiment For pair feeding, mice were fed 2.7g of HFD containing tofogliflozin (0.005%), which is average daily food intake of mice fed control HFD ad libitum at week
Figure S1 (A) Comparison of body weight and blood glucose levels in male wild-type (WT) and Cre littermates. Mice were maintained on a normal chow
 Comparison of body weight and blood glucose levels in male wild-type (WT) and Cre littermates. Mice were maintained on a normal chow") Figure S1 (A) Comparison of body weight and blood glucose levels in male wild-type (WT) and Cre littermates. Mice were maintained on a normal chow diet (n = 7 per genotype). Body weight and fed blood glucose
Figure S1 (A) Comparison of body weight and blood glucose levels in male wild-type (WT) and Cre littermates. Mice were maintained on a normal chow diet (n = 7 per genotype). Body weight and fed blood glucose
SUPPLEMENTARY FIGURES AND TABLE
 SUPPLEMENTARY FIGURES AND TABLE Supplementary Figure S1: Characterization of IRE1α mutants. A. U87-LUC cells were transduced with the lentiviral vector containing the GFP sequence (U87-LUC Tet-ON GFP).
Supplementary Figure 1 Expression of Crb3 in mouse sciatic nerve: biochemical analysis (a) Schematic of Crb3 isoforms, ERLI and CLPI, indicating the
 Schematic of Crb3 isoforms, ERLI and CLPI, indicating the") Supplementary Figure 1 Expression of Crb3 in mouse sciatic nerve: biochemical analysis (a) Schematic of Crb3 isoforms, ERLI and CLPI, indicating the location of the transmembrane (TM), FRM binding (FB)
Supplementary Figure 1 Expression of Crb3 in mouse sciatic nerve: biochemical analysis (a) Schematic of Crb3 isoforms, ERLI and CLPI, indicating the location of the transmembrane (TM), FRM binding (FB)
CHAPTER 4 RESULTS. showed that all three replicates had similar growth trends (Figure 4.1) (p<0.05; p=0.0000)
 (p<0.05; p=0.0000)") CHAPTER 4 RESULTS 4.1 Growth Characterization of C. vulgaris 4.1.1 Optical Density Growth study of Chlorella vulgaris based on optical density at 620 nm (OD 620 ) showed that all three replicates had similar
CHAPTER 4 RESULTS 4.1 Growth Characterization of C. vulgaris 4.1.1 Optical Density Growth study of Chlorella vulgaris based on optical density at 620 nm (OD 620 ) showed that all three replicates had similar
SUPPLEMENTARY INFORMATION
 SUPPLEMENTARY INFORMATION doi:10.1038/nature11429 S1a 6 7 8 9 Nlrc4 allele S1b Nlrc4 +/+ Nlrc4 +/F Nlrc4 F/F 9 Targeting construct 422 bp 273 bp FRT-neo-gb-PGK-FRT 3x.STOP S1c Nlrc4 +/+ Nlrc4 F/F casp1
Supplementary Information
 Supplementary Information Supplementary Figure 1. CD4 + T cell activation and lack of apoptosis after crosslinking with anti-cd3 + anti-cd28 + anti-cd160. (a) Flow cytometry of anti-cd160 (5D.10A11) binding