Supplemental Information. A Regulatory Network. of Drosophila Germline. Stem Cell Self-Renewal
|
|
|
- Joseph Conley
- 6 years ago
- Views:
Transcription
1 Developmental Cell, Volume 28 Supplemental Information A Regulatory Network of Drosophila Germline Stem Cell Self-Renewal Dong Yan, Ralph A. Neumüller, Michael Buckner, Kathleen Ayers, Hua Li, Yanhui Hu, Donghui Yang-Zhou, Lei Pan, Xiaoxi Wang, Colleen Kelley, Arunachalam Vinayagam, Richard Binari, Sakara Randklev, Lizabeth A. Perkins, Ting Xie, Lynn Cooley, and Norbert Perrimon

2 Supplemental figures and table legends Figure S1 (related to Figure 1). The germline screen identified many known essential regulators of GSC self-renewal and oogenesis Ovaries expressing shrnas targeting otu, mei-p26, aret, twin, sxl, mael, dcr1 or egl by MTD-Gal4 or BicD dsrna by UAS-dcr2; nanos-gal4 stained for α-spectrin, Vasa and DAPI. While otu, mei-p26, aret, twin, sxl, mael shrnas block GSC differentiation, dcr1 shrna generates a stem-cell-loss phenotype (white arrow). In egl and BicD RNAi ovaries, oocytes do not form (yellow arrows) and there are 16 nurse cells instead. Sxl results are confirmed by two independent shrnas; MTD-Gal4/HMS00609 females are obtained by crossing MTD-Gal4 males with HMS00609 females. Scale bars: 20 µm.
 Ovaries expressing hts shrna by MTD-Gal4 or MAT-Gal4 were stained for Hts-1B1 or Hts-RC antibodies.")
3 Figure S2 (related to Figure 2). shrna validation experiments (A) Expression of Akt1 shrna by MAT-Gal4 strongly reduces Akt1 protein in the germline after stage 1. (B) Ovaries expressing hts shrna by MTD-Gal4 or MAT-Gal4 were stained for Hts-1B1 or Hts-RC antibodies. In MAT ovaries, both the Hts-1B1 and Hts-RC proteins were present on fusomes and ring canals, respectively, in the germarium, but absent from egg chambers outside the germarium resulting in defective ring canals. In MTD ovaries, both
4 Hts-1B1 and Hts-RC were absent, and egg chambers showed the typical hts phenotype of too few nurse cells and defective ring canals. (C) Knock down of Mcm5 and Mcm6 with two independent shrnas driven by MAT- Gal4 leads to ploidy defects in nurse cells of stage 7 and 10 egg chambers, as shown by DAPI staining. Scale bars: 20 µm.
5 Figure S3 (related to Figure 3). Representative protein complexes identified using COMPLEAT Red: differentiation defects; blue: GSC loss or agametic; white/grey: genes that were not screened or did not score. The full list of protein complexes are shown in Table S2.
 Ovaries expressing shrnas or dsrnas against")
6 Figure S4 (related to Figure 4). Regulators for GSC differentiation or maintenance identified from the screen (A-B) Ovaries expressing shrnas or dsrnas against indicated genes by MTD-Gal4 or UAS-dcr2; nanos-gal4 were stained for α-spectrin, Vasa and DAPI.
7 (A) PI4KIIIα, Gs1 and Hrb98DE shrnas generate an empty germarium and stem-cellloss phenotype. (B) Ndc80, SCAR, CG17259, bsf, Dhc64c, slmb, Keap1, CG10426, CoVa and Ccn RNAi block GSC differentiation. (C) bam epistasis analysis. shrnas against Prpk, zfrp8, TFIIfα or U2A expressed using nanos-gal4 with or without hs-bam expression. Ovaries are stained for α-spectrin, Vasa and DAPI and quantification results are shown in the Figure 4E. Scale bars: 20 µm.
 Ovaries expressing shrnas against indicated genes by MTD-Gal4 were stained for α-spectrin, Vasa and DAPI.")
8 Figure S5 (related to Figure 5). Transcription factors required for GSC differentiation or maintenance (A) Ovaries expressing shrnas against indicated genes by MTD-Gal4 were stained for α-spectrin, Vasa and DAPI. Su(var)2-10 and spt4 shrnas generate an empty germarium and stem-cell-loss phenotype. Su(Tpl), MED17 and Taf1 shrnas result in an agametic phenotype. Rtf1, Su(var)205 and Rga shrnas lead to differentiation defects. (B) Depletion of the Su(var)205 (HP1) protein in the germline upon MTD-Gal4 driven expression of a Su(var)205 targeting shrna. (C) Reduced levels of H3K9me3 in the germline upon depletion of Su(var)205 by shrna expression. Scale bars: 20 µm.
 or Brm/DAPI (B). Yellow arrows indicate Osa and Brm expression in GSCs.")
9 Figure S6 (related to Figure 6). Comparative analysis of self-renewal (A,B) Depletion of the brahma complex members osa or brm does not induce a detectable phenotype in the germline. shrnas are expressed by MTD-Gal4 and ovaries stained for Osa/DAPI (A) or Brm/DAPI (B). Yellow arrows indicate Osa and Brm expression in GSCs. (C) Expression of two independent shrnas targeting scny by MTDGal4 result in a depletion of germline cells. Ovaries are stained for α-spectrin, Vasa and DAPI. (D) Knockdown of barc in the germline by MTD-Gal4 results in an agametic phenotype. Scale bars: 20 µm.
10
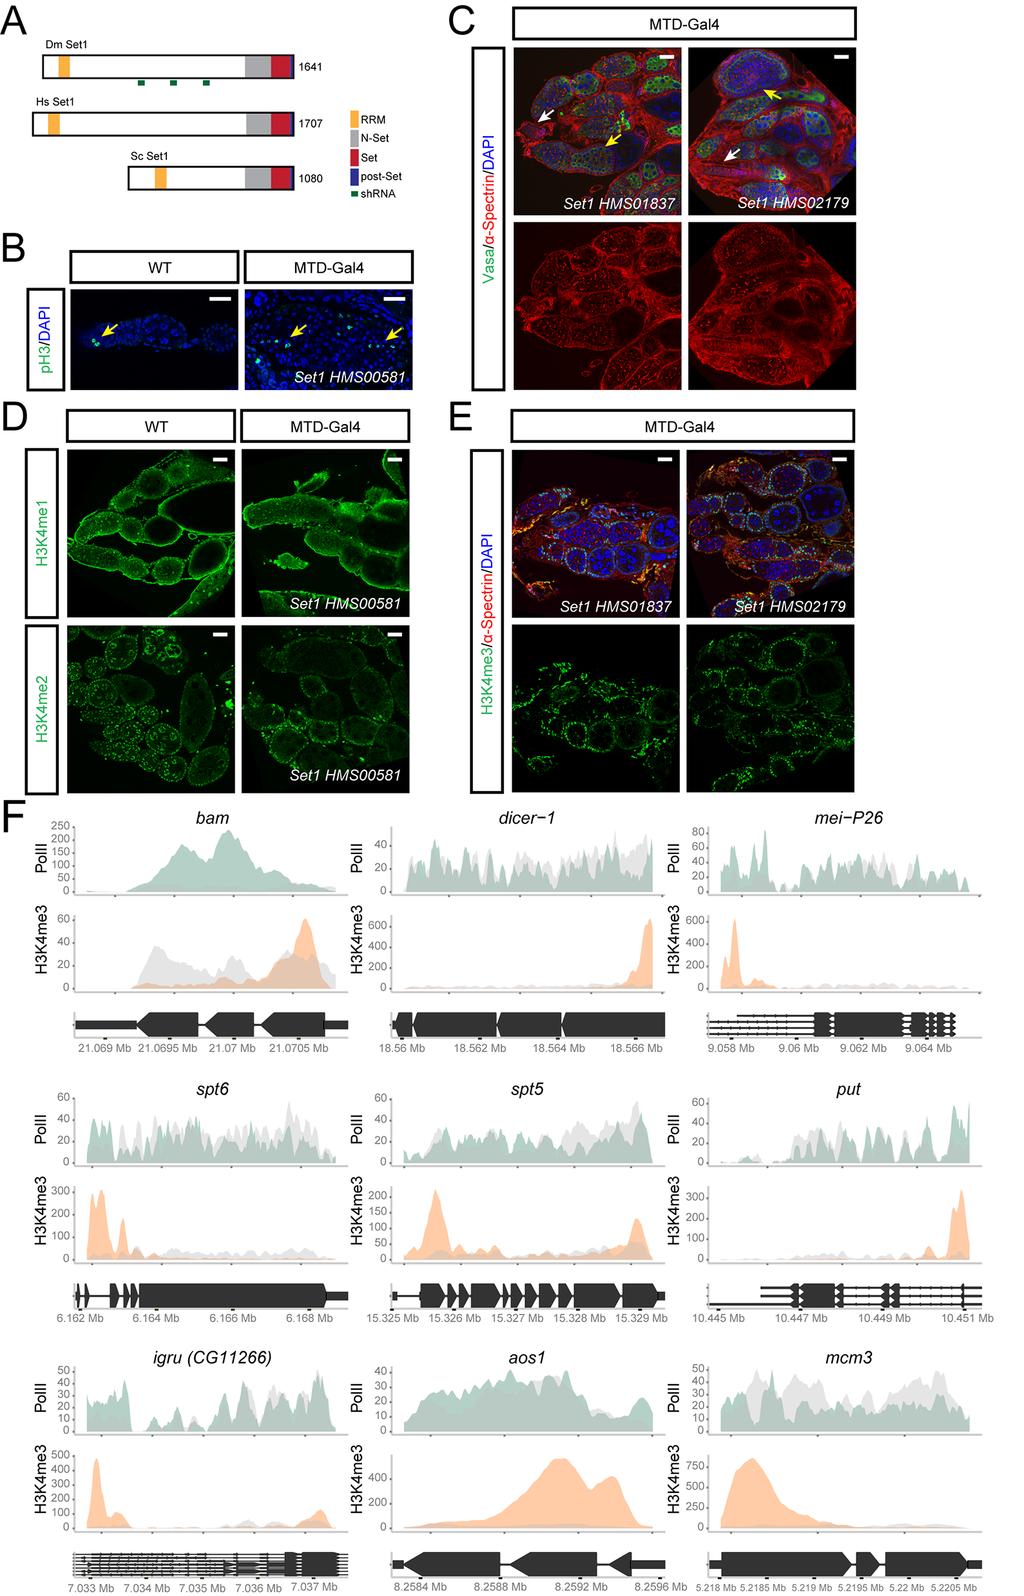
11 Figure S7 (related to Figure 7). Set1 is important for germline differentiation and GSC maintenence (A) Schematic diagram showing domain structure of Set1 protein. RRM: RNA recognition motif; Dm: Drosophila melanogaster; Hs: Homo sapiens; Sc: Saccharomyces cerevisiae. The positions of three shrnas are shown in the protein model. (B) ph3 positive mitotic cells (yellow arrows) are restricted to the tip of the ovarioles in WT ovaries, but are detected throughout ovarioles in MTD/Set1 shrna ovaries. (C) Ovaries expressing Set1 shrna (HMS01837 or HMS02179) by MTD-Gal4 are labeled by α-spectrin, Vasa and DAPI staining. White arrows: empty ovarioles, Yellow arrows: pseudo egg chambers filled with undifferentiated cells. (D) H3K4me1 and H3K4me2 staining in WT and Set1 shrna/mtd-gal4 ovaries. (E) H3K4me3 depletion with Set1 shrna/mtd-gal4 (HMS01837 and HMS02179). (F) H3K4me3 and Pol II ChIP-seq experiment: Green (Pol II) and red (H3K4me3) tracks show enrichment on a select set of genes: those already known to affect the GSC lineage (bam, dicer-1, mei-p26, spt6, put) and additional regulators identified in this screen (igru, spt5, aos1, mcm3). Gene models are shown in black and grey represents whole cell extract. Scale bars: 20 µm.
12 Table S1 (related to Figure 1). Germline screen results of 4608 TRiP transgenic lines and analysis of 366 genes that produce no/few eggs Sheet 1: screen results of 4608 lines. RNAi lines that produce no/few eggs are labeled with blue color. The lines for which confocal images were recorded are labeled with x. Each line is linked to the RSVP database, where the phenotypic data are stored. Sheet 2: screen results of 444 lines that produce no/few eggs. Among those lines, 174 agametic lines were re-screened with MAT-Gal4 and the phenotypes are shown in the table. Those lines for which confocal images exist are marked with x. According to the results of the two screens, all 444 lines were assigned to the respective phenotypic categories. dd: differentiation defects; sl: GSC loss; o: oogenesis defects; a: agametic; a, n: agametic (MAT normal); a, d: agametic (MAT defective). Sheet 3 contains the differentiation defective hits with additional phenotypic information. Sheet 4: analysis of 366 genes that produce no/few eggs. For each gene the number of RNAi lines screened is shown. Complex analysis indicates whether this protein forms complexes with other hits in the screen. Based on these two criteria, a confidence score (from high to low) was given to each gene. Genes that also scored in the neuroblast screen are indicated. Finally, the DIOPT tool was used to find human orthologs of those genes. Table S2 (related to Figure 3). Protein complexes containing genes identified from the GSC screen Using the hits from the GSC screen, the COMPLEAT database identified 116 protein complexes. P-value, complex members and gene scored are shown in the table.
13 Supplemental Experimental Procedures: RNAi screen and Drosophila strains An important conclusion from our screen is that shrna lines are more effective than dsrna lines in the germline, although some dsrna lines are also functional and generate expected phenotypes during early oogenesis. Only 4.6% of VALIUM1 and 5.0% of VALIUM10 lines resulted in detectable phenotypes, while 12.8% of VALIUM20 and 18.1% of VALIUM22 scored in our analysis (Figure 1C). VALIUM22 lines are slightly more effective than VALIUM20, consistent with its optimization for germline expression. A puasp-gfp transgenic fly strain was established by injecting the Drosophila gateway vector 1077 in white mutant embryos using standard techniques. hsbam experiment: larvae (48-72 hrs after egg laying) were incubated at 37 C for 1 hr for three consecutive days. Females of the genotype nanos-gal4/+; shrna/hs-bam were dissected three days after eclosion. Siblings of nanos-gal4/+; shrna/tm6b were used as controls. Bioinformatics analysis 1. Tissue expression heatmap (Figure 1F): The analysis was performed as described in Neumüller et al. (2011) with slight modifications: Microarray based expression data were retrieved from FlyAtlas ( Genes upregulated in each tissue/stage were analyzed for over- or under-representation with all germline hits and each phenotypic category respectively. The analysis result was visualized using a heatmap.
14 2. The GSC genetic network (Figure 2E): The network was built by assembling an interaction matrix consisting of protein-protein interactions (BioGrid, IntAct, MINT, DIP, DPiM and DroID (Sep 2012 version)), Genetic interactions (FlyBase, BioGrid and DroID (Sep 2012 version)) and Literature cocitation interactions: gene2pubmed association was retrieved from NCBI EntrezGene ftp site (ftp://ftp.ncbi.nlm.nih.gov/gene/data/) on Jan 8th Pairwise gene co-citation relationships were extracted from PubMed. Subsequently, an interaction matrix was established amongst all genes that scored in GSC screen and the resulting network was visualized using Cytoscape. As the network fulfills the purpose to graphically display the hits, we have predominantly focused on using different interaction data (not only PPI) to be able to display the vast majority of the identified factors. Distinct molecular complexes or groups of genes with the same molecular function are outlined in black. Note: Genes that are not part of the interaction matrices are not displayed in the respective figures. 3. Complex analysis: Complex analysis was done using COMPLEAT ( a tool that annotates protein complexes from both literature and predictions from protein-protein network, and does gene set enrichment analysis based on protein complexes. Using COMPLEAT, we identified 116 nonredundant protein complexes that are over-represented among the genes scored comparing to the experimental background with p value cut-off 0.05 (Table S2). 4. GSC and Nb comparison (Figure 6B) and GO enrichment heatmap (Figure 6A): To compare GSC and Nb self-renewal genes, Nb hits were downloaded from Neuroblasts
15 Screen online database ( and results were consolidated. Genes that scored with any measurement e.g. cell size change, cell number change or cell death, were compared to the genes scored in this germline screen. GO term enrichment was performed with DAVID ( for both, GSC and Nb screens. 5. Cell cycle and cell growth gene enrichment analysis (Figure 6C): Cell cycle genes were retrieved from studies using fission yeast (Hayles et al., 2013) and human cells (Kittler et al., 2007). A gene list associated with the regulation of nucleolar size was assembled from a comparative analysis in yeast and Drosophila (Neumuller et al., 2013) (all complex members that scored as hits were considered for this analysis). rrna processing factors were described by (Tafforeau et al., 2013). The genes were then mapped to corresponding fly genes using DIOPT (Hu et al., 2011) with the most stringent filter. The probability of the enrichment was calculated based on a hypergeometric distribution using the experimental set as a background. The enrichment result was visually displayed using a heatmap by calculating the negative log 10 value of the probability score. 6. Peak calling for H3K4me3 and PolII (7G): The SICER software was used to define genomic regions with significant enrichment ( peaks ) for Pol II binding or histone modifications. For H3K4me3 chip-seq data, we used G=0 (gap=0) because the initial analysis showed that K4 peaks are more likely to be sharp and contiguous. Peaks returned by SICER were further refined by taking the first positive score (IP minus WCE) and the
16 last positive score. Peaks were mapped to genes using the following procedures: First, all transcripts of a specific gene were taken, and the beginning of the gene is defined as the first base of all transcripts; while the end defined as the last base of all transcripts. Second, we use BED tools to pick out genes that have at least 1 bp overlap between the gene region and the peak region. Third, different filters were used to eliminate false positive genes. (1) For H3K4me3-associated genes, if the distance to peak start (defined as peak start minus gene start) < 0, the peak location is given as upstream ; if the distance to peak summit (defined as peak summit minus gene start) > 0 and the distance is shorter than the gene length, the peak location is defined as inside. Otherwise the peak location is given as NA. (2) RNA polymerase 2-associated genes were identified using the same strategy as H3K4me3. Supplemental References Hu, Y., Flockhart, I., Vinayagam, A., Bergwitz, C., Berger, B., Perrimon, N., and Mohr, S.E. (2011). An integrative approach to ortholog prediction for disease-focused and other functional studies. BMC Bioinformatics 12, 357.
SUPPLEMENTARY INFORMATION
 doi: 10.1038/nature07173 SUPPLEMENTARY INFORMATION Supplementary Figure Legends: Supplementary Figure 1: Model of SSC and CPC divisions a, Somatic stem cells (SSC) reside adjacent to the hub (red), self-renew
Development Supplementary information
 Supplemental Materials and Methods Mosaic clonal analysis GSC and SP clones were induced with the FLP/FRT-mediated mitotic recombination technique (Xu and Rubin, 1993) in files with following genotypes:
Supplementary Figure 1 Madm is not required in GSCs and hub cells. (a,b) Act-Gal4-UAS-GFP (a), Act-Gal4-UAS- GFP.nls (b,c) is ubiquitously expressed
 Act-Gal4-UAS-GFP (a), Act-Gal4-UAS- GFP.nls (b,c) is ubiquitously expressed") Supplementary Figure 1 Madm is not required in GSCs and hub cells. (a,b) Act-Gal4-UAS-GFP (a), Act-Gal4-UAS- GFP.nls (b,c) is ubiquitously expressed in the testes. The testes were immunostained with GFP
Supplementary Figure 1 Madm is not required in GSCs and hub cells. (a,b) Act-Gal4-UAS-GFP (a), Act-Gal4-UAS- GFP.nls (b,c) is ubiquitously expressed in the testes. The testes were immunostained with GFP
Computational Analysis of UHT Sequences Histone modifications, CAGE, RNA-Seq
 Computational Analysis of UHT Sequences Histone modifications, CAGE, RNA-Seq Philipp Bucher Wednesday January 21, 2009 SIB graduate school course EPFL, Lausanne ChIP-seq against histone variants: Biological
effects on organ development. a-f, Eye and wing discs with clones of ε j2b10 show no
 Supplementary Figure 1. Loss of function clones of 14-3-3 or 14-3-3 show no significant effects on organ development. a-f, Eye and wing discs with clones of 14-3-3ε j2b10 show no obvious defects in Elav
SUPPLEMENTARY FIGURES
 SUPPLEMENTARY FIGURES 1 Supplementary Figure 1, Adult hippocampal QNPs and TAPs uniformly express REST a-b) Confocal images of adult hippocampal mouse sections showing GFAP (green), Sox2 (red), and REST
klp-18 (RNAi) Control. supplementary information. starting strain: AV335 [emb-27(g48); GFP::histone; GFP::tubulin] bleach
![klp-18 (RNAi) Control. supplementary information. starting strain: AV335 [emb-27(g48); GFP::histone; GFP::tubulin] bleach](/thumbs/91/104639484.jpg "klp-18 (RNAi) Control. supplementary information. starting strain: AV335 [emb-27(g48); GFP::histone; GFP::tubulin] bleach") DOI: 10.1038/ncb1891 A. starting strain: AV335 [emb-27(g48); GFP::histone; GFP::tubulin] bleach embryos let hatch overnight transfer to RNAi plates; incubate 5 days at 15 C RNAi food L1 worms adult worms
DOI: 10.1038/ncb1891 A. starting strain: AV335 [emb-27(g48); GFP::histone; GFP::tubulin] bleach embryos let hatch overnight transfer to RNAi plates; incubate 5 days at 15 C RNAi food L1 worms adult worms
Supplementary Figure S1: TIPF reporter validation in the wing disc.
 Supplementary Figure S1: TIPF reporter validation in the wing disc. a,b, Test of put RNAi. a, In wildtype discs the Dpp target gene Sal (red) is expressed in a broad stripe in the centre of the ventral
fl/+ KRas;Atg5 fl/+ KRas;Atg5 fl/fl KRas;Atg5 fl/fl KRas;Atg5 Supplementary Figure 1. Gene set enrichment analyses. (a) (b)
 (b)") KRas;At KRas;At KRas;At KRas;At a b Supplementary Figure 1. Gene set enrichment analyses. (a) GO gene sets (MSigDB v3. c5) enriched in KRas;Atg5 fl/+ as compared to KRas;Atg5 fl/fl tumors using gene set
KRas;At KRas;At KRas;At KRas;At a b Supplementary Figure 1. Gene set enrichment analyses. (a) GO gene sets (MSigDB v3. c5) enriched in KRas;Atg5 fl/+ as compared to KRas;Atg5 fl/fl tumors using gene set
Effects of UBL5 knockdown on cell cycle distribution and sister chromatid cohesion
 Supplementary Figure S1. Effects of UBL5 knockdown on cell cycle distribution and sister chromatid cohesion A. Representative examples of flow cytometry profiles of HeLa cells transfected with indicated
Supplementary Materials for
 www.sciencesignaling.org/cgi/content/full/8/393/rs9/dc1 Supplementary Materials for Identification of potential drug targets for tuberous sclerosis complex by synthetic screens combining CRISPR-based knockouts
Supplementary Figures
 J. Cell Sci. 128: doi:10.1242/jcs.173807: Supplementary Material Supplementary Figures Fig. S1 Fig. S1. Description and/or validation of reagents used. All panels show Drosophila tissues oriented with
Table of content. -Supplementary methods. -Figure S1. -Figure S2. -Figure S3. -Table legend
 Table of content -Supplementary methods -Figure S1 -Figure S2 -Figure S3 -Table legend Supplementary methods Yeast two-hybrid bait basal transactivation test Because bait constructs sometimes self-transactivate
A genome-scale shrna resource for transgenic RNAi in Drosophila
 Nature Methods A genome-scale shrna resource for transgenic RNAi in Drosophila Jian-Quan Ni, Rui Zhou, Benjamin Czech, Lu-Ping Liu, Laura Holderbaum, Donghui Yang-Zhou, Hye- Seok Shim, Dominik Handler,
Title: Epigenetic mechanisms underlying maternal diabetes-associated risk of congenital heart disease
 1 Supplemental Materials 2 3 Title: Epigenetic mechanisms underlying maternal diabetes-associated risk of congenital heart disease 4 5 6 Authors: Madhumita Basu, 1 Jun-Yi Zhu, 2 Stephanie LaHaye 1,3, Uddalak
Nature Immunology: doi: /ni Supplementary Figure 1. Transcriptional program of the TE and MP CD8 + T cell subsets.
 Supplementary Figure 1 Transcriptional program of the TE and MP CD8 + T cell subsets. (a) Comparison of gene expression of TE and MP CD8 + T cell subsets by microarray. Genes that are 1.5-fold upregulated
Supplementary Fig. 1 V-ATPase depletion induces unique and robust phenotype in Drosophila fat body cells.
 Supplementary Fig. 1 V-ATPase depletion induces unique and robust phenotype in Drosophila fat body cells. a. Schematic of the V-ATPase proton pump macro-complex structure. The V1 complex is composed of
High Throughput Sequence (HTS) data analysis. Lei Zhou
 data analysis. Lei Zhou") High Throughput Sequence (HTS) data analysis Lei Zhou (leizhou@ufl.edu) High Throughput Sequence (HTS) data analysis 1. Representation of HTS data. 2. Visualization of HTS data. 3. Discovering genomic
High Throughput Sequence (HTS) data analysis Lei Zhou (leizhou@ufl.edu) High Throughput Sequence (HTS) data analysis 1. Representation of HTS data. 2. Visualization of HTS data. 3. Discovering genomic
7SK ChIRP-seq is specifically RNA dependent and conserved between mice and humans.
 Supplementary Figure 1 7SK ChIRP-seq is specifically RNA dependent and conserved between mice and humans. Regions targeted by the Even and Odd ChIRP probes mapped to a secondary structure model 56 of the
Supplementary Figure 1 (Related with Figure 4). Molecular consequences of Eed deletion. (a) ChIP analysis identifies 3925 genes that are associated
. Molecular consequences of Eed deletion. (a) ChIP analysis identifies 3925 genes that are associated") Supplementary Figure 1 (Related with Figure 4). Molecular consequences of Eed deletion. (a) ChIP analysis identifies 3925 genes that are associated with the H3K27me3 mark in chondrocytes (see Table S1,
Supplementary Figure 1 (Related with Figure 4). Molecular consequences of Eed deletion. (a) ChIP analysis identifies 3925 genes that are associated with the H3K27me3 mark in chondrocytes (see Table S1,
Comparison of open chromatin regions between dentate granule cells and other tissues and neural cell types.
 Supplementary Figure 1 Comparison of open chromatin regions between dentate granule cells and other tissues and neural cell types. (a) Pearson correlation heatmap among open chromatin profiles of different
Supplementary Figures
 Supplementary Figures Supplementary Figure 1. Confirmation of Dnmt1 conditional knockout out mice. a, Representative images of sorted stem (Lin - CD49f high CD24 + ), luminal (Lin - CD49f low CD24 + )
Supplementary Materials for
 www.sciencesignaling.org/cgi/content/full/8/375/ra41/dc1 Supplementary Materials for Actin cytoskeletal remodeling with protrusion formation is essential for heart regeneration in Hippo-deficient mice
EPIGENETIC RE-EXPRESSION OF HIF-2α SUPPRESSES SOFT TISSUE SARCOMA GROWTH
 EPIGENETIC RE-EXPRESSION OF HIF-2α SUPPRESSES SOFT TISSUE SARCOMA GROWTH Supplementary Figure 1. Supplementary Figure 1. Characterization of KP and KPH2 autochthonous UPS tumors. a) Genotyping of KPH2
Supplementary Figure S1. Gene expression analysis of epidermal marker genes and TP63.
 Supplementary Figure Legends Supplementary Figure S1. Gene expression analysis of epidermal marker genes and TP63. A. Screenshot of the UCSC genome browser from normalized RNAPII and RNA-seq ChIP-seq data
a) List of KMTs targeted in the shrna screen. The official symbol, KMT designation,
 List of KMTs targeted in the shrna screen. The official symbol, KMT designation,") Supplementary Information Supplementary Figures Supplementary Figure 1. a) List of KMTs targeted in the shrna screen. The official symbol, KMT designation, gene ID and specifities are provided. Those highlighted
Supplementary Information Supplementary Figures Supplementary Figure 1. a) List of KMTs targeted in the shrna screen. The official symbol, KMT designation, gene ID and specifities are provided. Those highlighted
SUPPLEMENTARY INFORMATION
 doi:10.1038/nature12652 Supplementary Figure 1. PRDM16 interacts with endogenous EHMT1 in brown adipocytes. Immunoprecipitation of PRDM16 complex by flag antibody (M2) followed by Western blot analysis
Discovery of Novel Human Gene Regulatory Modules from Gene Co-expression and
 Discovery of Novel Human Gene Regulatory Modules from Gene Co-expression and Promoter Motif Analysis Shisong Ma 1,2*, Michael Snyder 3, and Savithramma P Dinesh-Kumar 2* 1 School of Life Sciences, University
Figure S1, Beyer et al.
 Figure S1, eyer et al. Pax7 Myogenin si sitrl Hoechst T = 72h 14 1.8.6.4.2 12 1 8 6 4 2 24h 48h 96h diff. sitrl siset1 212 72h diff. b1 td r t Se km MyH Vinculin Myogenin β-ctin Vinculin MW b1 ka td r
Hands-On Ten The BRCA1 Gene and Protein
 Hands-On Ten The BRCA1 Gene and Protein Objective: To review transcription, translation, reading frames, mutations, and reading files from GenBank, and to review some of the bioinformatics tools, such
Nature Genetics: doi: /ng Supplementary Figure 1. Assessment of sample purity and quality.
 Supplementary Figure 1 Assessment of sample purity and quality. (a) Hematoxylin and eosin staining of formaldehyde-fixed, paraffin-embedded sections from a human testis biopsy collected concurrently with
Structure of Ovaries
 Structure of Ovaries What Are Oocyte Accessory Cells? Follicle cells somatic connected by desmosomes, gap junctions, interdigitating microvilli for anchorage and exchange function in yolk transport, egg
Capu and Spire Assemble a Cytoplasmic Actin Mesh
 Developmental Cell 13 Supplemental Data Capu and Spire Assemble a Cytoplasmic Actin Mesh that Maintains Microtubule Organization in the Drosophila Oocyte Katja Dahlgaard, Alexandre A.S.F. Raposo, Teresa
Analysis of Massively Parallel Sequencing Data Application of Illumina Sequencing to the Genetics of Human Cancers
 Analysis of Massively Parallel Sequencing Data Application of Illumina Sequencing to the Genetics of Human Cancers Gordon Blackshields Senior Bioinformatician Source BioScience 1 To Cancer Genetics Studies
Nature Neuroscience: doi: /nn Supplementary Figure 1
 Supplementary Figure 1 Expression of escargot (esg) and genetic approach for achieving IPC-specific knockdown. (a) esg MH766 -Gal4 UAS-cd8GFP (green) and esg-lacz B7-2-22 (red) show similar expression
The Nuclear Lamina Regulates Germline Stem Cell Niche Organization via Modulation of EGFR Signaling
 Article The Nuclear Lamina Regulates Germline Stem Cell Niche Organization via Modulation of EGFR Signaling Haiyang Chen, 1 Xin Chen, 2 and Yixian Zheng 1,2, * 1 Department of Embryology, Carnegie Institution
Accessing and Using ENCODE Data Dr. Peggy J. Farnham
 1 William M Keck Professor of Biochemistry Keck School of Medicine University of Southern California How many human genes are encoded in our 3x10 9 bp? C. elegans (worm) 959 cells and 1x10 8 bp 20,000
Gbb/Bmp signaling is essential for maintaining germline stem cells and for repressing bam transcription in the Drosophila testis
 Research article 1365 Gbb/Bmp signaling is essential for maintaining germline stem cells and for repressing bam transcription in the Drosophila testis Eihachiro Kawase 1, Marco D. Wong 1, Bee C. Ding 1
Head of College Scholars List Scheme. Summer Studentship Report Form
 Head of College Scholars List Scheme Summer Studentship 2019 Report Form This report should be completed by the student with his/her project supervisor. It should summarise the work undertaken during the
Supplementary Figure 1 hlrrk2 promotes CAP dependent protein translation.
 ` Supplementary Figure 1 hlrrk2 promotes CAP dependent protein translation. (a) Overexpression of hlrrk2 in HeLa cells enhances total protein synthesis in [35S] methionine/cysteine incorporation assays.
Supporting Information
 Supporting Information Fig. S1. Overexpression of Rpr causes progenitor cell death. (A) TUNEL assay of control intestines. No progenitor cell death could be observed, except that some ECs are undergoing
STAT1 regulates microrna transcription in interferon γ stimulated HeLa cells
 CAMDA 2009 October 5, 2009 STAT1 regulates microrna transcription in interferon γ stimulated HeLa cells Guohua Wang 1, Yadong Wang 1, Denan Zhang 1, Mingxiang Teng 1,2, Lang Li 2, and Yunlong Liu 2 Harbin
Inhibition of Cdk5 Promotes β-cell Differentiation from Ductal Progenitors
 Inhibition of Cdk5 Promotes β-cell Differentiation from Ductal Progenitors Ka-Cheuk Liu, Gunter Leuckx, Daisuke Sakano, Philip A. Seymour, Charlotte L. Mattsson, Linn Rautio, Willem Staels, Yannick Verdonck,
Allelic reprogramming of the histone modification H3K4me3 in early mammalian development
 Allelic reprogramming of the histone modification H3K4me3 in early mammalian development 张戈 Method and material STAR ChIP seq (small-scale TELP-assisted rapid ChIP seq) 200 mouse embryonic stem cells PWK/PhJ
SUPPLEMENTARY INFORMATION
 DOI: 10.1038/ncb2988 Supplementary Figure 1 Kif7 L130P encodes a stable protein that does not localize to cilia tips. (a) Immunoblot with KIF7 antibody in cell lysates of wild-type, Kif7 L130P and Kif7
Peak-calling for ChIP-seq and ATAC-seq
 Peak-calling for ChIP-seq and ATAC-seq Shamith Samarajiwa CRUK Autumn School in Bioinformatics 2017 University of Cambridge Overview Peak-calling: identify enriched (signal) regions in ChIP-seq or ATAC-seq
Nature Structural & Molecular Biology: doi: /nsmb Supplementary Figure 1
 Supplementary Figure 1 Effect of HSP90 inhibition on expression of endogenous retroviruses. (a) Inducible shrna-mediated Hsp90 silencing in mouse ESCs. Immunoblots of total cell extract expressing the
Computational aspects of ChIP-seq. John Marioni Research Group Leader European Bioinformatics Institute European Molecular Biology Laboratory
 Computational aspects of ChIP-seq John Marioni Research Group Leader European Bioinformatics Institute European Molecular Biology Laboratory ChIP-seq Using highthroughput sequencing to investigate DNA
Supplemental Figure S1. Expression of Cirbp mrna in mouse tissues and NIH3T3 cells.
 SUPPLEMENTAL FIGURE AND TABLE LEGENDS Supplemental Figure S1. Expression of Cirbp mrna in mouse tissues and NIH3T3 cells. A) Cirbp mrna expression levels in various mouse tissues collected around the clock
Functional annotation of farm animal genomes: ChIP-seq.
 Functional annotation of farm animal genomes: ChIP-seq Richard Crooijmans 2018, PAGXXVI Richard.Crooijmans@wur.nl Why FAANG is important Understanding the genotype to phenotype link This needs: - genomic
Nature Genetics: doi: /ng Supplementary Figure 1. Immunofluorescence (IF) confirms absence of H3K9me in met-2 set-25 worms.
 confirms absence of H3K9me in met-2 set-25 worms.") Supplementary Figure 1 Immunofluorescence (IF) confirms absence of H3K9me in met-2 set-25 worms. IF images of wild-type (wt) and met-2 set-25 worms showing the loss of H3K9me2/me3 at the indicated developmental
Supplementary Figure 1 Immunofluorescence (IF) confirms absence of H3K9me in met-2 set-25 worms. IF images of wild-type (wt) and met-2 set-25 worms showing the loss of H3K9me2/me3 at the indicated developmental
SUPPLEMENTARY INFORMATION
 Supplementary Figure 1. Ras V12 expression in the entire eye-antennal disc does not cause invasive tumours. a, Eye-antennal discs expressing Ras V12 in all cells (marked with GFP, green) overgrow moderately
Supplementary Materials and Methods
 Supplementary Materials and Methods Whole Mount X-Gal Staining Whole tissues were collected, rinsed with PBS and fixed with 4% PFA. Tissues were then rinsed in rinse buffer (100 mm Sodium Phosphate ph
Cesarini et al., http ://www.jcb.org /cgi /content /full /jcb /DC1
 Supplemental material JCB Cesarini et al., http ://www.jcb.org /cgi /content /full /jcb.201504035 /DC1 THE JOU RNAL OF CELL BIO LOGY Figure S1. Lamin A/C depletion generates two distinct phenotypes in
INVESTIGATING THE ROLE OF THE HISTONE DEMETHYLASE LID IN THE DROSOPHILA TESTIS NICHE
 INVESTIGATING THE ROLE OF THE HISTONE DEMETHYLASE LID IN THE DROSOPHILA TESTIS NICHE by Yuping Derek Li A thesis submitted to Johns Hopkins University in conformity with the requirements for the degree
OncoPPi Portal A Cancer Protein Interaction Network to Inform Therapeutic Strategies
 OncoPPi Portal A Cancer Protein Interaction Network to Inform Therapeutic Strategies 2017 Contents Datasets... 2 Protein-protein interaction dataset... 2 Set of known PPIs... 3 Domain-domain interactions...
Not IN Our Genes - A Different Kind of Inheritance.! Christopher Phiel, Ph.D. University of Colorado Denver Mini-STEM School February 4, 2014
 Not IN Our Genes - A Different Kind of Inheritance! Christopher Phiel, Ph.D. University of Colorado Denver Mini-STEM School February 4, 2014 Epigenetics in Mainstream Media Epigenetics *Current definition:
The genetics of heterochromatin. in metazoa. mutations by means of X-ray irradiation" "for the discovery of the production of
 The genetics of heterochromatin in metazoa 1 Hermann Joseph Muller 1946 Nobel Prize in Medicine: "for the discovery of the production of mutations by means of X-ray irradiation" 3 4 The true meaning of
SUPPLEMENTARY INFORMATION
 Supplementary text Collectively, we were able to detect ~14,000 expressed genes with RPKM (reads per kilobase per million) > 1 or ~16,000 with RPKM > 0.1 in at least one cell type from oocyte to the morula
Supplementary Materials for
 www.sciencesignaling.org/cgi/content/full/10/487/eaag2476/dc1 Supplementary Materials for Gene expression profiles of brain endothelial cells during embryonic development at bulk and single-cell levels
cis-regulatory enrichment analysis in human, mouse and fly
 cis-regulatory enrichment analysis in human, mouse and fly Zeynep Kalender Atak, PhD Laboratory of Computational Biology VIB-KU Leuven Center for Brain & Disease Research Laboratory of Computational Biology
The RNA binding protein Arrest (Bruno) regulates alternative splicing to enable myofibril maturation in Drosophila flight muscle
 regulates alternative splicing to enable myofibril maturation in Drosophila flight muscle") Manuscript EMBOR-2014-39791 The RNA binding protein Arrest (Bruno) regulates alternative splicing to enable myofibril maturation in Drosophila flight muscle Maria L. Spletter, Christiane Barz, Assa Yeroslaviz,
Manuscript EMBOR-2014-39791 The RNA binding protein Arrest (Bruno) regulates alternative splicing to enable myofibril maturation in Drosophila flight muscle Maria L. Spletter, Christiane Barz, Assa Yeroslaviz,
Supplemental Figure S1. Tertiles of FKBP5 promoter methylation and internal regulatory region
 Supplemental Figure S1. Tertiles of FKBP5 promoter methylation and internal regulatory region methylation in relation to PSS and fetal coupling. A, PSS values for participants whose placentas showed low,
MIR retrotransposon sequences provide insulators to the human genome
 Supplementary Information: MIR retrotransposon sequences provide insulators to the human genome Jianrong Wang, Cristina Vicente-García, Davide Seruggia, Eduardo Moltó, Ana Fernandez- Miñán, Ana Neto, Elbert
Supplementary Fig. S1. Schematic diagram of minigenome segments.
 open reading frame 1565 (segment 5) 47 (-) 3 5 (+) 76 101 125 149 173 197 221 246 287 open reading frame 890 (segment 8) 60 (-) 3 5 (+) 172 Supplementary Fig. S1. Schematic diagram of minigenome segments.
Nature Structural and Molecular Biology: doi: /nsmb Supplementary Figure 1
 Supplementary Figure 1 Mutational analysis of the SA2-Scc1 interaction in vitro and in human cells. (a) Autoradiograph (top) and Coomassie stained gel (bottom) of 35 S-labeled Myc-SA2 proteins (input)
A Role for Set1/MLL-Related Components in Epigenetic Regulation of the Caenorhabditis elegans Germ Line
 A Role for Set1/MLL-Related Components in Epigenetic Regulation of the Caenorhabditis elegans Germ Line Tengguo Li, Emory University William G Kelly, Emory University Journal Title: PLoS Genetics Volume:
SUPPLEMENTARY INFORMATION
 DOI: 10.1038/ncb2566 Figure S1 CDKL5 protein expression pattern and localization in mouse brain. (a) Multiple-tissue western blot from a postnatal day (P) 21 mouse probed with an antibody against CDKL5.
EXPression ANalyzer and DisplayER
 EXPression ANalyzer and DisplayER Tom Hait Aviv Steiner Igor Ulitsky Chaim Linhart Amos Tanay Seagull Shavit Rani Elkon Adi Maron-Katz Dorit Sagir Eyal David Roded Sharan Israel Steinfeld Yossi Shiloh
Gene expression regulation during cellular differentiation. Dom Helmlinger CRBM 24/10/2017
 Gene expression regulation during cellular differentiation Dom Helmlinger CRBM 24/10/2017 Outline 1. Gene expression regulation: why and how? 2. Yeast as model systems. 3. Control of sexual differentiation
Supplementary Figure 1
 Supplementary Figure 1 Kif1a RNAi effect on basal progenitor differentiation Related to Figure 2. Representative confocal images of the VZ and SVZ of rat cortices transfected at E16 with scrambled or Kif1a
Supplemental Information. Ciliary Beating Compartmentalizes. Cerebrospinal Fluid Flow in the Brain. and Regulates Ventricular Development
 Current Biology, Volume Supplemental Information Ciliary Beating Compartmentalizes Cerebrospinal Fluid Flow in the Brain and Regulates Ventricular Development Emilie W. Olstad, Christa Ringers, Jan N.
Supplemental Data. Wu et al. (2010). Plant Cell /tpc
. Plant Cell /tpc") Supplemental Figure 1. FIM5 is preferentially expressed in stamen and mature pollen. The expression data of FIM5 was extracted from Arabidopsis efp browser (http://www.bar.utoronto.ca/efp/development/),
Supplemental Figure 1. FIM5 is preferentially expressed in stamen and mature pollen. The expression data of FIM5 was extracted from Arabidopsis efp browser (http://www.bar.utoronto.ca/efp/development/),
Supplemental Figures Legends and Supplemental Figures. for. pirna-guided slicing of transposon transcripts enforces their transcriptional
 Supplemental Figures Legends and Supplemental Figures for pirn-guided slicing of transposon transcripts enforces their transcriptional silencing via specifying the nuclear pirn repertoire Kirsten-ndré
Inheritance of Aldehyde Oxidase in Drosophila melanogaster
 Inheritance of Aldehyde Oxidase in Drosophila melanogaster (adapted from Morgan, J. G. and V. Finnerty. 1991. Inheritance of aldehyde oxidase in Drosophilia melanogaster. Pages 33-47, in Tested studies
Broad H3K4me3 is associated with increased transcription elongation and enhancer activity at tumor suppressor genes
 Broad H3K4me3 is associated with increased transcription elongation and enhancer activity at tumor suppressor genes Kaifu Chen 1,2,3,4,5,10, Zhong Chen 6,10, Dayong Wu 6, Lili Zhang 7, Xueqiu Lin 1,2,8,
Inferring Biological Meaning from Cap Analysis Gene Expression Data
 Inferring Biological Meaning from Cap Analysis Gene Expression Data HRYSOULA PAPADAKIS 1. Introduction This project is inspired by the recent development of the Cap analysis gene expression (CAGE) method,
Supplementary Materials for
 advances.sciencemag.org/cgi/content/full/3/8/e1701143/dc1 Supplementary Materials for Impaired DNA replication derepresses chromatin and generates a transgenerationally inherited epigenetic memory Adam
Functional studies of Drosophila zinc transporters reveal the mechanism for dietary zinc absorption and regulation
 Qin et al. BMC Biology 2013, 11:101 RESEARCH ARTICLE Open Access Functional studies of Drosophila zinc transporters reveal the mechanism for dietary zinc absorption and regulation Qiuhong Qin, Xiaoxi Wang
SUPPLEMENTARY INFORMATION
 DOI: 10.1038/ncb3076 Supplementary Figure 1 btrcp targets Cep68 for degradation during mitosis. a) Cep68 immunofluorescence in interphase and metaphase. U-2OS cells were transfected with control sirna
Genome-Wide Localization of Protein-DNA Binding and Histone Modification by a Bayesian Change-Point Method with ChIP-seq Data
 Genome-Wide Localization of Protein-DNA Binding and Histone Modification by a Bayesian Change-Point Method with ChIP-seq Data Haipeng Xing, Yifan Mo, Will Liao, Michael Q. Zhang Clayton Davis and Geoffrey
Supplemental Information. Genomic Characterization of Murine. Monocytes Reveals C/EBPb Transcription. Factor Dependence of Ly6C Cells
 Immunity, Volume 46 Supplemental Information Genomic Characterization of Murine Monocytes Reveals C/EBPb Transcription Factor Dependence of Ly6C Cells Alexander Mildner, Jörg Schönheit, Amir Giladi, Eyal
Nature Immunology: doi: /ni Supplementary Figure 1. Characteristics of SEs in T reg and T conv cells.
 Supplementary Figure 1 Characteristics of SEs in T reg and T conv cells. (a) Patterns of indicated transcription factor-binding at SEs and surrounding regions in T reg and T conv cells. Average normalized
Supplementary Figure 1 Transcription assay of nine ABA-responsive PP2C. Transcription assay of nine ABA-responsive PP2C genes. Total RNA was isolated
 Supplementary Figure 1 Transcription assay of nine ABA-responsive PP2C genes. Transcription assay of nine ABA-responsive PP2C genes. Total RNA was isolated from 7 day-old seedlings treated with or without
MODULE 3: TRANSCRIPTION PART II
 MODULE 3: TRANSCRIPTION PART II Lesson Plan: Title S. CATHERINE SILVER KEY, CHIYEDZA SMALL Transcription Part II: What happens to the initial (premrna) transcript made by RNA pol II? Objectives Explain
The subcortical maternal complex controls symmetric division of mouse zygotes by
 The subcortical maternal complex controls symmetric division of mouse zygotes by regulating F-actin dynamics Xing-Jiang Yu 1,2, Zhaohong Yi 1, Zheng Gao 1,2, Dan-dan Qin 1,2, Yanhua Zhai 1, Xue Chen 1,
Supplementary Figure 1. IHC and proliferation analysis of pten-deficient mammary tumors
 Wang et al LEGENDS TO SUPPLEMENTARY INFORMATION Supplementary Figure 1. IHC and proliferation analysis of pten-deficient mammary tumors A. Induced expression of estrogen receptor α (ERα) in AME vs PDA
Processing, integrating and analysing chromatin immunoprecipitation followed by sequencing (ChIP-seq) data
 data") Processing, integrating and analysing chromatin immunoprecipitation followed by sequencing (ChIP-seq) data Bioinformatics methods, models and applications to disease Alex Essebier ChIP-seq experiment To
Processing, integrating and analysing chromatin immunoprecipitation followed by sequencing (ChIP-seq) data Bioinformatics methods, models and applications to disease Alex Essebier ChIP-seq experiment To
Supporting Online Material for
 www.sciencemag.org/cgi/content/full/1171320/dc1 Supporting Online Material for A Frazzled/DCC-Dependent Transcriptional Switch Regulates Midline Axon Guidance Long Yang, David S. Garbe, Greg J. Bashaw*
MODULE 4: SPLICING. Removal of introns from messenger RNA by splicing
 Last update: 05/10/2017 MODULE 4: SPLICING Lesson Plan: Title MEG LAAKSO Removal of introns from messenger RNA by splicing Objectives Identify splice donor and acceptor sites that are best supported by
Sudin Bhattacharya Institute for Integrative Toxicology
 Beyond the AHRE: the Role of Epigenomics in Gene Regulation by the AHR (or, Varied Applications of Computational Modeling in Toxicology and Ingredient Safety) Sudin Bhattacharya Institute for Integrative
VirusDetect pipeline - virus detection with small RNA sequencing
 VirusDetect pipeline - virus detection with small RNA sequencing CSC webinar 16.1.2018 Eija Korpelainen, Kimmo Mattila, Maria Lehtivaara Big thanks to Jan Kreuze and Jari Valkonen! Outline Small interfering
Supplementary Figure 1. Efficiency of Mll4 deletion and its effect on T cell populations in the periphery. Nature Immunology: doi: /ni.
 Supplementary Figure 1 Efficiency of Mll4 deletion and its effect on T cell populations in the periphery. Expression of Mll4 floxed alleles (16-19) in naive CD4 + T cells isolated from lymph nodes and
Yue Wei 1, Rui Chen 2, Carlos E. Bueso-Ramos 3, Hui Yang 1, and Guillermo Garcia-Manero 1
 Genome-wide CHIP-Seq Analysis of Histone Methylation Reveals Modulators of NF- B Signaling And the Histone Demethylase JMJD3 Implicated in Myelodysplastic Syndrome Yue Wei 1, Rui Chen 2, Carlos E. Bueso-Ramos
Data mining with Ensembl Biomart. Stéphanie Le Gras
 Data mining with Ensembl Biomart Stéphanie Le Gras (slegras@igbmc.fr) Guidelines Genome data Genome browsers Getting access to genomic data: Ensembl/BioMart 2 Genome Sequencing Example: Human genome 2000:
Supplementary Figure 1. EC-specific Deletion of Snail1 Does Not Affect EC Apoptosis. (a,b) Cryo-sections of WT (a) and Snail1 LOF (b) embryos at
 Cryo-sections of WT (a) and Snail1 LOF (b) embryos at") Supplementary Figure 1. EC-specific Deletion of Snail1 Does Not Affect EC Apoptosis. (a,b) Cryo-sections of WT (a) and Snail1 LOF (b) embryos at E10.5 were double-stained for TUNEL (red) and PECAM-1 (green).
Supplementary Figure 1. EC-specific Deletion of Snail1 Does Not Affect EC Apoptosis. (a,b) Cryo-sections of WT (a) and Snail1 LOF (b) embryos at E10.5 were double-stained for TUNEL (red) and PECAM-1 (green).
SSM signature genes are highly expressed in residual scar tissues after preoperative radiotherapy of rectal cancer.
 Supplementary Figure 1 SSM signature genes are highly expressed in residual scar tissues after preoperative radiotherapy of rectal cancer. Scatter plots comparing expression profiles of matched pretreatment
TSC1/2 tumour suppressor complex maintains Drosophila germline stem cells by preventing differentiation
 AND STEM CELLS Development epress online publication date 23 June 2010 RESEARCH ARTICLE 2461 Development 137, 2461-2469 (2010) doi:10.1242/dev.051466 2010. Published by The Company of Biologists Ltd TSC1/2
Table S1. Total and mapped reads produced for each ChIP-seq sample
 Tale S1. Total and mapped reads produced for each ChIP-seq sample Sample Total Reads Mapped Reads Col- H3K27me3 rep1 125662 1334323 (85.76%) Col- H3K27me3 rep2 9176437 7986731 (87.4%) atmi1a//c H3K27m3
m 6 A mrna methylation regulates AKT activity to promote the proliferation and tumorigenicity of endometrial cancer
 SUPPLEMENTARY INFORMATION Articles https://doi.org/10.1038/s41556-018-0174-4 In the format provided by the authors and unedited. m 6 A mrna methylation regulates AKT activity to promote the proliferation