Supplemental Information. The Hormone FGF21 Stimulates Water Drinking. in Response to Ketogenic Diet and Alcohol
|
|
|
- Milo Powell
- 5 years ago
- Views:
Transcription
1 ell Metabolism, Volume 7 Supplemental Information The Hormone Stimulates Water Drinking in Response to Ketogenic Diet and lcohol Parkyong Song, hristoph Zechner, Genaro Hernandez, José ánovas, Yang Xie, Varun Sondhi, Martin Wagner, Vanessa Stadlbauer, ngela Horvath, ettina Leber, Ming hang Hu, Orson W. Moe, David J. Mangelsdorf, and Steven. Kliewer
2 Energy expenditure (Kcal/h/kg-W) Vehicle Vehicle IP injection Dark Figure S, related to Figure. () Daily food intake in 57L/6J mice administered either vehicle or ( mg/kg/day) by osmotic minipump (n = 5/group). () Licking behavior as measured in six independent experiments using a gustometer. umulative licks were recorded every 5 min for h and then every h for h from 57L/6J mice after a single i.p. injection of ( mg/kg) or vehicle (n = /group). These data were used to generate the two-piece regression model in Figure I and J. () Energy expenditure in 57L/6J mice after a single i.p. injection of ( mg/kg) or vehicle (n = 6/group).
3 D WT/ND WT/KD KO//ND KO/KD Water intake (ml/g/day) ND Hepatic Fgf mrn (relative levels).5..5 ND Plasma (pg/ml) ND E F Hepatic Fgf mrn (relative levels) Plasma (pg/ml) on WD on WD Figure S, related to Figure, Figure. () Daily food intake in wild type (WT) and -knockout (KO) mice fed either a normal chow diet (ND) (n = 6/group) or ketogenic diet (KD) (n = /group). () Daily water intake (ml/g W) in 57L/6J mice fed either a normal chow diet (ND) or 8% high salt diet () (n = 6/group). Values are means ± SEM. p <. for ND vs. by Student s t-test. (, D) Hepatic Fgf mrn () and plasma concentrations (D) in 57L/6J mice fed a ND or for 7 days. In (), the Fgf QPR t value for the ND group is shown. (E, F) Hepatic Fgf mrn (E) and plasma concentrations (F) in ad libitum fed 57L/6J mice with either ad libitum access to water (ontrol) or hour water deprivation (WD) (n = 6/group). In (E), the Fgf QPR t value for the ND group is shown.


 D % ells with")


 and")

")


")

4 /F Klbamka/F /Veh Klbamka/Veh Veh 5 6 V ### fl/fl Klb Klbamka V V Klb m V 5 % ells with Klb V Klbamka MnPO 6 V OVLT c-fos signal intensity (a.u.) D % ells with Klb /F KlbPhoxb/F SFO p=. /Veh KlbPhoxb/Veh Klbamka V % ells with Klb. V 6 SFO Water intake (ml/g). 7 V V % ells with Klb.5 E Klbamka % ells with Klb MnPO Klbamka OVLT Klbamka KlbSim Figure S, related to Figure. () Daily food intake measured in control mice () and neuron-specific β-klotho-knockout Figure S mice (Klbamka) administered either vehicle (n = /group) or ( mg/kg/day; n = 5/group) by osmotic minipump. () Daily water intake (ml/g W) measured in and KlbPhoxb mice administered either vehicle or ( mg/kg/day) by osmotic minipump (n= 6/group). Values are means ± SEM. p <.5, p <., p <. for vehicle vs. groups.
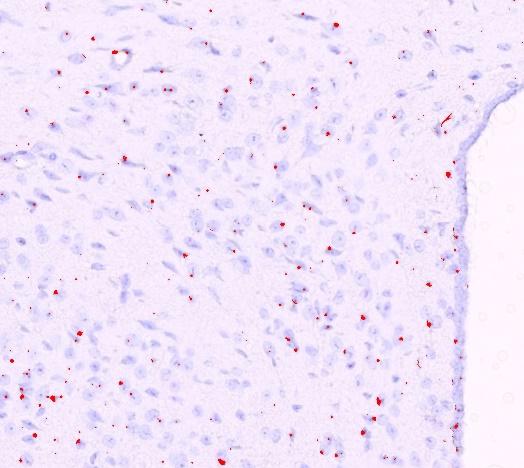
5 () Representative RNscope images from, SFO, OVLT, and MnPO of Klb fl/fl and Klb amka mice (n=/group). Klb was stained with a red probe and hematoxylin was used for counter staining. V, third ventricle. RN signals were highlighted using the color threshold function in ImageJ. Scale bar = 5 µm. Quantification, which was performed blinded using single sections from each mouse, is shown on the right. Values are means ± SEM. p <.5 by Student s t-test. (D) Quantification of c-fos levels in in Figure F. Two or more sections were used from each mouse (n= mice/group), with quantification done blinded. Values are means ± SEM. p <. for Klb fl/fl + vehicle vs. Klb fl/fl + groups; ### p <. for Klb fl/fl + vs. Klb amka + groups by two-way NOV with Tukey's post hoc test. (E) Klb staining in sections by RNscope in Klb fl/fl and Klb Sim cre mice (n=5/group). RN signals were highlighted using the color threshold function in ImageJ. Scale bar = 5 µm. Quantification, which was performed blinded using single sections from each mouse, is shown on the right. Values are means ± SEM. p <.5 by Student s t-test.
Supplemental Information. FGF19, FGF21, and an FGFR1/b-Klotho-Activating. Antibody Act on the Nervous System. to Regulate Body Weight and Glycemia
 Cell Metabolism, Volume 26 Supplemental Information FGF19, FGF21, and an FGFR1/b-Klotho-Activating Antibody Act on the Nervous System to Regulate Body Weight and Glycemia Tian Lan, Donald A. Morgan, Kamal
Supplementary Figure 1
 Supplementary Figure 1 how HFD how HFD Epi WT p p Hypothalamus p p Inguinal WT T Liver Lean mouse adipocytes p p p p p p Obese mouse adipocytes Kidney Muscle Spleen Heart p p p p p p p p Extracellular
Central injection of fibroblast growth factor 1 induces sustained remission of diabetic hyperglycemia in rodents
 Central injection of fibroblast growth factor 1 induces sustained remission of diabetic hyperglycemia in rodents Jarrad M Scarlett 1,,1, Jennifer M Rojas 1,1, Miles E Matsen 1, Karl J Kaiyala 3, Darko
Supplementary Figure S1. Effect of Glucose on Energy Balance in WT and KHK A/C KO
 Supplementary Figure S1. Effect of Glucose on Energy Balance in WT and KHK A/C KO Mice. WT mice and KHK-A/C KO mice were provided drinking water containing 10% glucose or tap water with normal chow ad
Supplementary Figure 1
 Supplementary Figure 1 Supplementary Figure 1 Schematic depiction of the tandem Fc GDF15. Supplementary Figure 2 Supplementary Figure 2 Gfral mrna levels in the brains of both wild-type and knockout Gfral
SUPPLEMENTARY INFORMATION
 Supplementary Figure 1. Behavioural effects of ketamine in non-stressed and stressed mice. Naive C57BL/6 adult male mice (n=10/group) were given a single dose of saline vehicle or ketamine (3.0 mg/kg,
GPR120 *** * * Liver BAT iwat ewat mwat Ileum Colon. UCP1 mrna ***
 a GPR120 GPR120 mrna/ppia mrna Arbitrary Units 150 100 50 Liver BAT iwat ewat mwat Ileum Colon b UCP1 mrna Fold induction 20 15 10 5 - camp camp SB202190 - - - H89 - - - - - GW7647 Supplementary Figure
Supplementary Figure 1.
 Supplementary Figure 1. FGF21 does not exert direct effects on hepatic glucose production. The liver explants from C57BL/6J mice (A, B) or primary rat hepatocytes (C, D) were incubated with rmfgf21 (2
Hypothalamic TLR2 triggers sickness behavior via a microglia-neuronal axis
 Hypothalamic TLR triggers sickness behavior via a microglia-neuronal axis Sungho Jin, *, Jae Geun Kim,, *, Jeong Woo Park, Marco Koch,, Tamas L. Horvath and Byung Ju Lee Department of Biological Sciences,
Supplementary Figure 1
 Combination index (CI) Supplementary Figure 1 2. 1.5 1. Ishikawa AN3CA Nou-1 Hec-18.5...2.4.6.8 1. Fraction affected (Fa) Supplementary Figure 1. The synergistic effect of PARP inhibitor and PI3K inhibitor
Nature Neuroscience: doi: /nn Supplementary Figure 1. Diverse anorexigenic signals induce c-fos expression in CEl PKC-δ + neurons
 Supplementary Figure 1 Diverse anorexigenic signals induce c-fos expression in CEl PKC-δ + neurons a-c. Quantification of CEl c-fos expression in mice intraperitoneal injected with anorexigenic drugs (a),
glucagon receptor AgRP merged color map I corr = 0.76±0.024 glucagon receptor DAPI merged
 Hypothalamic glucagon signaling inhibits glucose production Patricia I. Mighiu*, Jessica T.Y. Yue*, Beatrice M. Filippi, Mona A. Abraham, Madhu Chari, Carol K.L. Lam, Clair S. Yang, Nikita R. Christian,
Supplemental Figure 1. Western blot analysis indicated that MIF was detected in the fractions of
 Supplemental Figure Legends Supplemental Figure 1. Western blot analysis indicated that was detected in the fractions of plasma membrane and cytosol but not in nuclear fraction isolated from Pkd1 null
Postn MCM Smad2 fl/fl Postn MCM Smad3 fl/fl Postn MCM Smad2/3 fl/fl. Postn MCM. Tgfbr1/2 fl/fl TAC
 A Smad2 fl/fl Smad3 fl/fl Smad2/3 fl/fl Tgfbr1/2 fl/fl 1. mm B Tcf21 MCM Tcf21 MCM Smad3 fl/fl Tcf21 MCM Smad2/3 fl/fl Tcf21 MCM Tgfbr1/2 fl/fl αmhc MCM C 1. mm 1. mm D Smad2 fl/fl Smad3 fl/fl Smad2/3
Supplementary Table 2. Plasma lipid profiles in wild type and mutant female mice submitted to a HFD for 12 weeks wt ERα -/- AF-1 0 AF-2 0
 Supplementary Table 1. List of specific primers used for gene expression analysis. Genes Primer forward Primer reverse Hprt GCAGTACAGCCCCAAAATGG AACAAAGTCTGGCCTGTATCCA Srebp-1c GGAAGCTGTCGGGGTAGCGTC CATGTCTTCAAATGTGCAATCCAT
Supplementary Figure 1. Western blot of hippocampal lysates from WT and Adcy1 KO mice demonstrates the specificity of the ADCY1 antibody.
 ADCY1 13 kda β-actin 45 kda Supplementary Figure 1. Western blot of hippocampal lysates from and mice demonstrates the specificity of the ADCY1 antibody. a DHPG perk1/2 ERK1/2 Relative level min 1.6 *
a Supplementary Figure 1 Celastrol Withaferin A Individual drugs
 Supplementary Figure 1 a 17 27 HSPA1A SLC7A11 HMOX1 GSTA1 DUSP4 GML CHAC1 CDKN1A GSTA4 CA6 BHLHE41 NR1D1 HSPB1 PTX3 HP NFKBIA VDR MVD HAS2 ANGPT1 WDR6 TGFB3 IDI1 VCAM1 H1F HMGCS1 CXCL5 STEAP4 NOS2 b Enrichment
Supplementary Figure 1: Steviol and stevioside potentiate TRPM5 in a cell-free environment. (a) TRPM5 currents are activated in inside-out patches
 TRPM5 currents are activated in inside-out patches") Supplementary Figure 1: Steviol and stevioside potentiate TRPM5 in a cell-free environment. (a) TRPM5 currents are activated in inside-out patches during application of 500 µm Ca 2+ at the intracellular
Supplementary Figure 1: Steviol and stevioside potentiate TRPM5 in a cell-free environment. (a) TRPM5 currents are activated in inside-out patches during application of 500 µm Ca 2+ at the intracellular
Supplementary Materials for
 www.sciencesignaling.org/cgi/content/full/8/407/ra127/dc1 Supplementary Materials for Loss of FTO in adipose tissue decreases Angptl4 translation and alters triglyceride metabolism Chao-Yung Wang,* Shian-Sen
Nature Immunology: doi: /ni Supplementary Figure 1
 Supplementary Figure 1 NLRP12 is downregulated in biopsy samples from patients with active ulcerative colitis (UC). (a-g) NLRP12 expression in 7 UC mrna profiling studies deposited in NCBI GEO database.
SUPPLEMENTARY DATA. Nature Medicine: doi: /nm.4171
 SUPPLEMENTARY DATA Supplementary Figure 1 a b c PF %Change - -4-6 Body weight Lean mass Body fat Tissue weight (g).4.3.2.1. PF GC iwat awat BAT PF d e f g week 2 week 3 NEFA (mmol/l) 1..5. PF phsl (Ser565)
Supplementary Figure 1. Characterization of human carotid plaques. (a) Flash-frozen human plaques were separated into vulnerable (V) and stable (S),
 Flash-frozen human plaques were separated into vulnerable (V) and stable (S),") Supplementary Figure 1. Characterization of human carotid plaques. (a) Flash-frozen human plaques were separated into vulnerable (V) and stable (S), regions which were then quantified for mean fluorescence
Supplementary Figure 1. Characterization of human carotid plaques. (a) Flash-frozen human plaques were separated into vulnerable (V) and stable (S), regions which were then quantified for mean fluorescence
Schwarz et al. Activity-Dependent Ubiquitination of GluA1 Mediates a Distinct AMPAR Endocytosis
 Schwarz et al Activity-Dependent Ubiquitination of GluA1 Mediates a Distinct AMPAR Endocytosis and Sorting Pathway Supplemental Data Supplemental Fie 1: AMPARs undergo activity-mediated ubiquitination
Disrupting GluA2-GAPDH Interaction Affects Axon and Dendrite Development
 Disrupting GluA2-GAPDH Interaction Affects Axon and Dendrite Development 1 Frankie Hang Fung Lee, 1 Ping Su, 1 Yu Feng Xie, 1 Kyle Ethan Wang, 2 Qi Wan and 1,3 Fang Liu 1 Campbell Research Institute, Centre
SUPPLEMENTARY INFORMATION
 DOI: 10.1038/ncb2211 a! mir-143! b! mir-103/107! let-7a! mir-144! mir-122a! mir-126-3p! mir-194! mir-27a! mir-30c! Figure S1 Northern blot analysis of mir-143 expression dependent on feeding conditions.
Supplementary Figure 1. Confocal immunofluorescence showing mitochondrial translocation of Drp1. Cardiomyocytes treated with H 2 O 2 were prestained
 Supplementary Figure 1. Confocal immunofluorescence showing mitochondrial translocation of Drp1. Cardiomyocytes treated with H 2 O 2 were prestained with MitoTracker (red), then were immunostained with
Supplementary Figure 1
 Supplementary Figure 1 AAV-GFP injection in the MEC of the mouse brain C57Bl/6 mice at 4 months of age were injected with AAV-GFP into the MEC and sacrificed at 7 days post injection (dpi). (a) Brains
Nature Neuroscience: doi: /nn Supplementary Figure 1. Visualization of AT1a-positive cells using AT1a lacz/+ mouse.
 Supplementary Figure 1 Visualization of AT1a-positive cells using AT1a lacz/+ mouse. (a f) Immunohistochemical detection of β-gal in the mouse brain. Coronal sections at the respective anteroposterior
Supplementary fig. 1. Crystals induce necroptosis does not involve caspases, TNF receptor or NLRP3. A. Mouse tubular epithelial cells were pretreated
 Supplementary fig. 1. Crystals induce necroptosis does not involve caspases, TNF receptor or NLRP3. A. Mouse tubular epithelial cells were pretreated with zvad-fmk (10µM) and exposed to calcium oxalate
TGF-β Signaling Regulates Neuronal C1q Expression and Developmental Synaptic Refinement
 Supplementary Information Title: TGF-β Signaling Regulates Neuronal C1q Expression and Developmental Synaptic Refinement Authors: Allison R. Bialas and Beth Stevens Supplemental Figure 1. In vitro characterization
Supplementary Table 1. List of primers used in this study
 Supplementary Table 1. List of primers used in this study Gene Forward primer Reverse primer Rat Met 5 -aggtcgcttcatgcaggt-3 5 -tccggagacacaggatgg-3 Rat Runx1 5 -cctccttgaaccactccact-3 5 -ctggatctgcctggcatc-3
Supplemental Information. Intermittent Fasting Promotes. White Adipose Browning and Decreases Obesity. by Shaping the Gut Microbiota
 Cell Metabolism, Volume 26 Supplemental Information Intermittent Fasting Promotes White Adipose Browning and Decreases Obesity by Shaping the Gut Microbiota Guolin Li, Cen Xie, Siyu Lu, Robert G. Nichols,
SUPPLEMENTARY INFORMATION
 doi: 10.1038/nature06994 A phosphatase cascade by which rewarding stimuli control nucleosomal response A. Stipanovich*, E. Valjent*, M. Matamales*, A. Nishi, J.H. Ahn, M. Maroteaux, J. Bertran-Gonzalez,
Two distinct mechanisms for experiencedependent
 SUPPLEMENTARY INFORMATION Articles https://doi.org/10.1038/s41593-018-0150-0 In the format provided by the authors and unedited. Two distinct mechanisms for experiencedependent homeostasis Michelle C.
Nature Neuroscience: doi: /nn Supplementary Figure 1
 Supplementary Figure 1 Relative expression of K IR2.1 transcript to enos was reduced 29-fold in capillaries from knockout animals. Relative expression of K IR2.1 transcript to enos was reduced 29-fold
Targeting of the circadian clock via CK1δ/ε to improve glucose homeostasis in obesity
 Targeting of the circadian clock via CK1δ/ε to improve glucose homeostasis in obesity Peter S. Cunningham, Siobhán A. Ahern, Laura C. Smith, Carla S. da Silva Santos, Travis T. Wager and David A. Bechtold
Rescue of mutant rhodopsin traffic by metformin-induced AMPK activation accelerates photoreceptor degeneration Athanasiou et al
 Supplementary Material Rescue of mutant rhodopsin traffic by metformin-induced AMPK activation accelerates photoreceptor degeneration Athanasiou et al Supplementary Figure 1. AICAR improves P23H rod opsin
Endocannabinoid-activated Nlrp3 inflammasome in infiltrating macrophages mediates β- cell loss in type 2 diabetes
 Endocannabinoid-activated Nlrp3 inflammasome in infiltrating macrophages mediates β- cell loss in type 2 diabetes T Jourdan, G Godlewski, R Cinar, A Bertola, G Szanda, J Liu, J Tam, T Han, B Mukhopadhyay,
Supplemental data Supplemental Figure Legends Supplemental Figure 1. Supplemental Figure 2.
 Supplemental data Supplemental Figure Legends Supplemental Figure 1. Analysis of deletion of AMPK!2 in POMC and AgRP neurons in control and POMC!2KO and AgRP!2KO mice. (A) mmunofluorescence analysis for
Supplementary Figure 1. DJ-1 modulates ROS concentration in mouse skeletal muscle.
 Supplementary Figure 1. DJ-1 modulates ROS concentration in mouse skeletal muscle. (a) mrna levels of Dj1 measured by quantitative RT-PCR in soleus, gastrocnemius (Gastroc.) and extensor digitorum longus
SUPPLEMENTARY INFORMATION
 DOI: 10.1038/ncb3461 In the format provided by the authors and unedited. Supplementary Figure 1 (associated to Figure 1). Cpeb4 gene-targeted mice develop liver steatosis. a, Immunoblot displaying CPEB4
Monday, 17 April 2017 BODY FLUID HOMEOSTASIS
 Monday, 17 April 2017 BODY FLUID HOMEOSTASIS Phenomenon: shipwrecked sailor on raft in ocean ("water, water everywhere but not a drop to drink") Why are the sailors thirsty? (What stimulated thirst?) Why
18s AAACGGCTACCACATCCAAG CCTCCAATGGATCCTCGTTA. 36b4 GTTCTTGCCCATCAGCACC AGATGCAGCAGATCCGCAT. Acc1 AGCAGATCCGCAGCTTG ACCTCTGCTCGCTGAGTGC
 Supplementary Table 1. Quantitative PCR primer sequences Gene symbol Sequences (5 to 3 ) Forward Reverse 18s AAACGGCTACCACATCCAAG CCTCCAATGGATCCTCGTTA 36b4 GTTCTTGCCCATCAGCACC AGATGCAGCAGATCCGCAT Acc1
Supplementary Figure 1. Microglia do not show signs of classical immune activation following MD a-b. Images showing immunoreactivity for MHCII (a)
") 1 Supplementary Figure 1. Microglia do not show signs of classical immune activation following MD a-b. Images showing immunoreactivity for MHCII (a) and CD45 (b) in fixed sections of binocular visual cortex
1 Supplementary Figure 1. Microglia do not show signs of classical immune activation following MD a-b. Images showing immunoreactivity for MHCII (a) and CD45 (b) in fixed sections of binocular visual cortex
Supplementary Figure 1. Deletion of Smad3 prevents B16F10 melanoma invasion and metastasis in a mouse s.c. tumor model.
 A B16F1 s.c. Lung LN Distant lymph nodes Colon B B16F1 s.c. Supplementary Figure 1. Deletion of Smad3 prevents B16F1 melanoma invasion and metastasis in a mouse s.c. tumor model. Highly invasive growth
GFP/Iba1/GFAP. Brain. Liver. Kidney. Lung. Hoechst/Iba1/TLR9!
 Supplementary information a +KA Relative expression d! Tlr9 5!! 5! NSC Neuron Astrocyte Microglia! 5! Tlr7!!!! NSC Neuron Astrocyte! GFP/Sβ/! Iba/Hoechst Microglia e Hoechst/Iba/TLR9! GFP/Iba/GFAP f Brain
E10.5 E18.5 P2 10w 83w NF1 HF1. Sham ISO. Bmi1. H3K9me3. Lung weight (g)
") Myociyte cross-sectional Relative mrna levels Relative levels Relative mrna levels Supplementary Figures and Legends a 8 6 4 2 Ezh2 E1.5 E18.5 P2 1w 83w b Ezh2 p16 amhc b-actin P2 43w kd 37 86 16 wt mouse
Myociyte cross-sectional Relative mrna levels Relative levels Relative mrna levels Supplementary Figures and Legends a 8 6 4 2 Ezh2 E1.5 E18.5 P2 1w 83w b Ezh2 p16 amhc b-actin P2 43w kd 37 86 16 wt mouse
Supplementary figure 1 (related to fig 1)
") Histological score linical Score Weight loss (%) olon length (cm) Supplementary figure (related to fig ) N ### ## ays on % E ### - - - - N ays on % $$ $$ # ## N. N N Supplementary figure : Lack of fibre
Histological score linical Score Weight loss (%) olon length (cm) Supplementary figure (related to fig ) N ### ## ays on % E ### - - - - N ays on % $$ $$ # ## N. N N Supplementary figure : Lack of fibre
Supplemental Fig. 1. Changes in fat and lean mass determined by DEXA. Fat mass in high fat-fed
 Supplemental Fig. 1. hanges in fat and lean mass determined by EXA. Fat mass in high fat-fed mice (A) and chow-fed controls (). Lean mass in high fat-fed mice () and chow-fed controls (). ata represent
HSP72 HSP90. Quadriceps Muscle. MEF2c MyoD1 MyoG Myf5 Hsf1 Hsp GLUT4/GAPDH (AU)
") Supplementary Figure 1. Impaired insulin action in HSP72 deficient muscle and myotubes in culture cannot be explained by altered myogenesis or reduced total GLUT4 expression. Genes associated with myogenesis
Supplementary Figure 1. Impaired insulin action in HSP72 deficient muscle and myotubes in culture cannot be explained by altered myogenesis or reduced total GLUT4 expression. Genes associated with myogenesis
Nature Neuroscience: doi: /nn Supplementary Figure 1. Splenic atrophy and leucopenia caused by T3 SCI.
 Supplementary Figure 1 Splenic atrophy and leucopenia caused by T3 SCI. (a) Gross anatomy of representative spleens from control and T3 SCI mice at 28 days post-injury. (b and c) Hematoxylin and eosin
Supplemental Information. Differential Effects of EGFL6 on Tumor. versus Wound Angiogenesis
 Cell Reports, Volume 21 Supplemental Information Differential Effects of EGFL6 on Tumor versus Wound Angiogenesis Kyunghee Noh, Lingegowda S. Mangala, Hee-Dong Han, Ningyan Zhang, Sunila Pradeep, Sherry
Pathophysiology: Regulation of Water Intake and Excretion, Ghent 03/2013. Outline: Regulation of water intake and excretion
 Pathophysiology: Regulation of Water Intake and Excretion, Ghent 03/2013 Daniel G. Bichet, M.D. Université de Montréal Groupe des Protéines Membranaires; Service de néphrologie, Hôpital du Sacré- Cœur
Nature Neuroscience: doi: /nn Supplementary Figure 1
 Supplementary Figure 1 Drd1a-Cre driven ChR2 expression in the SCN. (a) Low-magnification image of a representative Drd1a-ChR2 coronal brain section (n = 2) showing endogenous tdtomato fluorescence (magenta).
BMI risk SNPs associate with increased CADM1 and CADM2 expression in the cerebellum of human subjects.
 Supplementary Figure 1 BMI risk SNPs associate with increased CADM1 and CADM2 expression in the cerebellum of human subjects. Boxplots show the 25% and 75% quantiles of normalized mrna expression levels
Supplemental Information. Menin Deficiency Leads to Depressive-like. Behaviors in Mice by Modulating. Astrocyte-Mediated Neuroinflammation
 Neuron, Volume 100 Supplemental Information Menin Deficiency Leads to Depressive-like Behaviors in Mice by Modulating Astrocyte-Mediated Neuroinflammation Lige Leng, Kai Zhuang, Zeyue Liu, Changquan Huang,
a! b! c! Supplementary Fig. 1! Diameter (μm) S1P (LogM) U (LogM) enos! β-actin! Nogo-B! MLEC! nnos! β-actin!
 S1P (LogM) U (LogM) enos! β-actin! Nogo-B! MLEC! nnos! β-actin!") a! b! c! Diamet (μm) 2 2 1 WT Nogo-A/B-deficient -9-8 -7 - -5-4 PE (LogM) Diamet (μm) 2 2 1-12-11-1 -9-8 -7 - -5 U-419 (LogM) Diamet (μm) 2 2 1-8 -7 - -5 S1P (LogM) d! WT! Nogo-A/B-deficient! MLE! enos!
a! b! c! Diamet (μm) 2 2 1 WT Nogo-A/B-deficient -9-8 -7 - -5-4 PE (LogM) Diamet (μm) 2 2 1-12-11-1 -9-8 -7 - -5 U-419 (LogM) Diamet (μm) 2 2 1-8 -7 - -5 S1P (LogM) d! WT! Nogo-A/B-deficient! MLE! enos!
Supplemental Information. Increased 4E-BP1 Expression Protects. against Diet-Induced Obesity and Insulin. Resistance in Male Mice
 Cell Reports, Volume 16 Supplemental Information Increased 4E-BP1 Expression Protects against Diet-Induced Obesity and Insulin Resistance in Male Mice Shih-Yin Tsai, Ariana A. Rodriguez, Somasish G. Dastidar,
ALT (U/L) (Relative expression) HDL (mm) (Relative expression) ALT (U/L) (Relative expression)
 (Relative expression) HDL (mm) (Relative expression) ALT (U/L) (Relative expression)") a DMT mrna () 8 6 r =.96 P =. DMT mrna () 8 6 r =. P =.6 DMT mrna () 8 6 r =.99 P =.6 DMT mrna () 8 6 r =. P =.9 DMT mrna () BMI (kg/m ) 8 6 r =.7 P =.966 DMT mrna () 8 ALT (U/L) 8 6 r = -.66 P =.76 DMT
a DMT mrna () 8 6 r =.96 P =. DMT mrna () 8 6 r =. P =.6 DMT mrna () 8 6 r =.99 P =.6 DMT mrna () 8 6 r =. P =.9 DMT mrna () BMI (kg/m ) 8 6 r =.7 P =.966 DMT mrna () 8 ALT (U/L) 8 6 r = -.66 P =.76 DMT
Supplemental Fig. 1. Relative mrna Expression. Relative mrna Expression WT KO WT KO RT 4 0 C
 Supplemental Fig. 1 A 1.5 1..5 Hdac11 (ibat) n=4 n=4 n=4 n=4 n=4 n=4 n=4 n=4 WT KO WT KO WT KO WT KO RT 4 C RT 4 C Supplemental Figure 1. Hdac11 mrna is undetectable in KO adipose tissue. Quantitative
Supplementary Figure 1. DNA methylation of the adiponectin promoter R1, Pparg2, and Tnfa promoter in adipocytes is not affected by obesity.
 Supplementary Figure 1. DNA methylation of the adiponectin promoter R1, Pparg2, and Tnfa promoter in adipocytes is not affected by obesity. (a) Relative amounts of adiponectin, Ppar 2, C/ebp, and Tnf mrna
Nature Medicine doi: /nm.3150
 Nature Medicine doi:10.1038/nm.3150 Supplementary Table 1 Primer sequences used for q-pcr analysis Gene Forward primer Reverse primer Abca1 CAGCTTCCATCCTCCTTGTC CCACATCCACAACTGTCTGG Abcg1 GTACCATGACATCGCTGGTG
Supplementary Table 1. The primers used for quantitative RT-PCR. Gene name Forward (5 > 3 ) Reverse (5 > 3 )
 Reverse (5 > 3 )") 770 771 Supplementary Table 1. The primers used for quantitative RT-PCR. Gene name Forward (5 > 3 ) Reverse (5 > 3 ) Human CXCL1 GCGCCCAAACCGAAGTCATA ATGGGGGATGCAGGATTGAG PF4 CCCCACTGCCCAACTGATAG TTCTTGTACAGCGGGGCTTG
770 771 Supplementary Table 1. The primers used for quantitative RT-PCR. Gene name Forward (5 > 3 ) Reverse (5 > 3 ) Human CXCL1 GCGCCCAAACCGAAGTCATA ATGGGGGATGCAGGATTGAG PF4 CCCCACTGCCCAACTGATAG TTCTTGTACAGCGGGGCTTG
Figure S1 Genetic or pharmacologic COX-2 inhibition led to increased kidney
 SUPPLEMENTAL FIGURE LEGENDS Figure S1 Genetic or pharmacologic COX-2 inhibition led to increased kidney macrophage infiltration. Wild type or COX-2 -/- mice (2 months old, C57/Bl6 background) were treated
Figure 1. Dnmt3b expression in murine and human knee joint cartilage. (A) Representative images
 Representative images") Figure Legends Figure. expression in murine and human knee joint cartilage. () Representative images showing that Dnmta is not expressed in chondrocytes from mo W articular cartilage [Dnmta expression
Figure Legends Figure. expression in murine and human knee joint cartilage. () Representative images showing that Dnmta is not expressed in chondrocytes from mo W articular cartilage [Dnmta expression
Estrogen receptor α in medial amygdala neurons regulates body weight
 The Journal of Clinical Investigation Research article Estrogen receptor α in medial amygdala neurons regulates body weight Pingwen Xu, 1 Xuehong Cao, 1 Yanlin He, 1 Liangru Zhu, 1,2 Yongjie Yang, 1 Kenji
Nature Genetics: doi: /ng Supplementary Figure 1. Parameters and consequences of mononuclear cardiomyocyte frequency.
 Supplementary Figure 1 Parameters and consequences of mononuclear cardiomyocyte frequency. (a) Correlation of the frequency of mononuclear cardiomyocytes to the frequency of cardiomyocytes with three or
marker. DAPI labels nuclei. Flies were 20 days old. Scale bar is 5 µm. Ctrl is
 Supplementary Figure 1. (a) Nos is detected in glial cells in both control and GFAP R79H transgenic flies (arrows), but not in deletion mutant Nos Δ15 animals. Repo is a glial cell marker. DAPI labels
1.5 ASK1KO fed. fasted 16 hrs w/o water. Fed. 4th. 4th WT ASK1KO N=29, 11(WT), ,5(ASK1KO) ASK1KO ASK1KO **** Time [h]
![1.5 ASK1KO fed. fasted 16 hrs w/o water. Fed. 4th. 4th WT ASK1KO N=29, 11(WT), ,5(ASK1KO) ASK1KO ASK1KO **** Time [h]](/thumbs/87/97258189.jpg "1.5 ASK1KO fed. fasted 16 hrs w/o water. Fed. 4th. 4th WT ASK1KO N=29, 11(WT), ,5(ASK1KO) ASK1KO ASK1KO **** Time [h]") 7: 13: 19: 1: 7: 151117 a 151117 4th 4th b c RQ.95 KO.9.85.8.75.7 light dark light dark.65 7: 19: 7: 19: 7: Means ± SEM, N=6 RQ 1..9.8.7.6.6 KO CL (-) CL (+) ibat weight ratio (/body weight) [%].5.4.3.2.1
7: 13: 19: 1: 7: 151117 a 151117 4th 4th b c RQ.95 KO.9.85.8.75.7 light dark light dark.65 7: 19: 7: 19: 7: Means ± SEM, N=6 RQ 1..9.8.7.6.6 KO CL (-) CL (+) ibat weight ratio (/body weight) [%].5.4.3.2.1
Supplementary Materials for
 www.advances.sciencemag.org/cgi/content/full/1/3/e1400244/dc1 Supplementary Materials for PlGF-induced VEGFR1-dependent vascular remodeling determines opposing antitumor effects and drug resistance to
Title: Smooth muscle cell-specific Tgfbr1 deficiency promotes aortic aneurysm formation by stimulating multiple signaling events
 Title: Smooth muscle cell-specific Tgfbr1 deficiency promotes aortic aneurysm formation by stimulating multiple signaling events Pu Yang 1, 3, radley M. Schmit 1, Chunhua Fu 1, Kenneth DeSart 1, S. Paul
IKKα Causes Chromatin Modification on Pro-Inflammatory Genes by Cigarette Smoke in Mouse Lung
 IKKα Causes Chromatin Modification on Pro-Inflammatory Genes by Cigarette Smoke in Mouse Lung Se-Ran Yang, Samantha Valvo, Hongwei Yao, Aruna Kode, Saravanan Rajendrasozhan, Indika Edirisinghe, Samuel
Supplemental Information. Brown Adipogenic Reprogramming. Induced by a Small Molecule
 Cell Reports, Volume 18 Supplemental Information rown dipogenic Reprogramming Induced by a Small Molecule aoming Nie, Tao Nie, Xiaoyan Hui, Ping Gu, Liufeng Mao, Kuai Li, Ran Yuan, Jiashun Zheng, Haixia
Supplemental Information. Cell-Autonomous Regulation of Astrocyte. Activation by the Circadian Clock Protein BMAL1
 ell Reports, Volume 5 Supplemental Information ell-utonomous Regulation of strocyte ctivation by the ircadian lock Protein ML1 rian V. Lananna, ollin J. Nadarajah, Mariko Izumo, Michelle R. edeño, avid.
Inhibition of DYRK1A stimulates human beta-cell proliferation
 Inhibition of DYRK1A stimulates human beta-cell proliferation Ercument Dirice 1,, Deepika Walpita 2,, Amedeo Vetere 2, Bennett C. Meier 2,5, Sevim Kahraman 1, Jiang Hu 1, Vlado Dančík 2, Sean M. Burns
Nature Neuroscience: doi: /nn Supplementary Figure 1
 Supplementary Figure 1 Quantification of myelin fragments in the aging brain (a) Electron microscopy on corpus callosum is shown for a 18-month-old wild type mice. Myelin fragments (arrows) were detected
Over-expression of MKP-3 and knockdown of MKP-3 and FOXO1 in primary rat. day, cells were transduced with adenoviruses expressing GFP, MKP-3 or shgfp,
 SUPPLEMENTAL METHODS Over-expression of MKP-3 and knockdown of MKP-3 and FOXO1 in primary rat hepatocytes Primary rat hepatocytes were seeded as described in experimental procedures. The next day, cells
Supplementary Table 1. Metabolic parameters in GFP and OGT-treated mice
 Supplementary Table 1. Metabolic parameters in GFP and OGT-treated mice Fasted Refed GFP OGT GFP OGT Liver G6P (mmol/g) 0.03±0.01 0.04±0.02 0.60±0.04 0.42±0.10 A TGs (mg/g of liver) 20.08±5.17 16.29±0.8
Male 30. Female. Body weight (g) Age (weeks) Age (weeks) Atg7 f/f Atg7 ΔCD11c
 Age (weeks) Age (weeks) Atg7 f/f Atg7 ΔCD11c") ody weight (g) ody weight (g) 34 3 Male 3 27 Female 26 24 22 18 7 9 11 13 15 17 19 21 23 21 18 15 7 9 11 13 15 17 19 21 23 Age (weeks) Age (weeks) Supplementary Figure 1. Lean phenotypes in mice regardless
ody weight (g) ody weight (g) 34 3 Male 3 27 Female 26 24 22 18 7 9 11 13 15 17 19 21 23 21 18 15 7 9 11 13 15 17 19 21 23 Age (weeks) Age (weeks) Supplementary Figure 1. Lean phenotypes in mice regardless
Supplemental Information. CD4 + CD25 + Foxp3 + Regulatory T Cells Promote. Th17 Cells In Vitro and Enhance Host Resistance
 Immunity, Volume 34 Supplemental Information D4 + D25 + + Regulatory T ells Promote Th17 ells In Vitro and Enhance Host Resistance in Mouse andida albicans Th17 ell Infection Model Pushpa Pandiyan, Heather
Supplementary Figure 1.
 Supplementary Figure 1. Female Pro-ins2 -/- mice at 5-6 weeks of age were either inoculated i.p. with a single dose of CVB4 (1x10 5 PFU/mouse) or PBS and treated with αgalcer or control vehicle. On day
Supplementary Figure 1 Validation of Per2 deletion in neuronal cells in N Per2 -/- mice. (a) Western blot from liver extracts of mice held under ad
 Western blot from liver extracts of mice held under ad") Supplementary Figure 1 Validation of Per2 deletion in neuronal cells in N Per2 -/- mice. (a) Western blot from liver extracts of mice held under ad libitum conditions detecting PER2 protein in brain and
Supplementary Figure 1 Validation of Per2 deletion in neuronal cells in N Per2 -/- mice. (a) Western blot from liver extracts of mice held under ad libitum conditions detecting PER2 protein in brain and
SUPPLEMENTARY INFORMATION
 SUPPLEMENTARY INFORMATION doi:10.1038/nature11905 WWW.NATURE.COM/NATURE 1 RESEARCH SUPPLEMENTARY INFORMATION Supplementary Figure 1 Quantification of integrated chorda tympani nerve responses. Quantification
Supplemental Information. Regulatory T Cells Promote Macrophage. Efferocytosis during Inflammation Resolution
 Immunity, Volume 9 Supplemental Information Regulatory T Cells Promote Macrophage Efferocytosis during Inflammation Resolution Jonathan D. Proto, Amanda C. Doran, Galina Gusarova, Arif Yurdagul Jr., Erdi
Supplementary Information
 Supplementary Information Overexpression of Fto leads to increased food intake and results in obesity Chris Church, Lee Moir, Fiona McMurray, Christophe Girard, Gareth T Banks, Lydia Teboul, Sara Wells,
Control. csarnt -/- Cre, f/f
 ody weight (g) A re,f/f re x f/f f/+ re, f/+ re,f/+ f/f x f/f f/+ cs -/- re, f/f re f/f re, f/f Normal chow Tamoxifen Tamoxifen Tamoxifen W 4W re f/f re, re/ff f/f re f/f re, re/ff f/f Normal chow Tamoxifen
Supplementary Material for
 Supplementary Material for Parathyroid Hormone Signaling through Low-density-lipoprotein-related Protein 6 Mei Wan, Chaozhe Yang, Jun Li, Xiangwei Wu, Hongling Yuan, Hairong Ma, Xi He, Shuyi Nie, Chenbei
SOM Husse et al. Supplementary online material. Synaptotagmin10-Cre, a driver to disrupt clock genes in the SCN
 SOM Husse et al. Supplementary online material Synaptotagmin10-Cre, a driver to disrupt clock genes in the SCN Jana Husse, Xunlei Zhou, Anton Shostak, Henrik Oster and Gregor Eichele SOM Husse et al.,
SUPPLEMENTARY INFORMATION
 doi: 10.1038/nature06310 SUPPLEMENTARY INFORMATION www.nature.com/nature 1 www.nature.com/nature 2 www.nature.com/nature 3 Supplementary Figure S1 Spontaneous duration of wake, SWS and REM sleep (expressed
Fig. S1. Dose-response effects of acute administration of the β3 adrenoceptor agonists CL316243, BRL37344, ICI215,001, ZD7114, ZD2079 and CGP12177 at
 Fig. S1. Dose-response effects of acute administration of the β3 adrenoceptor agonists CL316243, BRL37344, ICI215,001, ZD7114, ZD2079 and CGP12177 at doses of 0.1, 0.5 and 1 mg/kg on cumulative food intake
A synergistic anti-obesity effect by a combination of capsinoids and cold temperature through the promotion of beige adipocyte biogenesis
 A synergistic anti-obesity effect by a combination of capsinoids and cold temperature through the promotion of beige adipocyte biogenesis Kana Ohyama, 1,2 Yoshihito Nogusa, 1 Kosaku Shinoda, 2 Katsuya
Supplementary Figure S I: Effects of D4F on body weight and serum lipids in apoe -/- mice.
 Supplementary Figures: Supplementary Figure S I: Effects of D4F on body weight and serum lipids in apoe -/- mice. Male apoe -/- mice were fed a high-fat diet for 8 weeks, and given PBS (model group) or
Supplementary Figure 1
 Supplementary Figure 1 A B mir-141, human cell lines mir-2c, human cell lines mir-141, hepatocytes mir-2c, hepatocytes Relative RNA.1.8.6.4.2 Relative RNA.3.2.1 Relative RNA 1.5 1..5 Relative RNA 2. 1.5
Zhu et al, page 1. Supplementary Figures
 Zhu et al, page 1 Supplementary Figures Supplementary Figure 1: Visual behavior and avoidance behavioral response in EPM trials. (a) Measures of visual behavior that performed the light avoidance behavior
Supplementary Figure 1: Hsp60 / IEC mice are embryonically lethal (A) Light microscopic pictures show mouse embryos at developmental stage E12.
 Light microscopic pictures show mouse embryos at developmental stage E12.") Supplementary Figure 1: Hsp60 / IEC mice are embryonically lethal (A) Light microscopic pictures show mouse embryos at developmental stage E12.5 and E13.5 prepared from uteri of dams and subsequently genotyped.
Supplementary Figure 1: Hsp60 / IEC mice are embryonically lethal (A) Light microscopic pictures show mouse embryos at developmental stage E12.5 and E13.5 prepared from uteri of dams and subsequently genotyped.
Supplementary Figure 1
 Supplementary Figure 1 a Percent of body weight! (%) 4! 3! 1! Epididymal fat Subcutaneous fat Liver SD Percent of body weight! (%) ** 3! 1! SD Percent of body weight! (%) 6! 4! SD ** b Blood glucose (mg/dl)!
IL-34 is a tissue-restricted ligand of CSF1R required for the development of Langerhans cells and microglia
 Supplementary Figures IL-34 is a tissue-restricted ligand of CSF1R required for the development of Langerhans cells and microglia Yaming Wang, Kristy J. Szretter, William Vermi, Susan Gilfillan, Cristina
Expanded View Figures
 MO reports PR3 dephosphorylates TZ Xian-o Lv et al xpanded View igures igure V1. PR3 dephosphorylates and inactivates YP/TZ., Overexpression of tight junction proteins Pals1 () or LIN7 () has no effect
SUPPLEMENTARY INFORMATION
 doi: 1.138/nature7221 Brown fat selective genes 12 1 Control Q-RT-PCR (% of Control) 8 6 4 2 Ntrk3 Cox7a1 Cox8b Cox5b ATPase b2 ATPase f1a1 Sirt3 ERRα Elovl3/Cig3 PPARα Zic1 Supplementary Figure S1. stimulates
Probe. Hind III Q,!?R'!! /0!!!!D1"?R'! vector. Homologous recombination
 Supple-Zhang Page 1 Wild-type locus Targeting construct Targeted allele Exon Exon3 Exon Probe P1 P P3 FRT FRT loxp loxp neo vector amh I Homologous recombination neo P1 P P3 FLPe recombination Q,!?R'!!