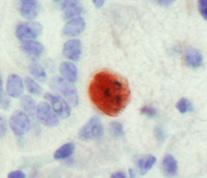
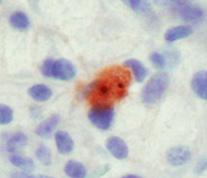
Reason for Dissection. Pleomorphic adenoma. Tongue base adenocarcinoma
|
|
|
- Bruno Lambert
- 5 years ago
- Views:
Transcription
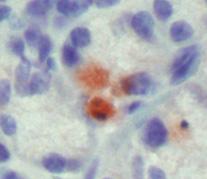
1 Supplementary Table S1 Human Patients Patient Sample No. Gender Age Additional Medication Treatment 1 Reason for Dissection Total Irradiation Dose Estimated Irradiation Dose to SG Gland Time of Resection Post-IR 5554 Male 45 None Mandibular SCC None NA NA 2776 Female 25 None 1100 Male 70 None Pleomorphic adenoma Tongue base adenocarcinoma None NA NA None NA NA 7045 Male 48 None Lower lip SCC None NA NA 2836 Male 69 Zantaz, Convertin Floor mouth SCC 35 Gy 30 Gy 8 months 8567 Male 39 None MALIGNANT FIBROUS HISTIOCYTOMA Conjuctiva 70 Gy 50Gy 4 months 1991 Male 60 None Maxillary SCC 60 Gy 50Gy 4 months 1 Patients did not receive chemotherapy.
2 Supplementary Fig. S1A
3 Supplementary Fig. S1B
4 Supplementary Fig. S1C
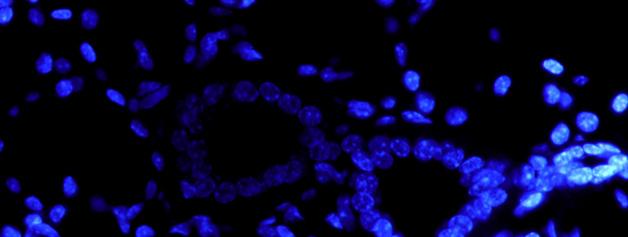
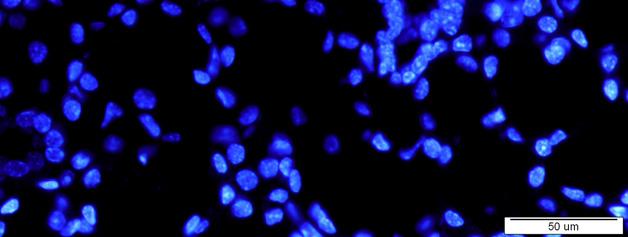
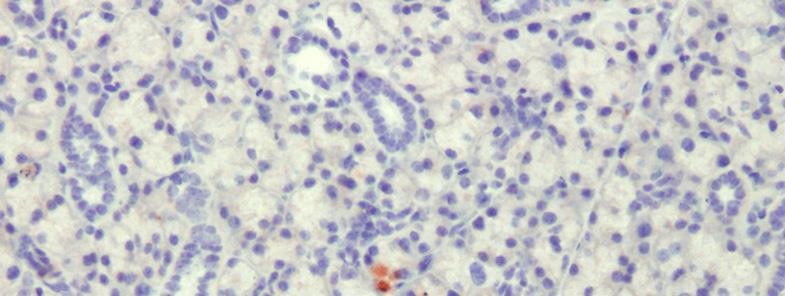
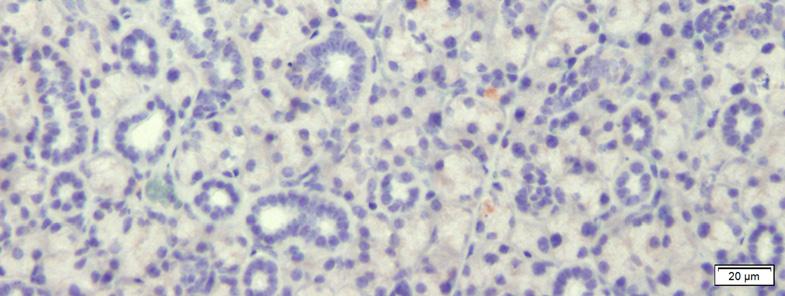
5 Supplementary Fig. S2A TUNEL DNA Merge 17 Gy 15 Gy 13 Gy Naive
6 Supplementary Fig. S2B Naïve 13Gy 15Gy 17Gy
7 Supplementary Fig. S3B H2AX DNA Merged C H2AX 53BP1 DNA Merged
8 Supplementary Fig. S4 H2AX DNA Merged IL6 -/- +IR WT +IR IL6 -/- Naïve WT Naïve
9 Supplementary Fig. S5
10 Supplementary Fig. S6 H2Ax DNA merged HIL6 +IR IL-6 +IR Saline +IR Naïve
11 Supplementary Fig. S7A Naïve H2AX DNA merged IL-6 +IR 72h Saline +IR 72h IL-6 +IR 48h Saline +IR 48h IL-6 +IR 4h Saline +IR 4h
12 Supplementary Fig. S7B
13 Supplementary Fig. S8A IL-6 -/- +IR 4h WT +IR 4h WT Naive H2Ax DNA merged IL-6 -/- 72h WT 72h IL-6 -/- 48h WT 48h
14 Supplementary Fig. S8B
15 Supplementary Fig. S9
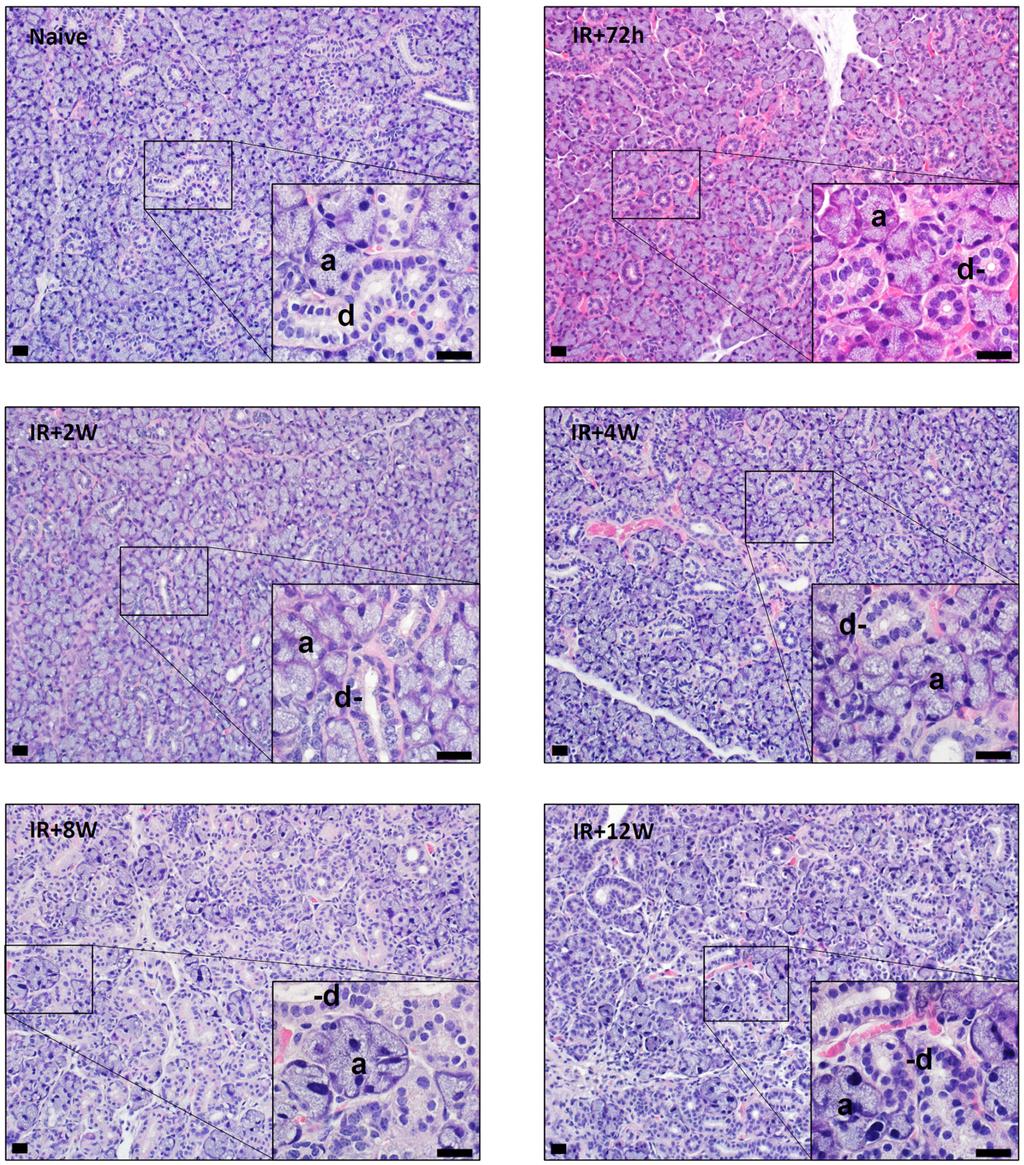
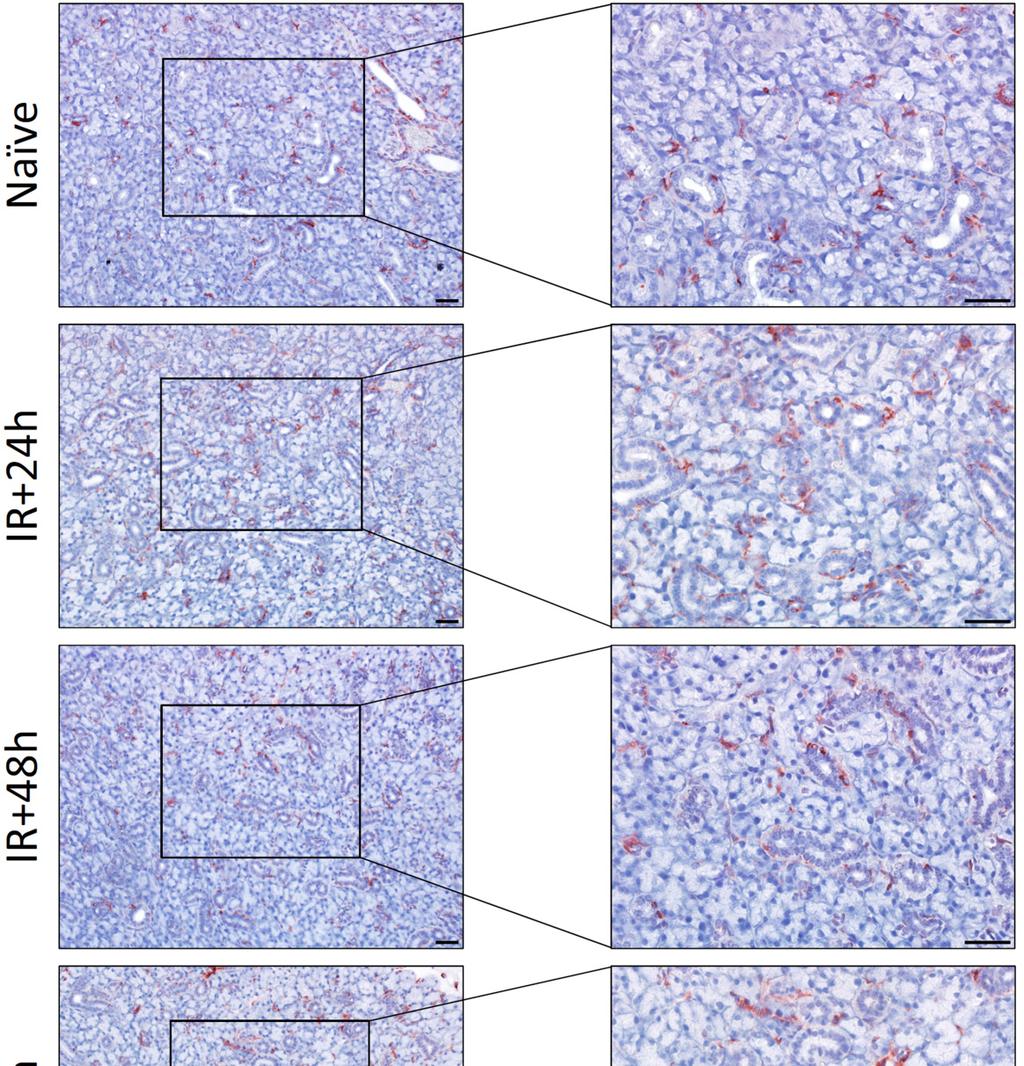
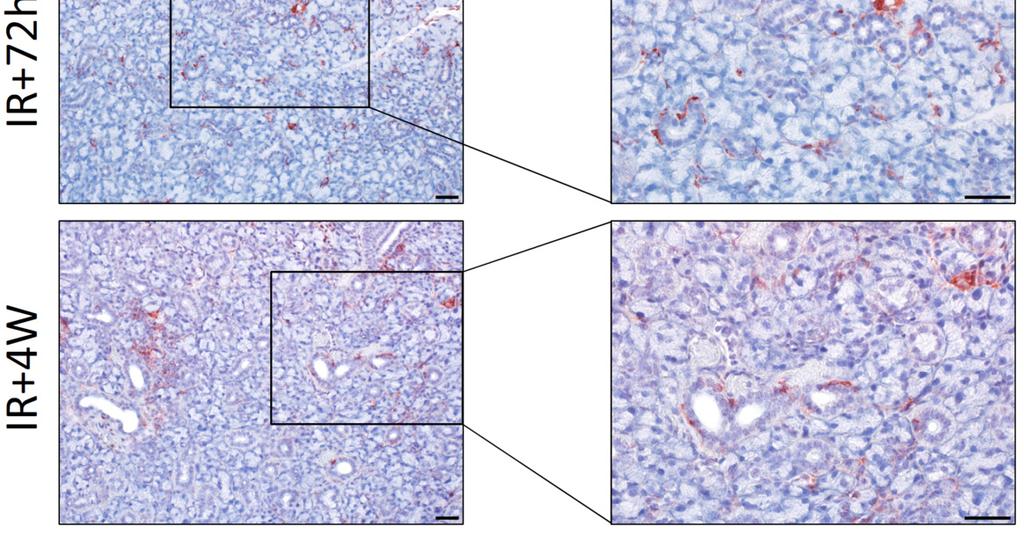
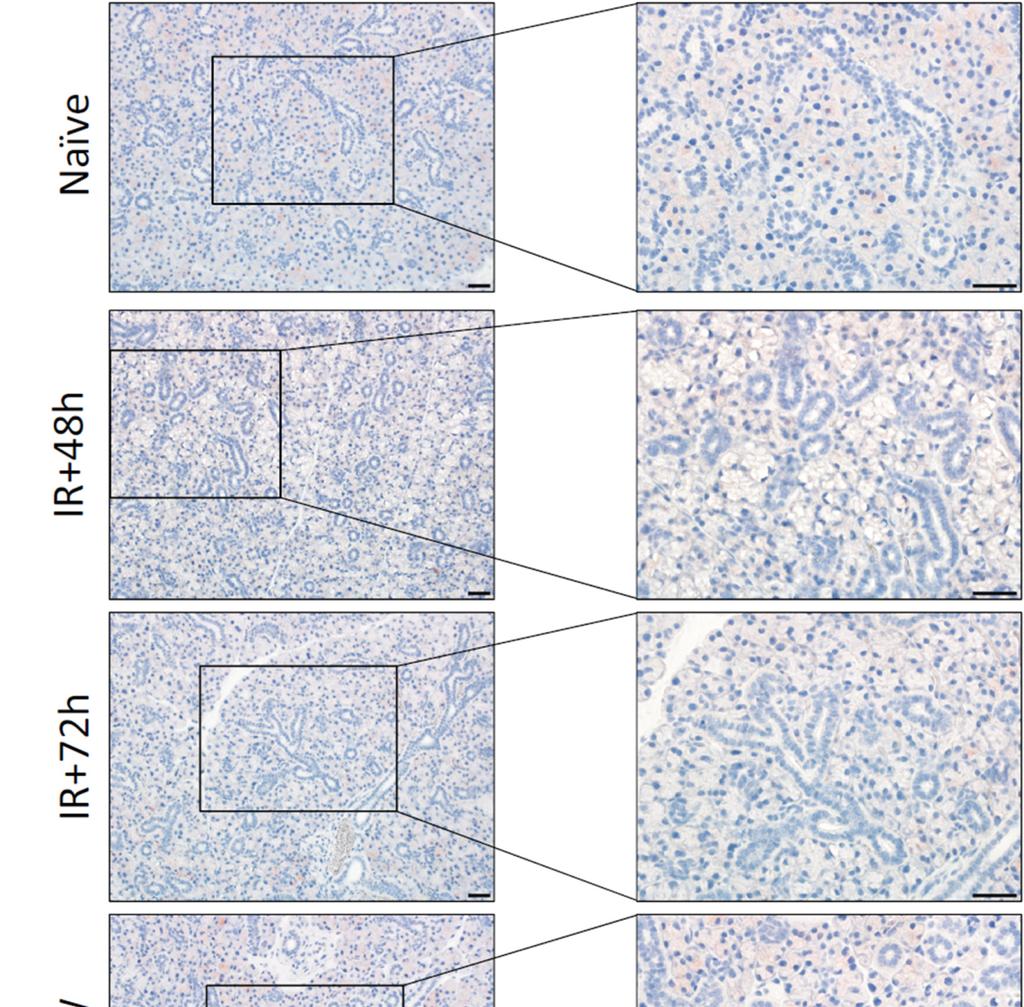
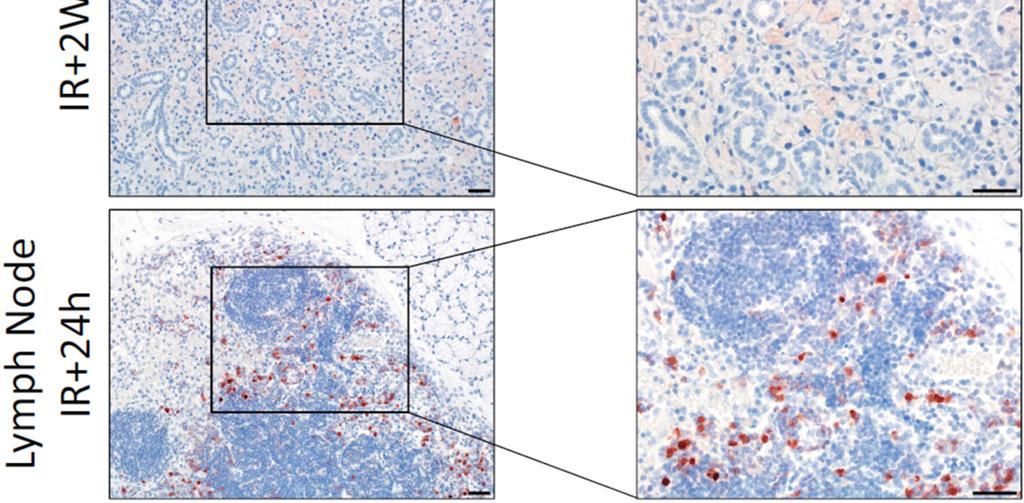
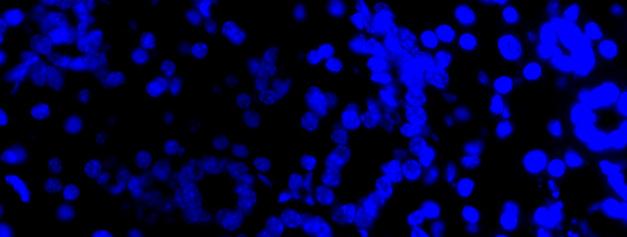
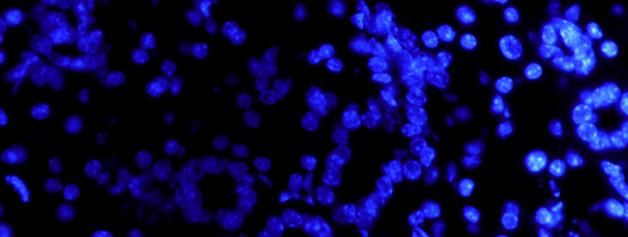
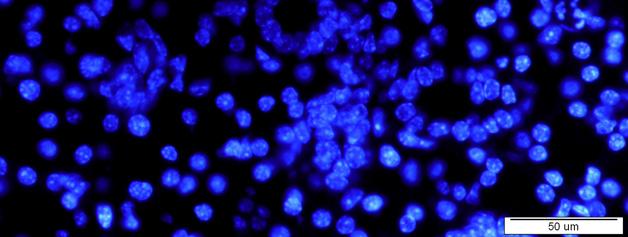
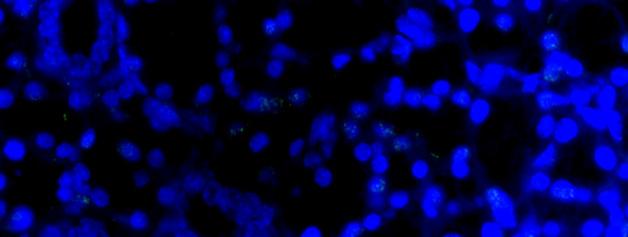
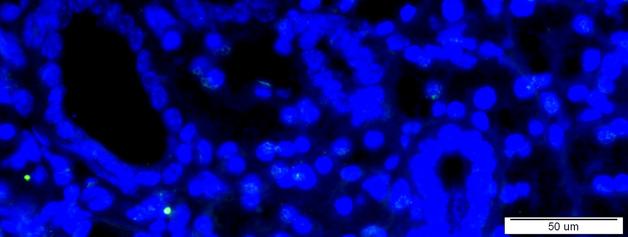
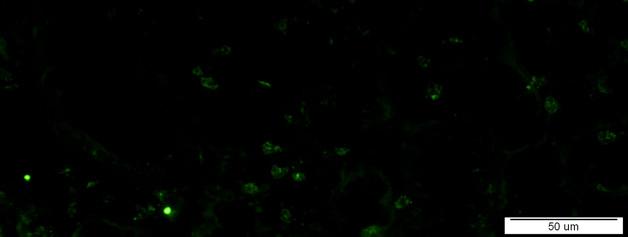
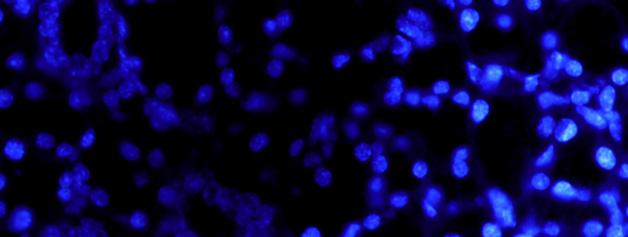
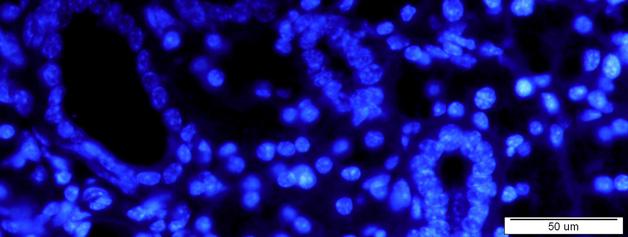
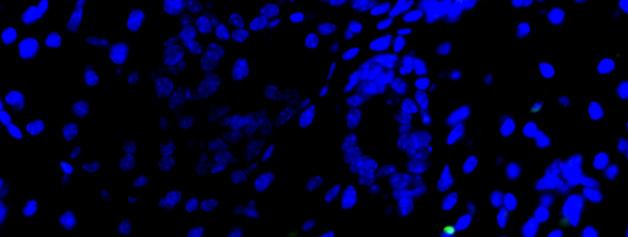
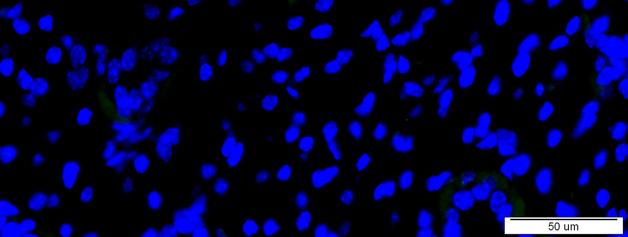
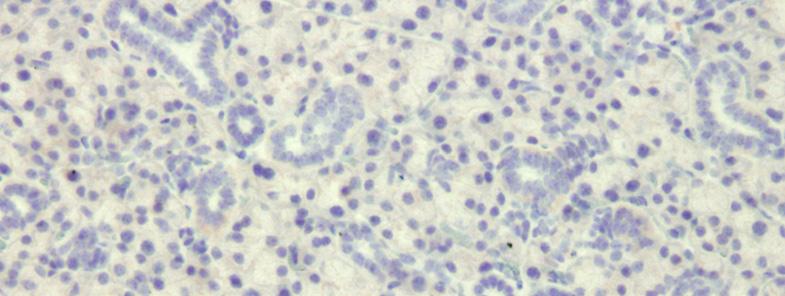
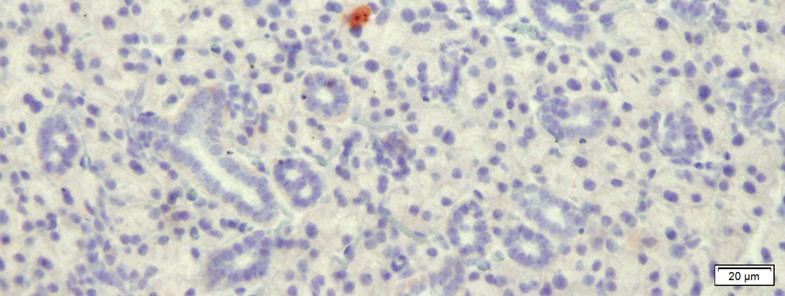
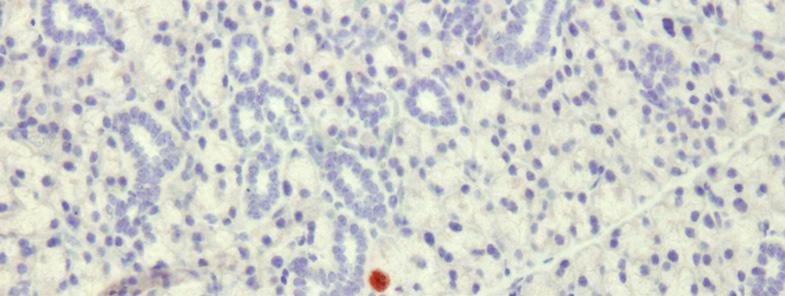
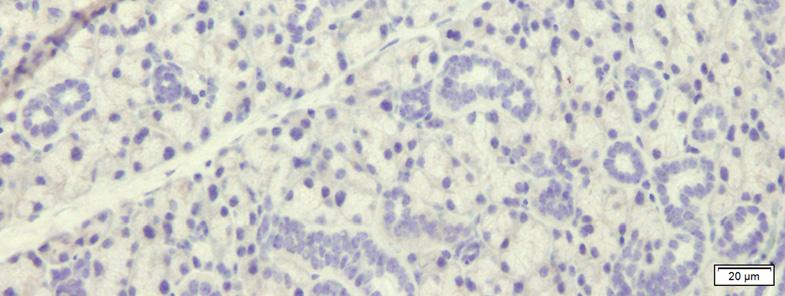
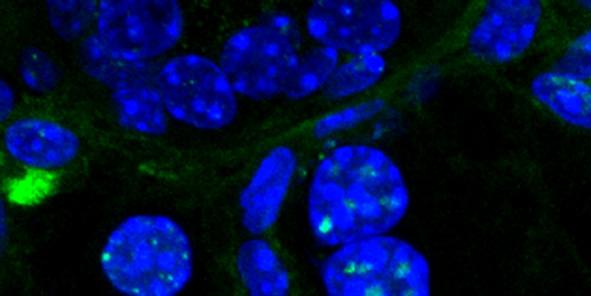
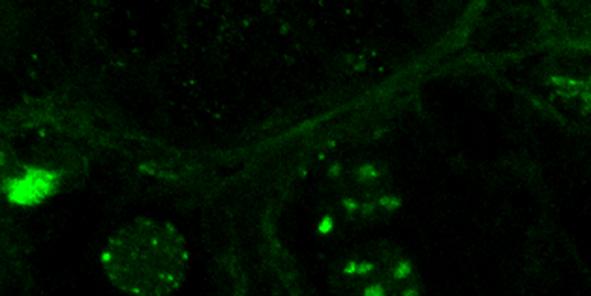
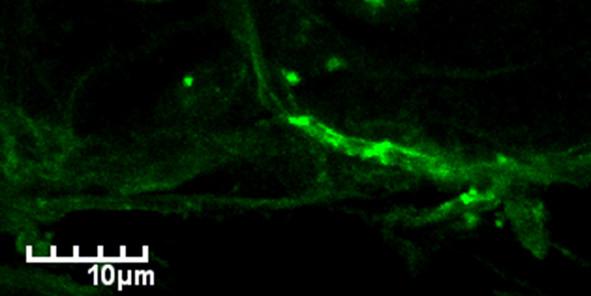
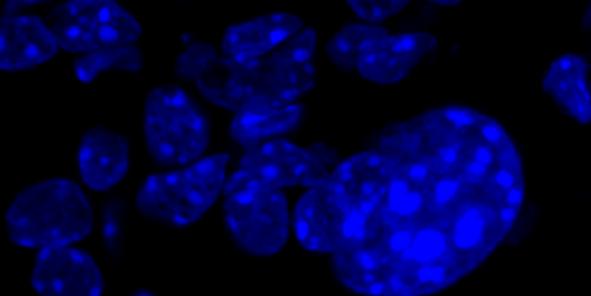
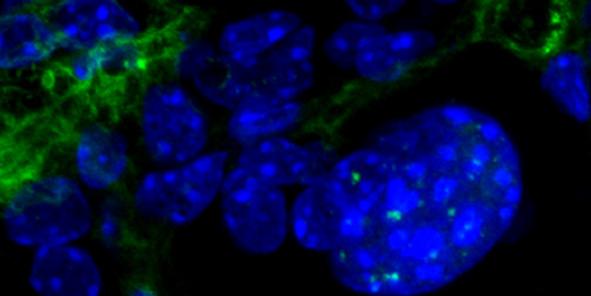
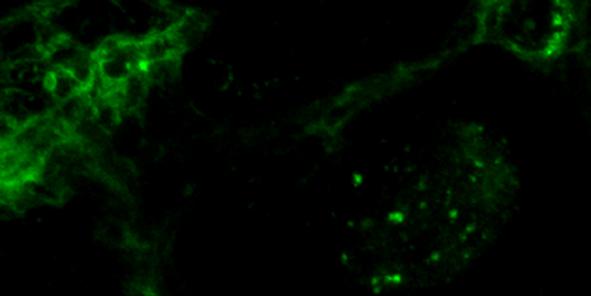
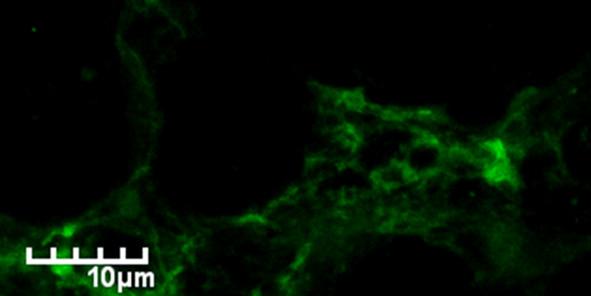
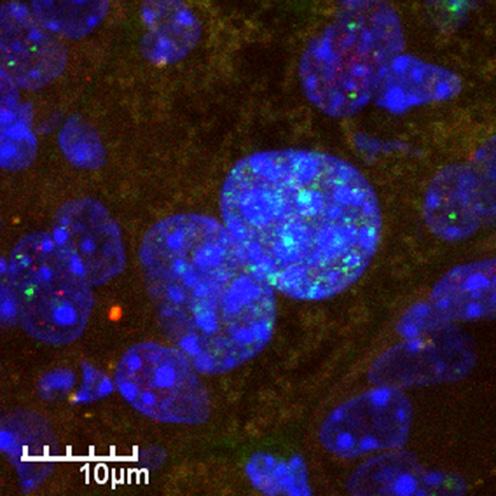
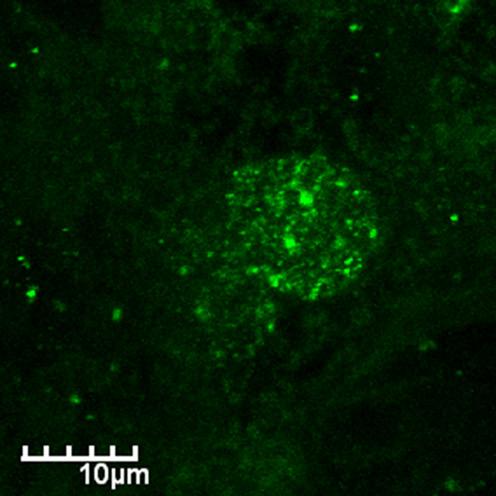
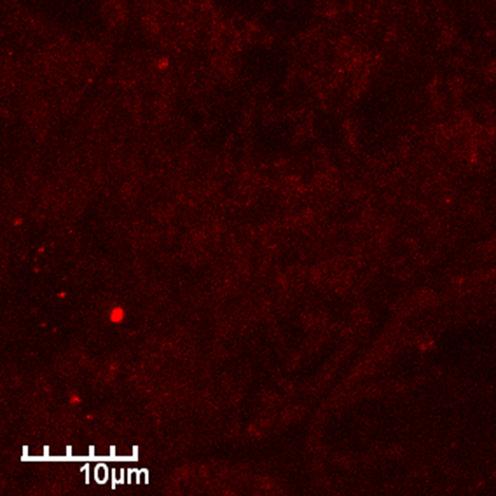
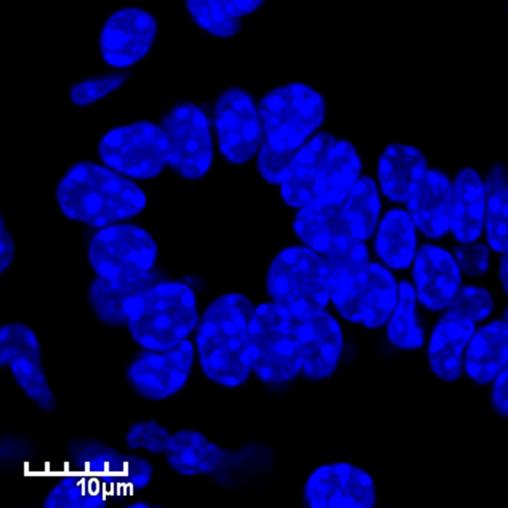
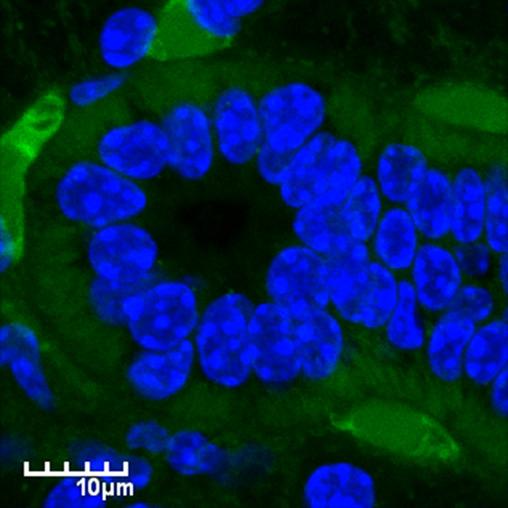
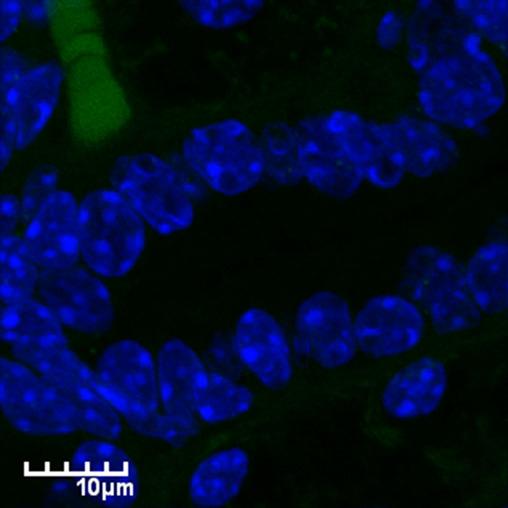
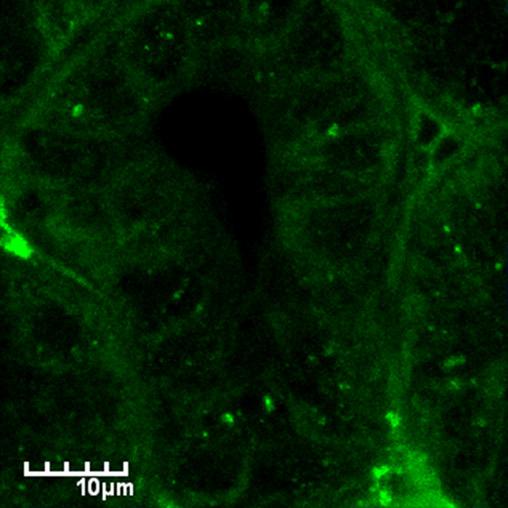
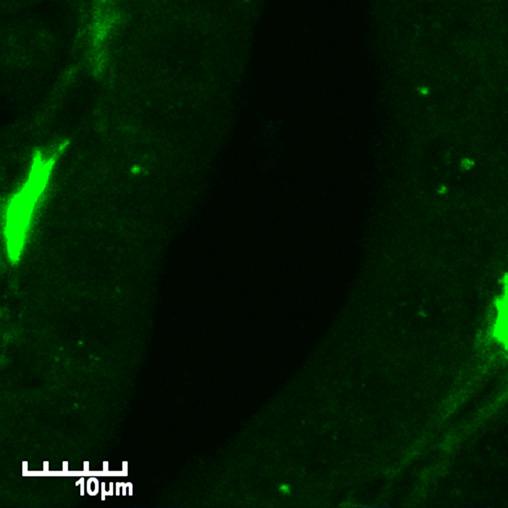
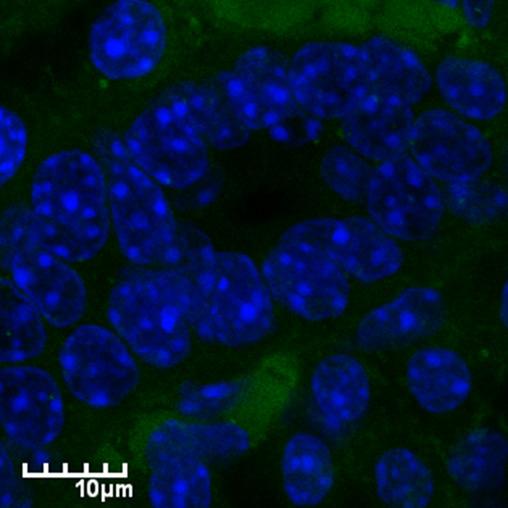
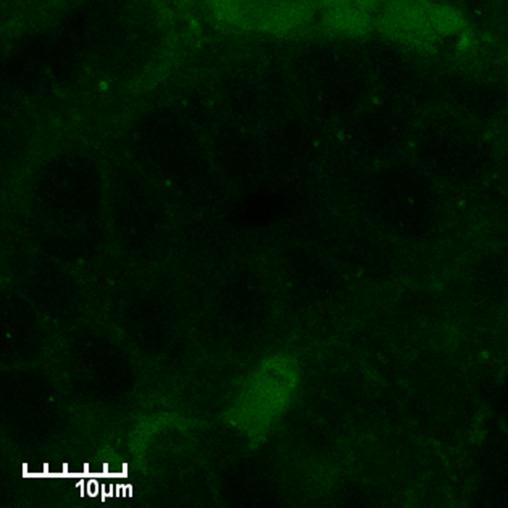
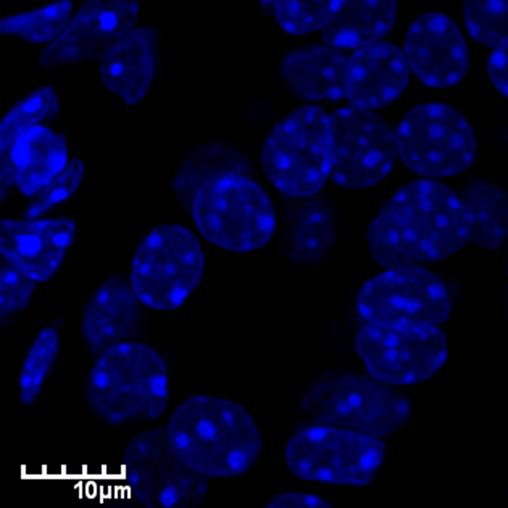
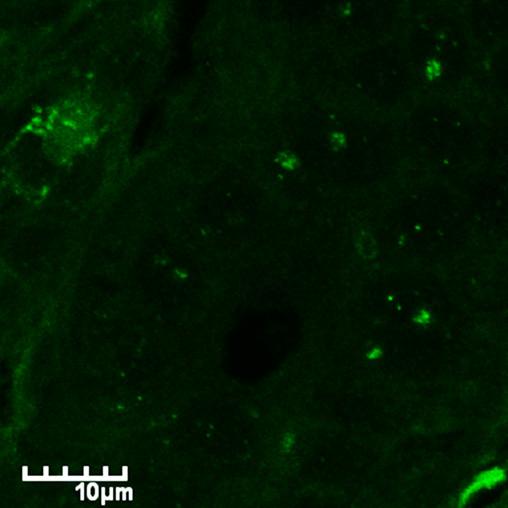
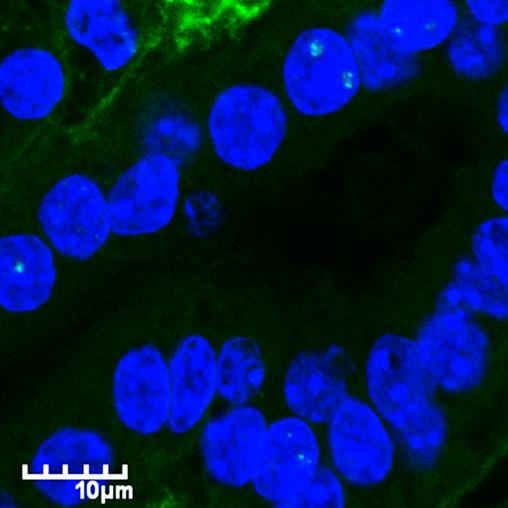
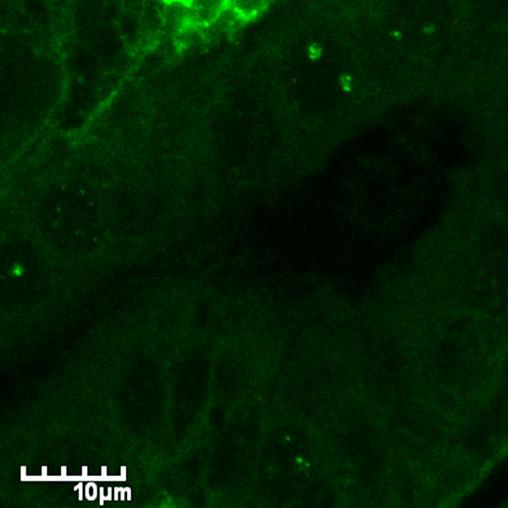
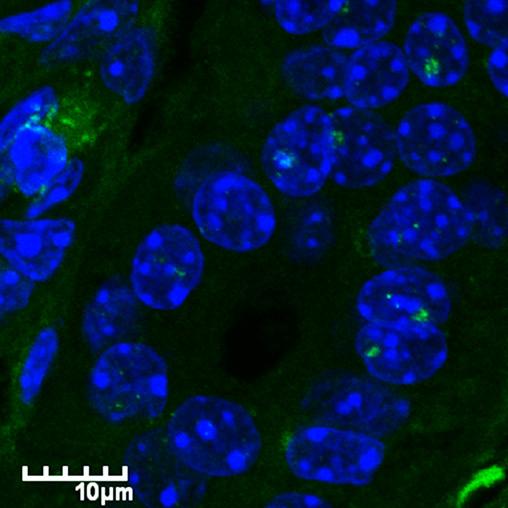
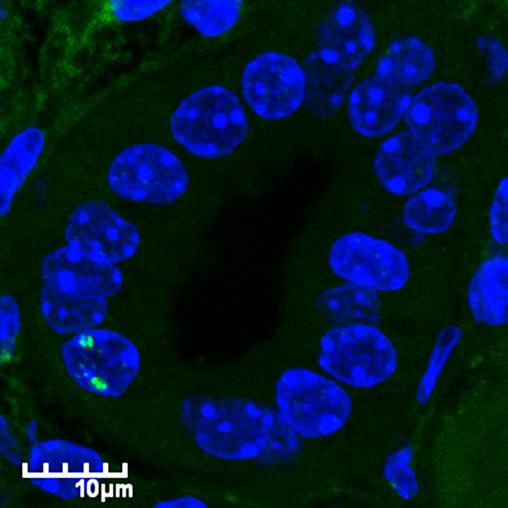
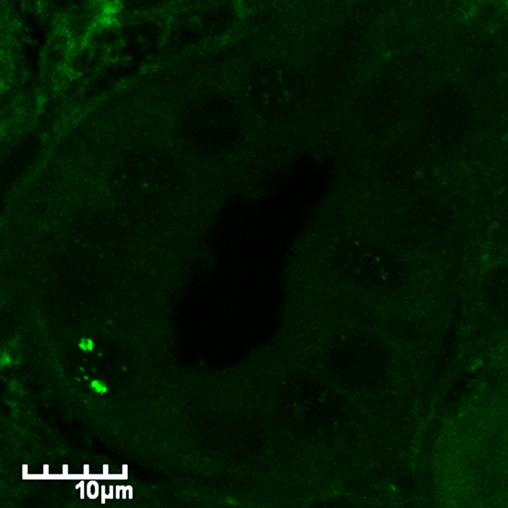
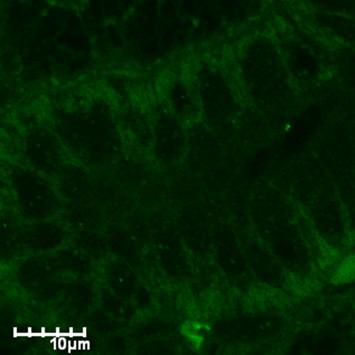
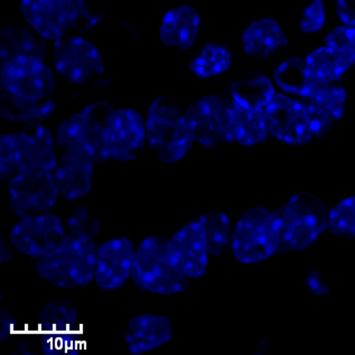
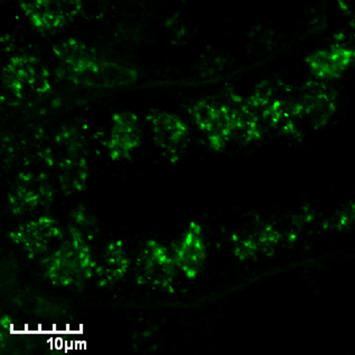
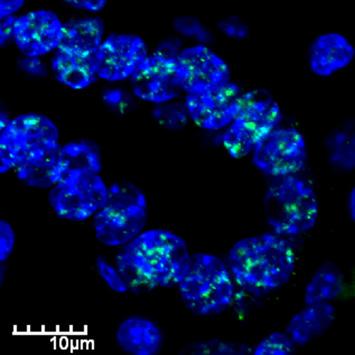
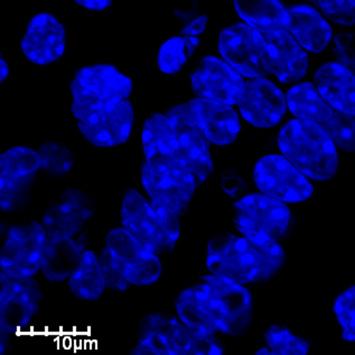
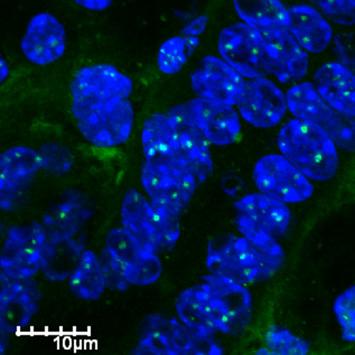
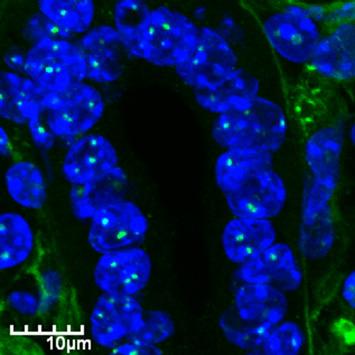
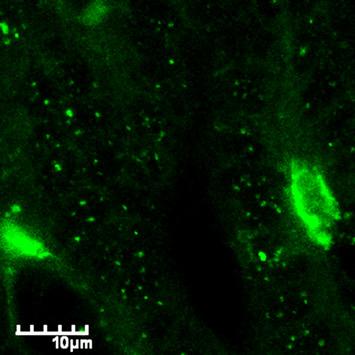
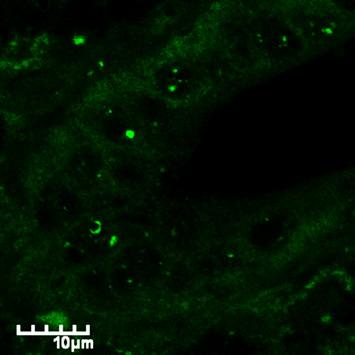
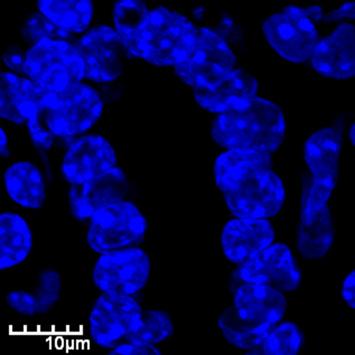
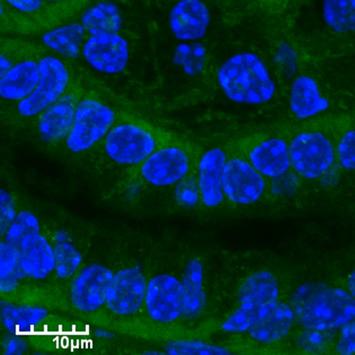
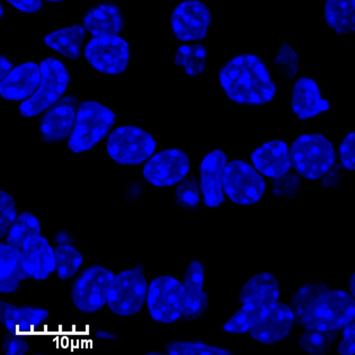
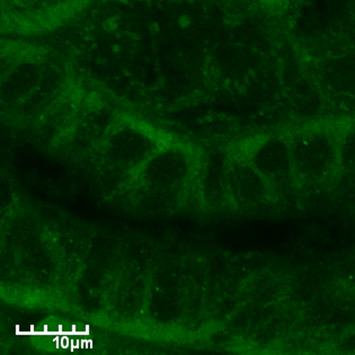
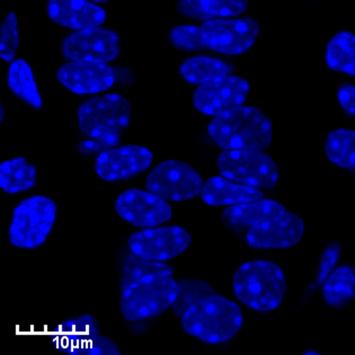
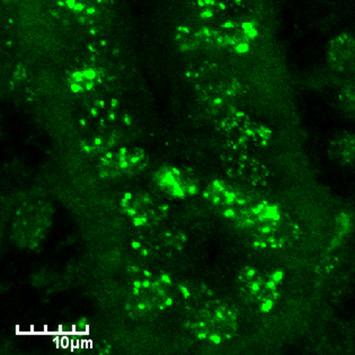
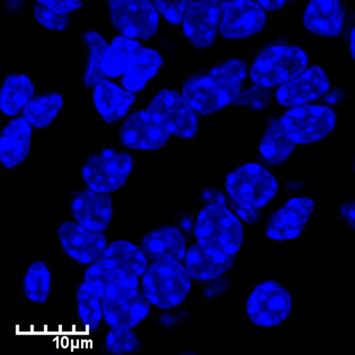
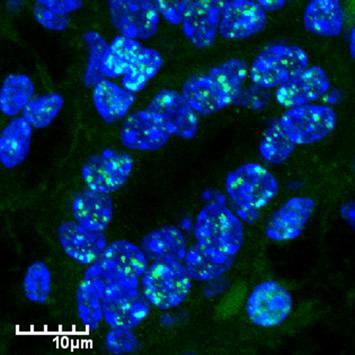
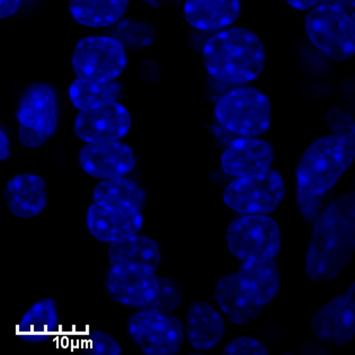
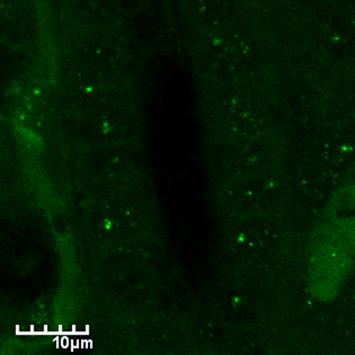
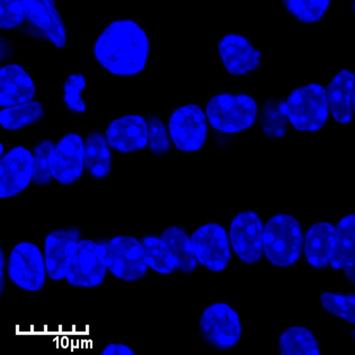
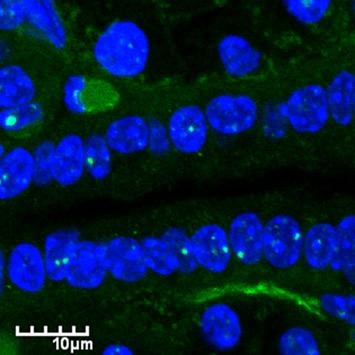
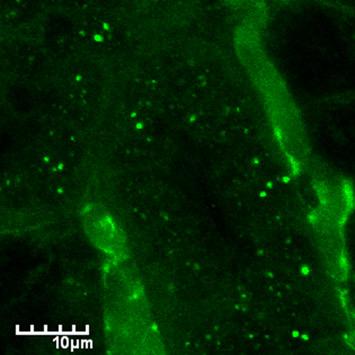
16 Supplementary Figure Legends Fig. S1 Radiation-induced morphological changes in the salivary glands. Thin sections of formalin fixed and paraffin embedded submandibular salivary glands from naïve and irradiated (13Gy) mice. Submandibular salivary glands were excised at 24, 48, 72, hours (h), and 2, 4, 8 and 12 weeks (W) post-irradiation and stained with (A) H&E; or immunostained for (B) macrophages (F4/80), or (C) neutrophils (Ly6B). Neutrophil staining in a lymph node adjoining the salivary gland is shown as a positive control. Scale bars, (a) 10 m and (b,c) 20 m; a acini, d ducts. No changes in either macrophage infiltration (red staining) or neutrophil (red staining) infiltration in the salivary gland were evident up to 2-4 weeks post-irradiation. Fig. S2 Apoptosis is not a prominent feature in salivary glands irradiated at doses causing hypofunction. (A) Representative micrographs of fluorescent TUNEL staining (green), and counterstained to show nuclei (blue), in thin sections of submandibular salivary glands taken from mice 48 hours following irradiation with 13, 15 or 17 Gy to the head and neck. Scale bars, 50 m. TUNEL staining observed at 17 Gy was most notable in ductal cells. (B) Representative micrographs of caspase 3 immunostaining (red-brown) in histological sections from salivary glands in (A). Scale bars, 20 m. Fig. S3 Morphologically aberrant acinar cells of irradiated salivary glands show evidence of DNA damage. Representative confocal immunofluorescence staining images of (A) aquaporin 5 (red), (B) H2AX (green), and (C) H2AX (green) and 53BP1 (red) co-immunostaining in salivary glands from naïve and irradiated (13 Gy) mice removed 8 weeks post-irradiation (13 Gy) and counterstained to show nuclei (blue). Scale bars, 20 m (A) and 10 m (B,C). Arrows enlarged, morphologically irregular acinar cells.
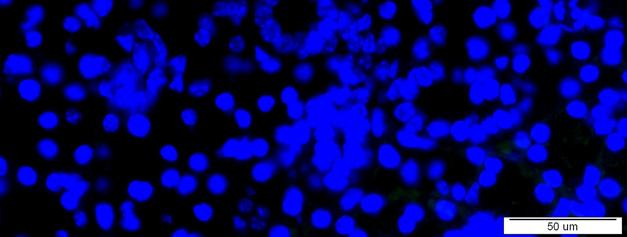
17 Fig. S4 IL-6 is crucial for persistent DDR signaling in irradiated salivary glands. Representative confocal images of H2AX immunostaining (green nuclear foci) in salivary gland thin sections in irradiated (5x5.6 Gy) wild-type and IL-6 -/- mice, 8 weeks post-irradiation, counterstained to show nuclei (blue). Scale bars, 10 m. Fig. S5 IL-6 infusion upregulates of IL-6 mrna in the salivary gland. Analysis of IL- 6 mrna by Real-Time PCR in the submandibular salivary glands taken 5h following infusion of IL-6 (15 ng) or normal saline with or without irradiation (13 Gy) 3h postinfusion. (RQ Relative Quantification, Data represent mean ± s.e.m. *P<0.05 using two-tailed Mann-Whitney test; n=4-6). Fig. S6 Local treatment with IL-6 or HIL-6 reduces irradiation-induced senescence in the salivary gland. Representative confocal images of H2AX (green nuclear foci) immunostaining in submandibular salivary glands from mice treated by retrograde infusion of molar equivalents of either IL-6 (15 ng) or HIL-6 (50 ng) protein and irradiated (5x5.6 Gy). Stainings were performed on glands taken 8 weeks postirradiation and counterstained to show nuclei (blue). Scale bars, 10 m. Fig. S7 IL-6 pretreatment accelerates DNA damage repair shortly following irradiation. (A) Representative confocal images of H2AX immunofluorescence staining of (nuclear green foci) and counterstained to show nuclei (blue), in submandibular salivary glands from mice pretreated by retrograde infusion of IL-6 (30 ng) or normal saline and removed either before treatment (naïve), or 4h, 48h, or 72h post-irradiation (+IR) (5.6 Gy). Scale bars, 10 m. (B) Quantification of nuclear H2AX foci in ductal cells from (A) (naïve, and 4h and 48h post-ir). Due to their density, foci were quantified as pixels per nuclei in the ductal cells. (Data are means ± s.e.m.; ***P<0.001, #P<0.05 versus all other groups using two-tailed Mann-Whitney test; Naive, n=3; Saline+IR (4h) and IL-6+IR (48h), n=9; IL-6+IR (4h), n=10; and Saline+IR (48h), n=8).
18 Fig. S8 IL-6 deficiency does not affect DNA damage response at early times following irradiation. (A) Representative confocal images of H2AX immunofluorescence staining of (nuclear green foci) and counterstained to show nuclei (blue), in submandibular salivary glands from naïve wild-type mice, or wildtype and IL-6 -/- mice removed 4h, 48h, or 72h post-irradiation (+IR) (5.6 Gy). Scale bars, 10 m. (B) Quantification of nuclear H2AX foci in ductal cells. Due to their density, foci were quantified as pixels per nuclei in the ductal cells. (Data are means ± s.e.m.; **P<0.01 and #P<0.05 versus WT+IR(4h) and IL-6 -/- +IR(4h) using two-tailed Mann-Whitney test; Naive, n=3; WT+IR (4h) and IL-6 -/- +IR(4h), n=6; WT+IR (48h) and IL-6 -/- +IR(48h), n=4). Fig. S9 The effect of local HIL-6 pretreatment on in vivo antitumoral efficacy of radiotherapy. The effect of HIL-6 (50 ng) infusion to the salivary gland on the radiosensitivity of tumors was tested in BALB/C mice bearing tumors derived from distally implanted SQ2 anaplastic squamous cell carcinoma cells (1). Irradiation (14 Gy) treated mice were administered either HIL-6 (50 ng) (filled triangles) or Normal Saline carrier (filled squares) by retrograde infusion to the submandibular glands, 3-4 hours prior to irradiation. Tumor volume compared between irradiated and nonirradiated controls (filled circles). (Data are means ± s.e.m.; No differences were observed in average tumor volume between HIL-6 and Saline treated groups as compared by Mann-Whitney rank test; P>0.1. *P<0.05 and ***P<0.001 versus irradiated mice, using two-tailed Mann-Whitney test; Non-irradiated, n=7; Saline+IR and HIL-6+IR n=6).
19 Supplementary Methods Western blot analysis Protein extracts were prepared from tissue samples (~100mg) by homogenization and subjected to Western blot analysis as described previously (1). Blots were probed with antibodies to p-stat3, STAT3, (Santa Cruz Biotechnology, Santa Cruz, CA), or murine IL-6R (R&D) and developed with HRP Envision (DAKO). As a loading control, the blots were stripped with 0.1 M glycine ph 2.8 and re-probed with a monoclonal anti-β-actin antibody (Sigma). Quantitation of Western blot bands was performed using TINA 2.10g Imaging software. IL 6 ELISA Murine serum IL6 levels were determined using a mouse IL6 DuoSet ELISA kit (R&D, USA) according to the manufacturer s instructions on serum samples stored at -20 C. RNA RNA was extracted from snap frozen tissue specimens using TRIzol reagent (Invitrogen, Carlsbad, CA, USA) as described(2). Reverse transcription of total RNA was performed using the qscripttm cdna Synthesis Kit (#95047) and Quantiative PCR (qpcr) of mrna was performed using PerfeCTa SYBR Green FastMix ROX (#95073) (Quanta BioSciences Inc., Gaithersburg, MD, USA). qpcr assay was performed on an AB 7900 HT fast Real-Time PCR system (Applied Biosystems, Foster City, CA, USA) or CFX384 TM Real-Time System with C1000 Touch Thermal Cycle (BioRad, Hercules, CA, USA). The fold expression and statistical - Ct significance were calculated using the 2 method. All experiments were performed in triplicate. The primers used for qpcr are: Cdknia AGGCAGACCAGCCTGACAGAT, and TCCTGACCCACAGCAGAAGAG; DCR2 GCTGTGTCTGTGGCTGTGACTT and TCCTCATCCGTCTTTGAGAAGC; CDKN2D (P19) GGCCTTGCAGGTCATGATGTTT and GACATCAGCACCATGCTCCAC; PAI1 ATGGCTCAGAGCAACAAGTTCA and TAGGGCAGTTCCACAACGTCAT; IL-6 ATACCACTCCCAACAGACCTGTC and CAGAATTGCCATTGCACAACTC; and HPRT
20 GTTAAGCAGTACAGCCCCAA and GGGCATATCCAACAACAAACT. Detection of IL-6R mrna by RT-PCR was performed as described previously (1). In vivo tumor model SQ2 cells (10 6 ), derived from a spontaneous anaplastic squamous cell carcinoma of BABL/C origin (3), were injected subcutaneously under anesthesia (ketamine/xylesine) into the right hind flank of 7-8 week old female BALB/C mice. Tumors were allowed to grow to an estimated volume of mm 3, mice were randomly divided into treatment (irradiated) and control (non-irradiated) groups. Mice in the treatment groups were subjected under anesthesia (ketamine/xylazine) to singlefraction irradiation (14 Gy) to the hind flanks. Mice in the treatment groups were subjected to infusion (50 l) of either HIL-6 protein (50 ng) or carrier solution (10 g/ml BSA in normal saline) to the submandibular gland hours prior to irradiation, as described in Methods. Tumor dimensions were measured by caliper and volume was estimated using the formula volume = (length x width x width) (0.5). Experiments were terminated when tumors in the control group reached ~600 mm 3 estimated volume. References Sited 1. Nechemia-Arbely, Y., Barkan, D., Pizov, G., Shriki, A., Rose-John, S., Galun, E., and Axelrod, J.H IL-6/IL-6R axis plays a critical role in acute kidney injury. J Am Soc Nephrol 19: Katzenellenbogen, M., Mizrahi, L., Pappo, O., Klopstock, N., Olam, D., Jacob-Hirsch, J., Amariglio, N., Rechavi, G., Domany, E., Galun, E., et al Molecular mechanisms of liver carcinogenesis in the mdr2-knockout mice. Mol Cancer Res 5: Blank, M., Lavie, G., Mandel, M., and Keisari, Y Effects of photodynamic therapy with hypericin in mice bearing highly invasive solid tumors. Oncol Res 12:
Supplementary Figure 1: si-craf but not si-braf sensitizes tumor cells to radiation.
 Supplementary Figure 1: si-craf but not si-braf sensitizes tumor cells to radiation. (a) Embryonic fibroblasts isolated from wildtype (WT), BRAF -/-, or CRAF -/- mice were irradiated (6 Gy) and DNA damage
(a) Significant biological processes (upper panel) and disease biomarkers (lower panel)
 Significant biological processes (upper panel) and disease biomarkers (lower panel)") Supplementary Figure 1. Functional enrichment analyses of secretomic proteins. (a) Significant biological processes (upper panel) and disease biomarkers (lower panel) 2 involved by hrab37-mediated secretory
Supplementary Figure 1. Functional enrichment analyses of secretomic proteins. (a) Significant biological processes (upper panel) and disease biomarkers (lower panel) 2 involved by hrab37-mediated secretory
Supplementary Materials. for Garmy-Susini, et al, Integrin 4 1 signaling is required for lymphangiogenesis and tumor metastasis
 Supplementary Materials for Garmy-Susini, et al, Integrin 4 1 signaling is required for lymphangiogenesis and tumor metastasis 1 Supplementary Figure Legends Supplementary Figure 1: Integrin expression
(A) PCR primers (arrows) designed to distinguish wild type (P1+P2), targeted (P1+P2) and excised (P1+P3)14-
 PCR primers (arrows) designed to distinguish wild type (P1+P2), targeted (P1+P2) and excised (P1+P3)14-") 1 Supplemental Figure Legends Figure S1. Mammary tumors of ErbB2 KI mice with 14-3-3σ ablation have elevated ErbB2 transcript levels and cell proliferation (A) PCR primers (arrows) designed to distinguish
1 Supplemental Figure Legends Figure S1. Mammary tumors of ErbB2 KI mice with 14-3-3σ ablation have elevated ErbB2 transcript levels and cell proliferation (A) PCR primers (arrows) designed to distinguish
Expression of acid base transporters in the kidney collecting duct in Slc2a7 -/-
 Supplemental Material Results. Expression of acid base transporters in the kidney collecting duct in Slc2a7 -/- and Slc2a7 -/- mice. The expression of AE1 in the kidney was examined in Slc26a7 KO mice.
Supplementary Table 1. The primers used for quantitative RT-PCR. Gene name Forward (5 > 3 ) Reverse (5 > 3 )
 Reverse (5 > 3 )") 770 771 Supplementary Table 1. The primers used for quantitative RT-PCR. Gene name Forward (5 > 3 ) Reverse (5 > 3 ) Human CXCL1 GCGCCCAAACCGAAGTCATA ATGGGGGATGCAGGATTGAG PF4 CCCCACTGCCCAACTGATAG TTCTTGTACAGCGGGGCTTG
770 771 Supplementary Table 1. The primers used for quantitative RT-PCR. Gene name Forward (5 > 3 ) Reverse (5 > 3 ) Human CXCL1 GCGCCCAAACCGAAGTCATA ATGGGGGATGCAGGATTGAG PF4 CCCCACTGCCCAACTGATAG TTCTTGTACAGCGGGGCTTG
SUPPLEMENTARY INFORMATION
 DOI: 10.1038/ncb2607 Figure S1 Elf5 loss promotes EMT in mammary epithelium while Elf5 overexpression inhibits TGFβ induced EMT. (a, c) Different confocal slices through the Z stack image. (b, d) 3D rendering
fl/+ KRas;Atg5 fl/+ KRas;Atg5 fl/fl KRas;Atg5 fl/fl KRas;Atg5 Supplementary Figure 1. Gene set enrichment analyses. (a) (b)
 (b)") KRas;At KRas;At KRas;At KRas;At a b Supplementary Figure 1. Gene set enrichment analyses. (a) GO gene sets (MSigDB v3. c5) enriched in KRas;Atg5 fl/+ as compared to KRas;Atg5 fl/fl tumors using gene set
KRas;At KRas;At KRas;At KRas;At a b Supplementary Figure 1. Gene set enrichment analyses. (a) GO gene sets (MSigDB v3. c5) enriched in KRas;Atg5 fl/+ as compared to KRas;Atg5 fl/fl tumors using gene set
Supplemental Table 1. Primers used for RT-PCR analysis of inflammatory cytokines Gene Primer Sequence
 Supplemental Table 1. Primers used for RT-PCR analysis of inflammatory cytokines Gene Primer Sequence IL-1α Forward primer 5 -CAAGATGGCCAAAGTTCGTGAC-3' Reverse primer 5 -GTCTCATGAAGTGAGCCATAGC-3 IL-1β
(A) RT-PCR for components of the Shh/Gli pathway in normal fetus cell (MRC-5) and a
 RT-PCR for components of the Shh/Gli pathway in normal fetus cell (MRC-5) and a") Supplementary figure legends Supplementary Figure 1. Expression of Shh signaling components in a panel of gastric cancer. (A) RT-PCR for components of the Shh/Gli pathway in normal fetus cell (MRC-5) and
Supplementary figure legends Supplementary Figure 1. Expression of Shh signaling components in a panel of gastric cancer. (A) RT-PCR for components of the Shh/Gli pathway in normal fetus cell (MRC-5) and
SUPPLEMENTARY INFORMATION
 SUPPLEMENTARY INFORMATION FOR Liver X Receptor α mediates hepatic triglyceride accumulation through upregulation of G0/G1 Switch Gene 2 (G0S2) expression I: SUPPLEMENTARY METHODS II: SUPPLEMENTARY FIGURES
marker. DAPI labels nuclei. Flies were 20 days old. Scale bar is 5 µm. Ctrl is
 Supplementary Figure 1. (a) Nos is detected in glial cells in both control and GFAP R79H transgenic flies (arrows), but not in deletion mutant Nos Δ15 animals. Repo is a glial cell marker. DAPI labels
Supplementary Figures
 Supplementary Figures Supplementary Figure 1. Confirmation of Dnmt1 conditional knockout out mice. a, Representative images of sorted stem (Lin - CD49f high CD24 + ), luminal (Lin - CD49f low CD24 + )
Supplemental Information. Otic Mesenchyme Cells Regulate. Spiral Ganglion Axon Fasciculation. through a Pou3f4/EphA4 Signaling Pathway
 Neuron, Volume 73 Supplemental Information Otic Mesenchyme Cells Regulate Spiral Ganglion Axon Fasciculation through a Pou3f4/EphA4 Signaling Pathway Thomas M. Coate, Steven Raft, Xiumei Zhao, Aimee K.
Supplementary Figures
 Supplementary Figures Supplementary Figure 1 Characterization of stable expression of GlucB and sshbira in the CT26 cell line (a) Live cell imaging of stable CT26 cells expressing green fluorescent protein
Supplementary Figure S1: Defective heterochromatin repair in HGPS progeroid cells
 Supplementary Figure S1: Defective heterochromatin repair in HGPS progeroid cells Immunofluorescence staining of H3K9me3 and 53BP1 in PH and HGADFN003 (HG003) cells at 24 h after γ-irradiation. Scale bar,
General Laboratory methods Plasma analysis: Gene Expression Analysis: Immunoblot analysis: Immunohistochemistry:
 General Laboratory methods Plasma analysis: Plasma insulin (Mercodia, Sweden), leptin (duoset, R&D Systems Europe, Abingdon, United Kingdom), IL-6, TNFα and adiponectin levels (Quantikine kits, R&D Systems
Role of Tyk-2 in Th9 and Th17 cells in allergic asthma
 Supplementary File Role of Tyk-2 in Th9 and Th17 cells in allergic asthma Caroline Übel 1*, Anna Graser 1*, Sonja Koch 1, Ralf J. Rieker 2, Hans A. Lehr 3, Mathias Müller 4 and Susetta Finotto 1** 1 Laboratory
Supplementary Figure 1 IL-27 IL
 Tim-3 Supplementary Figure 1 Tc0 49.5 0.6 Tc1 63.5 0.84 Un 49.8 0.16 35.5 0.16 10 4 61.2 5.53 10 3 64.5 5.66 10 2 10 1 10 0 31 2.22 10 0 10 1 10 2 10 3 10 4 IL-10 28.2 1.69 IL-27 Supplementary Figure 1.
Supplementary Figure 1 IMQ-Induced Mouse Model of Psoriasis. IMQ cream was
 Supplementary Figure 1 IMQ-Induced Mouse Model of Psoriasis. IMQ cream was painted on the shaved back skin of CBL/J and BALB/c mice for consecutive days. (a, b) Phenotypic presentation of mouse back skin
Supplemental figure 1. PDGFRα is expressed dominantly by stromal cells surrounding mammary ducts and alveoli. A) IHC staining of PDGFRα in
 IHC staining of PDGFRα in") Supplemental figure 1. PDGFRα is expressed dominantly by stromal cells surrounding mammary ducts and alveoli. A) IHC staining of PDGFRα in nulliparous (left panel) and InvD6 mouse mammary glands (right
Supplemental figure 1. PDGFRα is expressed dominantly by stromal cells surrounding mammary ducts and alveoli. A) IHC staining of PDGFRα in nulliparous (left panel) and InvD6 mouse mammary glands (right
Supplemental Figure S1. RANK expression on human lung cancer cells.
 Supplemental Figure S1. RANK expression on human lung cancer cells. (A) Incidence and H-Scores of RANK expression determined from IHC in the indicated primary lung cancer subgroups. The overall expression
Supplementary Figures
 Supplementary Figures Supplementary Fig. 1. Galectin-3 is present within tumors. (A) mrna expression levels of Lgals3 (galectin-3) and Lgals8 (galectin-8) in the four classes of cell lines as determined
HIF-P4H-2 deficiency protects against skeletal muscle ischemia-reperfusion injury
 J Mol Med 2015 HIF-P4H-2 deficiency protects against skeletal muscle ischemia-reperfusion injury Sara Karsikas; Mikko Myllymäki; Minna Heikkilä; Raija Sormunen; Kari I Kivirikko; Johanna Myllyharju; Raisa
SUPPLEMENTARY FIGURES AND TABLE
 SUPPLEMENTARY FIGURES AND TABLE Supplementary Figure S1: Characterization of IRE1α mutants. A. U87-LUC cells were transduced with the lentiviral vector containing the GFP sequence (U87-LUC Tet-ON GFP).
Supplementary Figure 1. EC-specific Deletion of Snail1 Does Not Affect EC Apoptosis. (a,b) Cryo-sections of WT (a) and Snail1 LOF (b) embryos at
 Cryo-sections of WT (a) and Snail1 LOF (b) embryos at") Supplementary Figure 1. EC-specific Deletion of Snail1 Does Not Affect EC Apoptosis. (a,b) Cryo-sections of WT (a) and Snail1 LOF (b) embryos at E10.5 were double-stained for TUNEL (red) and PECAM-1 (green).
Supplementary Figure 1. EC-specific Deletion of Snail1 Does Not Affect EC Apoptosis. (a,b) Cryo-sections of WT (a) and Snail1 LOF (b) embryos at E10.5 were double-stained for TUNEL (red) and PECAM-1 (green).
(A) Cells grown in monolayer were fixed and stained for surfactant protein-c (SPC,
 Cells grown in monolayer were fixed and stained for surfactant protein-c (SPC,") Supplemental Figure Legends Figure S1. Cell line characterization (A) Cells grown in monolayer were fixed and stained for surfactant protein-c (SPC, green) and co-stained with DAPI to visualize the nuclei.
Supplemental Figure Legends Figure S1. Cell line characterization (A) Cells grown in monolayer were fixed and stained for surfactant protein-c (SPC, green) and co-stained with DAPI to visualize the nuclei.
MicroRNA sponges: competitive inhibitors of small RNAs in mammalian cells
 MicroRNA sponges: competitive inhibitors of small RNAs in mammalian cells Margaret S Ebert, Joel R Neilson & Phillip A Sharp Supplementary figures and text: Supplementary Figure 1. Effect of sponges on
Supplementary Information Titles Journal: Nature Medicine
 Supplementary Information Titles Journal: Nature Medicine Article Title: Corresponding Author: Supplementary Item & Number Supplementary Fig.1 Fig.2 Fig.3 Fig.4 Fig.5 Fig.6 Fig.7 Fig.8 Fig.9 Fig. Fig.11
Supplemental Figure 1
 Supplemental Figure 1 A S100A4: SFLGKRTDEAAFQKLMSNLDSNRDNEVDFQEYCVFLSCIAMMCNEFFEGFPDK Overlap: SF G DE KLM LD N D VDFQEY VFL I M N FF G PD S100A2: SFVGEKVDEEGLKKLMGSLDENSDQQVDFQEYAVFLALITVMCNDFFQGCPDR
Pair-fed % inkt cells 0.5. EtOH 0.0
 MATERIALS AND METHODS Histopathological analysis Liver tissue was collected 9 h post-gavage, and the tissue samples were fixed in 1% formalin and paraffin-embedded following a standard procedure. The embedded
Supplementary Table 1. Characterization of HNSCC PDX models established at MSKCC
 Supplementary Table 1. Characterization of HNSCC PDX models established at MSKCC Supplementary Table 2. Drug content and loading efficiency estimated with F-NMR and UV- Vis Supplementary Table 3. Complete
Online Appendix Material and Methods: Pancreatic RNA isolation and quantitative real-time (q)rt-pcr. Mice were fasted overnight and killed 1 hour (h)
rt-pcr. Mice were fasted overnight and killed 1 hour (h)") Online Appendix Material and Methods: Pancreatic RNA isolation and quantitative real-time (q)rt-pcr. Mice were fasted overnight and killed 1 hour (h) after feeding. A small slice (~5-1 mm 3 ) was taken
Online Appendix Material and Methods: Pancreatic RNA isolation and quantitative real-time (q)rt-pcr. Mice were fasted overnight and killed 1 hour (h) after feeding. A small slice (~5-1 mm 3 ) was taken
c Ischemia (30 min) Reperfusion (8 w) Supplementary Figure bp 300 bp Ischemia (30 min) Reperfusion (4 h) Dox 20 mg/kg i.p.
 Reperfusion (8 w) Supplementary Figure bp 300 bp Ischemia (30 min) Reperfusion (4 h) Dox 20 mg/kg i.p.") a Marker Ripk3 +/ 5 bp 3 bp b Ischemia (3 min) Reperfusion (4 h) d 2 mg/kg i.p. 1 w 5 w Sacrifice for IF size A subset for echocardiography and morphological analysis c Ischemia (3 min) Reperfusion (8
a Marker Ripk3 +/ 5 bp 3 bp b Ischemia (3 min) Reperfusion (4 h) d 2 mg/kg i.p. 1 w 5 w Sacrifice for IF size A subset for echocardiography and morphological analysis c Ischemia (3 min) Reperfusion (8
The toll-like receptor 4 ligands Mrp8 and Mrp14 play a critical role in the development of autoreactive CD8 + T cells
 1 SUPPLEMENTARY INFORMATION The toll-like receptor 4 ligands Mrp8 and Mrp14 play a critical role in the development of autoreactive CD8 + T cells Karin Loser 1,2,6, Thomas Vogl 2,3, Maik Voskort 1, Aloys
Supplementary Figure 1. mrna expression of chitinase and chitinase-like protein in splenic immune cells. Each splenic immune cell population was
 Supplementary Figure 1. mrna expression of chitinase and chitinase-like protein in splenic immune cells. Each splenic immune cell population was sorted by FACS. Surface markers for sorting were CD11c +
Supporting Information
 Supporting Information Franco et al. 10.1073/pnas.1015557108 SI Materials and Methods Drug Administration. PD352901 was dissolved in 0.5% (wt/vol) hydroxyl-propyl-methylcellulose, 0.2% (vol/vol) Tween
SUPPLEMENTARY INFORMATION
 Supplemental Figure 1. Furin is efficiently deleted in CD4 + and CD8 + T cells. a, Western blot for furin and actin proteins in CD4cre-fur f/f and fur f/f Th1 cells. Wild-type and furin-deficient CD4 +
Supplementary Figure 1. IDH1 and IDH2 mutation site sequences on WHO grade III
 Supplementary Materials: Supplementary Figure 1. IDH1 and IDH2 mutation site sequences on WHO grade III patient samples. Genomic DNA samples extracted from punch biopsies from either FFPE or frozen tumor
Sestrin2 and BNIP3 (Bcl-2/adenovirus E1B 19kDa-interacting. protein3) regulate autophagy and mitophagy in renal tubular cells in. acute kidney injury
 regulate autophagy and mitophagy in renal tubular cells in. acute kidney injury") Sestrin2 and BNIP3 (Bcl-2/adenovirus E1B 19kDa-interacting protein3) regulate autophagy and mitophagy in renal tubular cells in acute kidney injury by Masayuki Ishihara 1, Madoka Urushido 2, Kazu Hamada
Sestrin2 and BNIP3 (Bcl-2/adenovirus E1B 19kDa-interacting protein3) regulate autophagy and mitophagy in renal tubular cells in acute kidney injury by Masayuki Ishihara 1, Madoka Urushido 2, Kazu Hamada
SHREE ET AL, SUPPLEMENTAL MATERIALS. (A) Workflow for tumor cell line derivation and orthotopic implantation.
 Workflow for tumor cell line derivation and orthotopic implantation.") SHREE ET AL, SUPPLEMENTAL MATERIALS SUPPLEMENTAL FIGURE AND TABLE LEGENDS Supplemental Figure 1. Derivation and characterization of TS1-TGL and TS2-TGL PyMT cell lines and development of an orthotopic
SHREE ET AL, SUPPLEMENTAL MATERIALS SUPPLEMENTAL FIGURE AND TABLE LEGENDS Supplemental Figure 1. Derivation and characterization of TS1-TGL and TS2-TGL PyMT cell lines and development of an orthotopic
Supplementary fig. 1. Crystals induce necroptosis does not involve caspases, TNF receptor or NLRP3. A. Mouse tubular epithelial cells were pretreated
 Supplementary fig. 1. Crystals induce necroptosis does not involve caspases, TNF receptor or NLRP3. A. Mouse tubular epithelial cells were pretreated with zvad-fmk (10µM) and exposed to calcium oxalate
Nature Medicine doi: /nm.3957
 Supplementary Fig. 1. p38 alternative activation, IL-21 expression, and T helper cell transcription factors in PDAC tissue. (a) Tissue microarrays of pancreatic tissue from 192 patients with pancreatic
Supplemental Information
 Supplemental Information Tobacco-specific Carcinogen Induces DNA Methyltransferases 1 Accumulation through AKT/GSK3β/βTrCP/hnRNP-U in Mice and Lung Cancer patients Ruo-Kai Lin, 1 Yi-Shuan Hsieh, 2 Pinpin
Supplementary Figure 1: Hsp60 / IEC mice are embryonically lethal (A) Light microscopic pictures show mouse embryos at developmental stage E12.
 Light microscopic pictures show mouse embryos at developmental stage E12.") Supplementary Figure 1: Hsp60 / IEC mice are embryonically lethal (A) Light microscopic pictures show mouse embryos at developmental stage E12.5 and E13.5 prepared from uteri of dams and subsequently genotyped.
Supplementary Figure 1: Hsp60 / IEC mice are embryonically lethal (A) Light microscopic pictures show mouse embryos at developmental stage E12.5 and E13.5 prepared from uteri of dams and subsequently genotyped.
SOPten flox/flox (KO) Pten flox/flox (WT) flox allele 6.0 kb. Pten. Actin. ! allele 2.3 kb. Supplementary Figure S1. Yanagi, et al.
 Pten flox/flox (WT) flox allele 6.0 kb. Pten. Actin. ! allele 2.3 kb. Supplementary Figure S1. Yanagi, et al.") s1 A Pten flox/flox () SOPten flox/flox () flox allele 6. kb B Pten flox/flox () SOPten flox/flox () Pten Actin! allele 2.3 kb Supplementary Figure S1. Yanagi, et al. A B BrdU BrdU positive cells ( ) 3
s1 A Pten flox/flox () SOPten flox/flox () flox allele 6. kb B Pten flox/flox () SOPten flox/flox () Pten Actin! allele 2.3 kb Supplementary Figure S1. Yanagi, et al. A B BrdU BrdU positive cells ( ) 3
Supplementary Figure 1: GFAP positive nerves in patients with adenocarcinoma of
 SUPPLEMENTARY FIGURES AND MOVIE LEGENDS Supplementary Figure 1: GFAP positive nerves in patients with adenocarcinoma of the pancreas. (A) Images of nerves stained for GFAP (green), S100 (red) and DAPI
Supplementary Table 1. List of primers used in this study
 Supplementary Table 1. List of primers used in this study Gene Forward primer Reverse primer Rat Met 5 -aggtcgcttcatgcaggt-3 5 -tccggagacacaggatgg-3 Rat Runx1 5 -cctccttgaaccactccact-3 5 -ctggatctgcctggcatc-3
Supplementary Figure 1
 Supplementary Figure 1 The average sigmoid parametric curves of capillary dilation time courses and average time to 50% peak capillary diameter dilation computed from individual capillary responses averaged
Expanded View Figures
 Shao-Ming Shen et al Role of I in MT of cancers MO reports xpanded View igures igure V1. nalysis of the expression of I isoforms in cancer cells and their interaction with PTN. RT PR detection of Ish and
L1 on PyMT tumor cells but Py117 cells are more responsive to IFN-γ. (A) Flow
 Flow") A MHCI B PD-L1 Fold expression 8 6 4 2 Fold expression 3 2 1 No tx 1Gy 2Gy IFN Py117 Py117 Supplementary Figure 1. Radiation and IFN-γ enhance MHCI expression and PD- L1 on PyMT tumor cells but Py117 cells
A MHCI B PD-L1 Fold expression 8 6 4 2 Fold expression 3 2 1 No tx 1Gy 2Gy IFN Py117 Py117 Supplementary Figure 1. Radiation and IFN-γ enhance MHCI expression and PD- L1 on PyMT tumor cells but Py117 cells
MATERIALS AND METHODS. Neutralizing antibodies specific to mouse Dll1, Dll4, J1 and J2 were prepared as described. 1,2 All
 MATERIALS AND METHODS Antibodies (Abs), flow cytometry analysis and cell lines Neutralizing antibodies specific to mouse Dll1, Dll4, J1 and J2 were prepared as described. 1,2 All other antibodies used
Programmed necrosis, not apoptosis, is a key mediator of cell loss and DAMP-mediated inflammation in dsrna-induced retinal degeneration
 Programmed necrosis, not apoptosis, is a key mediator of cell loss and DAMP-mediated inflammation in dsrna-induced retinal degeneration The Harvard community has made this article openly available. Please
RNA extraction, RT-PCR and real-time PCR. Total RNA were extracted using
 Supplementary Information Materials and Methods RNA extraction, RT-PCR and real-time PCR. Total RNA were extracted using Trizol reagent (Invitrogen,Carlsbad, CA) according to the manufacturer's instructions.
Supplementary Figure 1. Deletion of Smad3 prevents B16F10 melanoma invasion and metastasis in a mouse s.c. tumor model.
 A B16F1 s.c. Lung LN Distant lymph nodes Colon B B16F1 s.c. Supplementary Figure 1. Deletion of Smad3 prevents B16F1 melanoma invasion and metastasis in a mouse s.c. tumor model. Highly invasive growth
Supplementary Figure 1. Genotyping strategies for Mcm3 +/+, Mcm3 +/Lox and Mcm3 +/- mice and luciferase activity in Mcm3 +/Lox mice. A.
 Supplementary Figure 1. Genotyping strategies for Mcm3 +/+, Mcm3 +/Lox and Mcm3 +/- mice and luciferase activity in Mcm3 +/Lox mice. A. Upper part, three-primer PCR strategy at the Mcm3 locus yielding
SUPPLEMENTARY FIGURES
 SUPPLEMENTARY FIGURES 1 Supplementary Figure 1, Adult hippocampal QNPs and TAPs uniformly express REST a-b) Confocal images of adult hippocampal mouse sections showing GFAP (green), Sox2 (red), and REST
Supplemental Data. TGF-β-mediated mir-181a expression promotes breast cancer metastasis by targeting Bim.
 Supplemental Data TGF-β-mediated mir-181a expression promotes breast cancer metastasis by targeting Bim. Molly A. Taylor 1, Khalid Sossey-Alaoui 2, Cheryl L. Thompson 3, David Danielpour 4, and William
Figure S1A. Blood glucose levels in mice after glucose injection
 ## Figure S1A. Blood glucose levels in mice after glucose injection Blood glucose (mm/l) 25 2 15 1 5 # 15 3 6 3+3 Time after glucose injection (min) # Figure S1B. α-kg levels in mouse livers after glucose
Supplemental Figure 1. Western blot analysis indicated that MIF was detected in the fractions of
 Supplemental Figure Legends Supplemental Figure 1. Western blot analysis indicated that was detected in the fractions of plasma membrane and cytosol but not in nuclear fraction isolated from Pkd1 null
SUPPLEMENTARY INFORMATION
 1. Supplementary Figures and Legends Supplementary Fig. 1. S1P-mediated transcriptional regulation of integrins expressed in OP/monocytoid cells. Real-time quantitative PCR analyses of mrna for two integrins,
Nature Neuroscience: doi: /nn Supplementary Figure 1
 Supplementary Figure 1 Quantification of myelin fragments in the aging brain (a) Electron microscopy on corpus callosum is shown for a 18-month-old wild type mice. Myelin fragments (arrows) were detected
Supplementary Fig. 1 p38 MAPK negatively regulates DC differentiation. (a) Western blot analysis of p38 isoform expression in BM cells, immature DCs
 Western blot analysis of p38 isoform expression in BM cells, immature DCs") Supplementary Fig. 1 p38 MAPK negatively regulates DC differentiation. (a) Western blot analysis of p38 isoform expression in BM cells, immature DCs (idcs) and mature DCs (mdcs). A myeloma cell line expressing
Supplementary Fig. 1 p38 MAPK negatively regulates DC differentiation. (a) Western blot analysis of p38 isoform expression in BM cells, immature DCs (idcs) and mature DCs (mdcs). A myeloma cell line expressing
Supplementary Figure S1. Effect of Glucose on Energy Balance in WT and KHK A/C KO
 Supplementary Figure S1. Effect of Glucose on Energy Balance in WT and KHK A/C KO Mice. WT mice and KHK-A/C KO mice were provided drinking water containing 10% glucose or tap water with normal chow ad
Supporting Information Table of Contents
 Supporting Information Table of Contents Supporting Information Figure 1 Page 2 Supporting Information Figure 2 Page 4 Supporting Information Figure 3 Page 5 Supporting Information Figure 4 Page 6 Supporting
Supplementary Figure 1. Baf60c and baf180 are induced during cardiac regeneration in zebrafish. RNA in situ hybridization was performed on paraffin
 Supplementary Figure 1. Baf60c and baf180 are induced during cardiac regeneration in zebrafish. RNA in situ hybridization was performed on paraffin sections from sham-operated adult hearts (a and i) and
Supplementary Information. Detection and delineation of oral cancer with a PARP1 targeted optical imaging agent
 Supplementary Information Detection and delineation of oral cancer with a PARP1 targeted optical imaging agent Authors: Susanne Kossatz a, Christian Brand a, Stanley Gutiontov b, Jonathan T.C. Liu c, Nancy
BRaf V600E cooperates with Pten silencing to elicit metastatic melanoma (Nature Genetics Supplementary Information)
") BRaf V600E cooperates with Pten silencing to elicit metastatic melanoma (Nature Genetics Supplementary Information) David Dankort, David P. Curley, Robert A. Cartlidge, Betsy Nelson, Anthony N. Karnezis,
BRaf V600E cooperates with Pten silencing to elicit metastatic melanoma (Nature Genetics Supplementary Information) David Dankort, David P. Curley, Robert A. Cartlidge, Betsy Nelson, Anthony N. Karnezis,
ANGPTL2 increases bone metastasis of breast cancer cells through. Tetsuro Masuda, Motoyoshi Endo, Yutaka Yamamoto, Haruki Odagiri, Tsuyoshi
 Masuda et al. Supplementary information for ANGPTL2 increases bone metastasis of breast cancer cells through enhancing CXCR4 signaling Tetsuro Masuda, Motoyoshi Endo, Yutaka Yamamoto, Haruki Odagiri, Tsuyoshi
Supplementary Figure S1. Flow cytometric analysis of the expression of Thy1 in NH cells. Flow cytometric analysis of the expression of T1/ST2 and
 Supplementary Figure S1. Flow cytometric analysis of the expression of Thy1 in NH cells. Flow cytometric analysis of the expression of T1/ST2 and Thy1 in NH cells derived from the lungs of naïve mice.
SUPPLEMENTARY LEGENDS...
 TABLE OF CONTENTS SUPPLEMENTARY LEGENDS... 2 11 MOVIE S1... 2 FIGURE S1 LEGEND... 3 FIGURE S2 LEGEND... 4 FIGURE S3 LEGEND... 5 FIGURE S4 LEGEND... 6 FIGURE S5 LEGEND... 7 FIGURE S6 LEGEND... 8 FIGURE
Supplementary Figure 1.TRIM33 binds β-catenin in the nucleus. a & b, Co-IP of endogenous TRIM33 with β-catenin in HT-29 cells (a) and HEK 293T cells
 and HEK 293T cells") Supplementary Figure 1.TRIM33 binds β-catenin in the nucleus. a & b, Co-IP of endogenous TRIM33 with β-catenin in HT-29 cells (a) and HEK 293T cells (b). TRIM33 was immunoprecipitated, and the amount of
Supplementary Figure 1.TRIM33 binds β-catenin in the nucleus. a & b, Co-IP of endogenous TRIM33 with β-catenin in HT-29 cells (a) and HEK 293T cells (b). TRIM33 was immunoprecipitated, and the amount of
Supplementary Fig. 1: ATM is phosphorylated in HER2 breast cancer cell lines. (A) ATM is phosphorylated in SKBR3 cells depending on ATM and HER2
 ATM is phosphorylated in SKBR3 cells depending on ATM and HER2") Supplementary Fig. 1: ATM is phosphorylated in HER2 breast cancer cell lines. (A) ATM is phosphorylated in SKBR3 cells depending on ATM and HER2 activity. Upper panel: Representative histograms for FACS
Supplementary Fig. 1: ATM is phosphorylated in HER2 breast cancer cell lines. (A) ATM is phosphorylated in SKBR3 cells depending on ATM and HER2 activity. Upper panel: Representative histograms for FACS
(a) Schematic diagram of the FS mutation of UVRAG in exon 8 containing the highly instable
 Schematic diagram of the FS mutation of UVRAG in exon 8 containing the highly instable") Supplementary Figure 1. Frameshift (FS) mutation in UVRAG. (a) Schematic diagram of the FS mutation of UVRAG in exon 8 containing the highly instable A 10 DNA repeat, generating a premature stop codon
Supplementary Figure 1. Frameshift (FS) mutation in UVRAG. (a) Schematic diagram of the FS mutation of UVRAG in exon 8 containing the highly instable A 10 DNA repeat, generating a premature stop codon
Supplementary Figure 1: Fn14 is upregulated in the epidermis and dermis of mice
 Supplementary Figure 1: Fn14 is upregulated in the epidermis and dermis of mice undergoing AD- and psoriasis-like disease. Immunofluorescence staining for Fn14 (green) and DAPI (blue) in skin of naïve
Supplemental Figure 1
 Supplemental Figure 1 1a 1c PD-1 MFI fold change 6 5 4 3 2 1 IL-1α IL-2 IL-4 IL-6 IL-1 IL-12 IL-13 IL-15 IL-17 IL-18 IL-21 IL-23 IFN-α Mut Human PD-1 promoter SBE-D 5 -GTCTG- -1.2kb SBE-P -CAGAC- -1.kb
Supplementary Figure 1
 Supplementary Figure 1 Supplementary Fig. 1: Quality assessment of formalin-fixed paraffin-embedded (FFPE)-derived DNA and nuclei. (a) Multiplex PCR analysis of unrepaired and repaired bulk FFPE gdna from
Patnaik SK, et al. MicroRNAs to accurately histotype NSCLC biopsies
 Patnaik SK, et al. MicroRNAs to accurately histotype NSCLC biopsies. 2014. Supplemental Digital Content 1. Appendix 1. External data-sets used for associating microrna expression with lung squamous cell
A Hepatocyte Growth Factor Receptor (Met) Insulin Receptor hybrid governs hepatic glucose metabolism SUPPLEMENTARY FIGURES, LEGENDS AND METHODS
 Insulin Receptor hybrid governs hepatic glucose metabolism SUPPLEMENTARY FIGURES, LEGENDS AND METHODS") A Hepatocyte Growth Factor Receptor (Met) Insulin Receptor hybrid governs hepatic glucose metabolism Arlee Fafalios, Jihong Ma, Xinping Tan, John Stoops, Jianhua Luo, Marie C. DeFrances and Reza Zarnegar
A Hepatocyte Growth Factor Receptor (Met) Insulin Receptor hybrid governs hepatic glucose metabolism Arlee Fafalios, Jihong Ma, Xinping Tan, John Stoops, Jianhua Luo, Marie C. DeFrances and Reza Zarnegar
Supplementary Figure S1. PTPN2 levels are not altered in proliferating CD8+ T cells. Lymph node (LN) CD8+ T cells from C57BL/6 mice were stained with
 CD8+ T cells from C57BL/6 mice were stained with") Supplementary Figure S1. PTPN2 levels are not altered in proliferating CD8+ T cells. Lymph node (LN) CD8+ T cells from C57BL/6 mice were stained with CFSE and stimulated with plate-bound α-cd3ε (10µg/ml)
Supplementary Figure S1. PTPN2 levels are not altered in proliferating CD8+ T cells. Lymph node (LN) CD8+ T cells from C57BL/6 mice were stained with CFSE and stimulated with plate-bound α-cd3ε (10µg/ml)
Macrophages form functional vascular mimicry channels in vivo. SI Figures and Legend
 Macrophages form functional vascular mimicry channels in vivo Authors: *Faith H. Barnett, *Mauricio Rosenfeld, Malcolm Wood, William Kiosses, Yoshihiko Usui, Valentina Marchetti, Edith Aguilar, and Martin
Oncolytic Adenovirus Complexes Coated with Lipids and Calcium Phosphate for Cancer Gene Therapy
 Oncolytic Adenovirus Complexes Coated with Lipids and Calcium Phosphate for Cancer Gene Therapy Jianhua Chen, Pei Gao, Sujing Yuan, Rongxin Li, Aimin Ni, Liang Chu, Li Ding, Ying Sun, Xin-Yuan Liu, Yourong
Title page. Title: MicroRNA-155 Controls Exosome Synthesis and Promotes Gemcitabine Resistance in
 Title page Title: MicroRNA- Controls Synthesis and Promotes Gemcitabine Resistance in Pancreatic Ductal Adenocarcinoma Authors Manabu Mikamori, Daisaku Yamada, Hidetoshi Eguchi, Shinichiro Hasegawa, Tomoya
Supplementary Information
 Supplementary Information TABLE S1. SUBJECT CHARACTERISTICS* Normal Control Subjects Subjects with Asthma p Value Number 23 48 Age (years) 35±10 35±10 0.75 Sex, M:F (% F) 9:12 (57) 17:26 (60) 0.76 FEV1
Nature Structural & Molecular Biology: doi: /nsmb Supplementary Figure 1. Generation and validation of mtef4-knockout mice.
 Supplementary Figure 1 Generation and validation of mtef4-knockout mice. (a) Alignment of EF4 (E. coli) with mouse, yeast and human EF4. (b) Domain structures of mouse mtef4 compared to those of EF4 (E.
COPD lungs show an attached stratified mucus layer that separate. bacteria from the epithelial cells resembling the protective colonic
 COPD lungs show an attached stratified mucus layer that separate bacteria from the epithelial cells resembling the protective colonic mucus SUPPLEMENTARY TABLES AND FIGURES Tables S1 S8, page 1 and separate
Supplementary Figure 1. A. Bar graph representing the expression levels of the 19 indicated genes in the microarrays analyses comparing human lung
 Supplementary Figure 1. A. Bar graph representing the expression levels of the 19 indicated genes in the microarrays analyses comparing human lung immortalized broncho-epithelial cells (AALE cells) expressing
Protection against doxorubicin-induced myocardial dysfunction in mice by cardiac-specific expression of carboxyl terminus of hsp70-interacting protein
 Protection against doxorubicin-induced myocardial dysfunction in mice by cardiac-specific expression of carboxyl terminus of hsp70-interacting protein Lei Wang 1, Tian-Peng Zhang 1, Yuan Zhang 2, Hai-Lian
Supporting Online Material for
 www.sciencemag.org/cgi/content/full/1171320/dc1 Supporting Online Material for A Frazzled/DCC-Dependent Transcriptional Switch Regulates Midline Axon Guidance Long Yang, David S. Garbe, Greg J. Bashaw*
Supplemental Table 1. Primer sequences for transcript analysis
 Supplemental Table 1. Primer sequences for transcript analysis Primer Sequence (5 3 ) Primer Sequence (5 3 ) Mmp2 Forward CCCGTGTGGCCCTC Mmp15 Forward CGGGGCTGGCT Reverse GCTCTCCCGGTTTC Reverse CCTGGTGTGCCTGCTC
AP VP DLP H&E. p-akt DLP
 A B AP VP DLP H&E AP AP VP DLP p-akt wild-type prostate PTEN-null prostate Supplementary Fig. 1. Targeted deletion of PTEN in prostate epithelium resulted in HG-PIN in all three lobes. (A) The anatomy
Aggregated neutrophil extracellular traps limit inflammation by degrading cytokines and chemokines
 CORRECTION NOTICE Nat. Med. doi:10.1038/nm.3547; corrected online 25 August 2014 Aggregated neutrophil extracellular traps limit inflammation by degrading cytokines and chemokines Christine Schauer, Christina
Probe. Hind III Q,!?R'!! /0!!!!D1"?R'! vector. Homologous recombination
 Supple-Zhang Page 1 Wild-type locus Targeting construct Targeted allele Exon Exon3 Exon Probe P1 P P3 FRT FRT loxp loxp neo vector amh I Homologous recombination neo P1 P P3 FLPe recombination Q,!?R'!!
Real-time imaging reveals the single steps of brain metastasis fo mation r
 Real-time imaging reveals the single steps of brain metastasis fo mation r Yvonne Kienast, Louisa von Baumgarten, Martin Fuhrmann, Wolfgang E.F. Klinkert, Roland Goldbrunner, Jochen Herms and Frank Winkler
Suppl Video: Tumor cells (green) and monocytes (white) are seeded on a confluent endothelial
 and monocytes (white) are seeded on a confluent endothelial") Supplementary Information Häuselmann et al. Monocyte induction of E-selectin-mediated endothelial activation releases VE-cadherin junctions to promote tumor cell extravasation in the metastasis cascade
Supplementary Information Häuselmann et al. Monocyte induction of E-selectin-mediated endothelial activation releases VE-cadherin junctions to promote tumor cell extravasation in the metastasis cascade
Supplementary Figure 1
 Supplementary Figure 1 AAV-GFP injection in the MEC of the mouse brain C57Bl/6 mice at 4 months of age were injected with AAV-GFP into the MEC and sacrificed at 7 days post injection (dpi). (a) Brains
Supplementary Figure 1. Double-staining immunofluorescence analysis of invasive colon and breast cancers. Specimens from invasive ductal breast
 Supplementary Figure 1. Double-staining immunofluorescence analysis of invasive colon and breast cancers. Specimens from invasive ductal breast carcinoma (a) and colon adenocarcinoma (b) were staining
SUPPLEMENTARY INFORMATION
 DOI:.38/ncb3399 a b c d FSP DAPI 5mm mm 5mm 5mm e Correspond to melanoma in-situ Figure a DCT FSP- f MITF mm mm MlanaA melanoma in-situ DCT 5mm FSP- mm mm mm mm mm g melanoma in-situ MITF MlanaA mm mm
hexahistidine tagged GRP78 devoid of the KDEL motif (GRP78-His) on SDS-PAGE. This
 on SDS-PAGE. This") SUPPLEMENTAL FIGURE LEGEND Fig. S1. Generation and characterization of. (A) Coomassie staining of soluble hexahistidine tagged GRP78 devoid of the KDEL motif (GRP78-His) on SDS-PAGE. This protein was expressed
SUPPLEMENTAL FIGURE LEGEND Fig. S1. Generation and characterization of. (A) Coomassie staining of soluble hexahistidine tagged GRP78 devoid of the KDEL motif (GRP78-His) on SDS-PAGE. This protein was expressed
SD-1 SD-1: Cathepsin B levels in TNF treated hch
 SD-1 SD-1: Cathepsin B levels in TNF treated hch. A. RNA and B. protein extracts from TNF treated and untreated human chondrocytes (hch) were analyzed via qpcr (left) and immunoblot analyses (right) for