Supplementary figures
|
|
|
- Leo Sanders
- 5 years ago
- Views:
Transcription
 4 3 2 1 MLN Cell number(1 7 ) 1 8 6 4 2 Spleen Supplementary Figure 1 No baseline value differences in immune cells from Naïve mice Peripheral blood, MLN and")
1 Supplementary figures Supplementary Figure 1 A WT -/- Percentage(%) Peripheral blood Cell number(1 6 ) MLN Cell number(1 7 ) Spleen Supplementary Figure 1 No baseline value differences in immune cells from Naïve mice Peripheral blood, MLN and spleen were collected from Naïve mice. Peripheral blood cells, MLN cells, and splenocytes were analyzed by flow cytometry after staining with antibodies for CD4,B22, CD11b, CD11c, and Gr-1. n=6 per group. Data represent means ± SEM(t-test).


.5 1 4.")


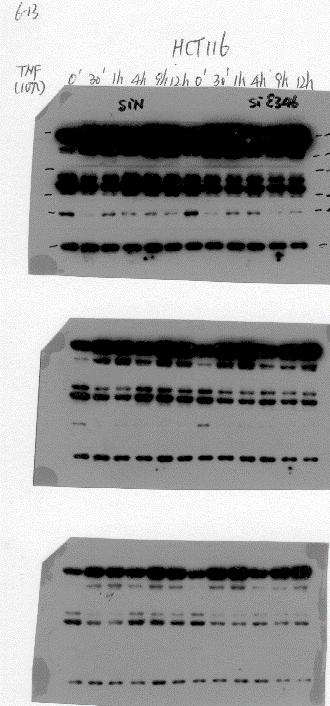
2 Supplementary Figure 2 A B C IL-8 ** h h 1h 1h IL-1β * h h 1h 1h IL-6 * h h 1h 1h CXCL5 * h h 1h 1h TNFα 3 * 2 1 h h 1h 1h HCT116 shn HCT116 shr p-p t-p p-jnk t-jnk p-erk1/2 t-erk1/2 p-p38 t-p38 HCT116 shn shr TNFα(hrs) E kda HCT116 shn shr 54 TNFα /44 IP: p IP: IgG 42/44 38 Input IL-8 promoter region D ** TNFα + + SN IL-6 ** TNFα + + SN /+1 from the transcription start site of (mus) gene Luc1 Luc2 Luc3-186/ / /-252 F
3 Supplementary Figure 2 Mutual regulation between and NFκB. (A) Total RNA was extracted from colon cancer cell line HCT116 stably knocked down (shr) and control (shn) with or without TNFα stimulation. Expression of NFκB downstream genes were analyzed by RT-PCR. Data represent means ± SEM from three independent experiments; *p <.5; **p <.1(t-test). (B) Alteration of NFκB and MAPK pathways was estimated in HCT116 shn and shr cells. (C) ChIP assays of p recruitment to IL-8 promoter were performed in HCT116 shn and HCT116 shr cells treated with TNFα for one hour. Chromatin was immunoprecipitated with anti-p Ab. Ten percent of the precipitated chromatin (input) was assayed to ensure equal loading. (D) REG γ transcripts were measured before and after 6h TNF treatment with or without pretreatment of NFκB inhibitor in colon ex vivo culture. n=4, each group, Data represent means ± SEM from three independent experiments; *p <.5; **p <.1(t-test). (E) Potential NFĸB binding sequences on promoter was analyzed using TFSEARCH software ( /TFSEARCH.html). (F) ChIP-seq analysis for NFκB/p in primary MEFs treated with LPS for 1 hr or TNF for 3 min. We note a strong peak over the promoter-proximal region of the PSME3/ gene but not neighboring genes.
.8.166621646 Trk A(Ab-496).116.")
 18 14 1 2 p location ** ** 1 TNFα + + + HCT116 shn pegfp HCT116 shr pegfp HCT116 shn pegfp- 28")
4 Supplementary Figure 3 A +/+ vs -/- Name T-test change PKD1/PKCmu(phosphorSer25) c-jun(phospho-ser63) Rac1/cdc42(phospho-Ser71) IκB-ε Androgen Receptor(Ab -) Trk A(Ab-496) B IκBβ -/- WT -/- kda C HCT116 shn HCT116 shr *** E GFP HCT116 shn HCT116 shr pegfp- pegfp pegfp - TNFα + TNFα - TNFα + TNFα - TNFα + TNFα 5 chx/hrs p DAPI D Input IP: TNFα crel p p5 kda F Nucleus/cytoplasm (fold change) p location ** ** 1 TNFα HCT116 shn pegfp HCT116 shr pegfp HCT116 shn pegfp- 28 Supplementary Figure 3 modulating NFκB signaling via regulation of (A) High-throughput proteomic screen of antibody arrays (FullMoon Biosystems) revealed differential expression of in +/+ and -/- MEF cell. (B) Expression of IκBs in colon epithelial cells isolated from WT and -/- mice following 7 days of DSS treatment. Representative of three successful times.n=7,each group. (C) mrna levels were measured in HCT116 shn and shr cell following CHX treatment. Data represent means ± SEM from three independent experiments; ***p <.1(t-test). (D) protein complexes. HCT116 shn and shr cell were stimulated with/without TNFα and immunoprecipitated (IP) with antibody followed by Western blot as indicated. P and c-rel, but not p5, could be immunoprecipitated by. Moreover, elevated in shr cell contributed to more stable /p/c-rel complex that are resistant to TNFα stimulated degradation. Representative of three experiments. (E and F) HCT116 shn/shr cells transfected with a control vector (pegfp) or (pegfp-) were stimulated with or without TNFα for 1 hour. Cell were then fixed and labeled for GFP and p. Quantitative assessment of relative p distribution (nucleus/cytoplasm) reflects relative NFκB activities in 3 independent experiments. Data represent means ± SEM, **p <.1(t-test).


 Compound depletion of and restores NFκB activity in HCT116 dkd ( and")
 Colon epithelial cells from WT, -/- and -/- / -/- mice were isolated at")

5 Supplementary Figure 4 A pg/mg 8, 4, KC ** ** ** pg/mg 2 1 MIP2α ***** ** 1 pg/mg2 CXCL5 * *** *** -/- / -/- pg/mg 2 1 IL-1β *** * ** pg/mg 1 IL-6 *** 3 ** ** 2 pg/mg 8 4 TNFα * ** * B C TNFα (1ng/ml) P-p h 1h shn shr dkd shn shr dkd kda HCT16 Supplementary Figure 4 significantly contributes to -dependent regulation of NFκB responsive genes (A) Colon levels of cytokines were assessed from supernatants of organ culture by ELISA. n=5,each group. Data represent means±sem. *p <.5; **p <.1, ***p <.1(t-test). (B) Compound depletion of and restores NFκB activity in HCT116 dkd ( and stable knock-down) cells. Representative of two experiments. (C) Colon epithelial cells from WT, -/- and -/- / -/- mice were isolated at experimental day 7, total RNA was extracted for analysis of NFkB regulated down-stream genes by real- time RT-PCR; n= 5,each group. Data represent means±sem. *p <.5; **p <.1; n.s.=no significance (t-test).


6 Supplementary Figure 5 A B 2%DSS /days 7 kda WT -/- WT -/- days 7days C * IL-6 * D AOM 2%DSS Weeks Tumor evaluation E F %Tumors WT -/- WT -/- -/- / -/- G H Tumor number/mice %Tumors WT -/- -/- / -/-
7 Supplementary Figure 5 Elevated expression in colitis is associated with colon tumorigenesis in an dependent manner (A) protein level was measured in colon epithelial cells from day or 7 days DSS treated mice by Western blot. (B) Analysis of protein level in paraffin-embedded colon sections of control (day ) or 7 days DSS treated mice by immunohistochemistry. Representative images were shown, and the experiment was successfully repeated four times. Scale bars represent 1 μm. (C) Expression of and inflammatory cytokine IL6 were elevated in colon epithelial cells collected from DSS treated mice, n=6,each group. Data shown are representative of three independent experiments and denotes means ± SEM. *p <.5. (D) Schematic diagram of the experimental design for colitis-associated tumorigenesis. Mice were injected with AOM followed by one round of 2% DSS treatment for 7 days. (E) Diameter of the tumors in WT and -/- mice was measured. n =8,each group. (F) Representative appearances of colon tumors developed in WT, -/-, and / double knockout mice after AOM and DSS induction. n =8,each group. (G) The number of colon tumors in WT, -/-, and / double knockout mice was counted after AOM and DSS induction. n= 11,WT group; n=1, -/- group; n=9,/ double knockout group. **p <.1. (H) Summary of the tumor size in mice with different genotypes.
8 Supplementary Figure 6 A P-p WT -/- kda B sin si TNFα (1ng/ml,h) P-p kda 45 T-p IκBβ Supplementary Figure 6 Compensational upregulation of other IκBs in -/- colon epithelial cells. (A) Expression of /β and p-p in colon epithelial cells isolated from WT and -/- mice following 7 days of DSS treatment. Each lane represents a sample from an individual mouse. Representative data were from three experiments. (B) Silenced with transient sirna in HCT116 cell to detect p-p and.
 LPS 15 1h 2h 4h 15 1h 2h 4h p-p T-P IκB ε p-iκb α")


 Annexin V + PI + cells(")

 BMDM were treated with LPS (1ng per ml) for indicated")


 BMDN were treated with TNFa (2ng per ml) for indicated (D)")


9 Supplementary Figure 7 A BMDM REG γ +/+ REG γ -/- B BMDM LPS (1ng/ml,h,6h) LPS 15 1h 2h 4h 15 1h 2h 4h p-p T-P IκB ε p-iκb α REG γ kda Relative mrna level IL-1β TNFα IL-6 IL12p4 IL12p7 MCP1 CXCL1 MIP2α COX2 inos C BMDN D BMDN CXCL1 MIP2α CXCL5 REG γ +/+ REG γ -/- kda TNF 2 1h 2h 4h 8h 2 1h 2h 4h 8h p-p IκB ε 45 p-iκb α 39 Relative mrna level IL-1β TNFα IL-6 43 E Annexin V + PI - cells(%) Annexin V + PI + cells(%) n.s. n.s. Supplementary Figure 7 Comparable immune cell responses in vitro and apoptotic responses in DSS-colon between WT and -/- mice (A) BMDM were treated with LPS (1ng per ml) for indicated time and analyzed for NFκB activity by Western blot. Representative images were from three successful repeats. (B) BMDM were treated with LPS(1ng per ml) for h, 6h, and analyzed for expression of inflammatory genes by Q-PCR. n=6,each group. Data represent means ± SEM from three independent experiments. *p <.5, Student s t-test. (C) BMDN were treated with TNFa (2ng per ml) for indicated time and analyzed for NFκB activity by Western blot. Representative images were from three successful repeats. (D) BMDN were treated with TNFa (2ng per ml) or LPS (1ng per ml) for 6h, and analyzed for expression of inflammatory genes by Q-PCR. n=6,each group. Data represent means ± SEM from three independent experiments. Student s t-test. (E) No significant differences in apoptotoc cell numbers in DSS treated colons between WT and REG γ -/- mice Colon epithelial cell were collected from WT and -/- mice after DSS treatment for 7 days and analyzed by flow cytometry for annexin V and propidium iodide. n=6/each group. Data represent means±sem. n.s.=none significance.


10 Supplementary Figure 8 Uncropped gel images for Figure 4 Figure 4 A Figure 4 B Figure 4 C p-p p-p38 Longer exposure p-erk1/2 t-p t-p38 Shorter exposure t-erk1/2 Figure 4 E p-jnk Figure 4 F t-jnk Figure 4 I P-p


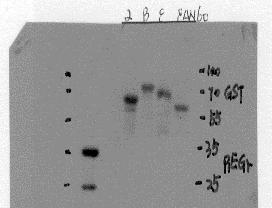


11 Supplementary Figure 9 Uncropped gel images for Figure 5A-G Figure5 A Figure5 B Figure5 C Shorter exposure 25kDa 15kDa Longer exposure Figure5 D Figure5 E Figure5 F LaminA 25kDa 1kDa 7kDa Flag-IκBs (Input) 7kDa 7kDa Flag-IκBs (Pull down) IκBβ Hsp9 1kDa 7kDa GST- (Pull down) Figure5 G p21 25kDa 15kDa GST-IκBs Shorter exposure 1kDa 7kDa Figure5 H Longer exposure 35KD 25KD


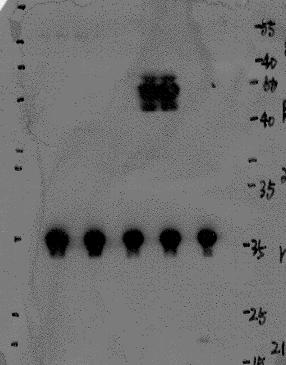
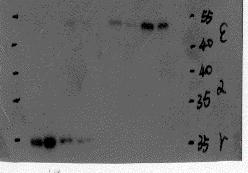
12 Supplementary Figure 1 Uncropped gel images from Figure 5H and Figure 6 Figure5 I Figure 6 G 1kDa C-Rel 7kDa p5 p P-p Supplementary Figure 2 B Supplementary Figure 3 B 7kDa P-p P-Jnk 7kDa t-p t-jnk IκBβ P-Erk P-p38 t-erk t-p38


13 Supplementary Figure 11 Supplementary Figure 3 D Supplementary Figure 4 B P-p Supplementary Figure 5 A C-Rel 7kDa P-p p5 Supplementary Figure 6 A Supplementary Figure 6 B 7kDa P-p 7kDa P-p 7kDa t-p IκBβ


14 Supplementary Figure 12 Supplementary Figure 7 A P-P 7 55 Supplementary Figure 7 C 4 35 P- IκB ε P P-P t-p
15 Supplementary Tables Supplementary Table 1 Proteins differentially regulated in +/+ and -/- MEF cells. The Full Moon arrays contain antibodies against nearly 1,3 phospho and total proteins, which involves in more than 3 different regulatory pathways. +/+ vs -/- +/+ vs -/- Name change Name change BCL-2 (Ab-7) PAK1/2/3(PhosphoSer141) Rb (Ab-68) GluR1 (Phospho-Ser863) CREB (Phospho-Ser142) MYPT1(PhosphoThr853) Vinculin (Ab-821) MER/SKY(PhosphoTyr749/Tyr681) PKC pan activation site ASK1 (Phospho-Ser966) ACC1 (Phospho-Ser8) Pyk2 (Ab-881) c-pla2 (Phospho-Ser55) ALK (Phospho-Tyr157) Smad3 (Ab-24) CDK7 (Phospho-Thr17) ATF-1 (Ab-63) CASP9 (Ab-125) Rb (Phospho-Ser795) c-jun (Ab-93) PKCdelta(PhosphoSer645) MKP-1/2 (Phospho-Ser296) c-jun (Phospho-Thr91) FER (Phospho-Tyr42) HDAC4 (Phospho-Ser632) CD227/mucin1 (Phospho-Tyr1243) Caspase3(PhosphoSer15) CDC25C (Phospho-Ser216) IL3R (Phospho-Tyr593) ACC1 (Phospho-Ser79) FER (Phospho-Tyr42) CD32 (FcgammaRIIb) (Ab-292) GSK3 alpha (Ab-21) NFkB-p (Phospho-Ser536) p53 (Phospho-Ser46) SHP-2 (Phospho-Tyr542) CASP2 (Ab-157) merlin (Ab-1) Chk1 (Phospho-Ser317) RelB (Phospho-Ser552) P7S6K (Phospho-Ser411) HDAC8 (Ab-39) DARPP-32(PhosphoThr34) PPAR-b (Phospho-Thr1457) ATPase (Phospho-Ser16) P38 MAPK (Phospho-Tyr182) XIAP (Phospho-Ser87) ITGB4 (Phospho-Tyr151) Cateninbeta(PhosphoSer3) VEGFR2 (Phospho-Tyr1214) AKT1 (Ab-38) PAK1 (Phospho-Ser24) MAP3K7/TAK1 (Ab-439) Caspase 9 (Ab-196) HSP 9-beta (Ab-226) Connexin 43 (Ab-367) HSP27 (Phospho-Ser78) NFkB-p (Phospho-Ser311) WASP (Ab-29) Cyclin E1 (Ab-77) Dok-1 (Phospho-Tyr362) p53 (Phospho-Ser392) MKP-1/2(Phospho-Ser296) NFkB-p (Phospho-Ser276)
16 +/+ vs +/+ vs -/- -/- Name change Name change CoagulationFactorIII(PhosphoSer2 9) Stathmin 1(Phospho-Ser37) Rb (Ab-68) Mst1/Mst2 (Phospho-Thr183) CD4 (Ab-433) EGFR (Phospho-Thr678) FADD (Phospho-Ser194) c-jun (Ab-239) NFkB-p1 (Phospho-Ser872) BCL-2 (Phospho-Thr56) PAK1/2/3 (Phospho-Ser141) PAK2 (Ab-192) Cyclin D3 (Phospho-Thr283) Hsp9cochaperoneCdc37(PhosphoSer13) AKT1 (Phospho-Thr72) MSK1 (Phospho-Thr581) COT (Ab-29) AKT (Phospho-Thr38) Tuberin/TSC2 (Ab-939) CDC25A (Ab-75) FADD (Phospho-Ser194) RSK1/2/3/4 (Ab-221/227/218/232) MEF2A (Ab-312) CDK2 (Phospho-Thr16) claudin 3 (Phospho-Tyr219) Synuclein alpha (Ab-133) P7S6K (Ab-229) KIT (Phospho-Tyr73) JunB (Phospho-Ser79) Shc (Phospho-Tyr349) RelB (Ab-552) ATPase (Ab-16) p21cip1 (Phospho-Thr145) KIT (Phospho-Tyr73) G3BP-1 (Ab-232) MAPKAPK2 (Phospho-Thr334) MEF2D (Phospho-Ser444) Abl1 (Ab-754/735) ATP1A1/Na+K+ ATPase1 (Ab-23) EGFR (Phospho-Thr693) Pim-1 (Ab-39).824 AMPK1 (Ab-174) MARCKS (Phospho-Ser158) Pyk2 (Phospho-Tyr579) Raf1 (Phospho-Ser338) Chk2 (Phospho-Thr68) eef2k (Ab-366) Tau (Ab-25) NFkB-p15/p5 (Ab-932) Trk A (Phospho-Tyr71) ATP-Citrate Lyase (Ab-454) Abl1 (Ab-24) VASP (Ab-157) p53 (Ab-376) ERK3 (Phospho-Ser189) CASP8 (Ab-347) BAD (Ab-112) Tau (Ab-25) Catenin beta (Phospho-Tyr4) PKD1/PKC mu (Phospho-Ser25) E-BP1 (Phospho-Thr45) c-jun (Phospho-Ser63) CDK1/CDC2 (Ab-14) Rac1/cdc42 (Phospho-Ser71) MEF2D (Phospho-Ser444) E-BP1 (Ab-) Androgen Receptor (Ab-) NFkB-p (Ab-281) Trk A (Ab-496) PLC-beta (Phospho-Ser115)
17 Supplementary table2 IκBs N-terminal sequence alignment
18 Supplementary Table 3 Sequences of primers used for Q-PCR Gene Forward (5 3 ) Reverse (5 3 ) IL-8(homo) GCATAAAGACATACTCCAAACC AAAACTTCTCCACAACCCTC IL-6(homo) AATTCGGTACATCCTCGACGG TTGGAAGGTTCAGGTTGTTTTCT IL-1β(homo) AGCTACGAATCTCCGACCAC CGTTATCCCATGTGTCGAAGAA CXCL5(homo) AGCTGCGTTGCGTTTGTTTAC TGGCGAACACTTGCAGATTAC TNFα(homo) CCTCTCTCTAATCAGCCCTCTG GAGGACCTGGGAGTAGATGAG KC(mus) ACTGCACCCAAACCGAAGTC TGGGGACACCTTTTAGCATCTT MIP2α(mus) ATCCAGAGCTTGAGTGTGACGC AAGGCAAACTTTTTGACCGCC MIP2β(mus) CATAGCCACT CTCAAGGATG AGAATGCAGGTCCTTCATCATG CXCL5(mus) GTTCCATCTCGCCATTCATGC GCGGCTATGACTGAGGAAGG IL-1β(mus) GAAATGCCACCTTTTGACAGTG TGGATGCTCTCATCAGGACAG IL-6(mus ) CTGCAAGAGACTTCCATCCAG AGTGGTATAGACAGGTCTGTTGG TNFα(mus ) CCTGTAGCCCACGTCGTAG GGGAGTAGACAAGGTACAACCC CyclinD1(mus) GCGTACCCTGACACCAATCTC CTCCTCTTCGCACTTCTGCTC Cox2(mus) CACCCTGACATAGACAGTGAAAG CTGGGTCACGTTGGATGAGG Survivin(mus) TGGCAGCTGTACCTCAAGAA AGCTGCTCAATTGACTGACG
Supplementary Information
 Supplementary Information mediates STAT3 activation at retromer-positive structures to promote colitis and colitis-associated carcinogenesis Zhang et al. a b d e g h Rel. Luc. Act. Rel. mrna Rel. mrna
Supplementary Fig. 1. GPRC5A post-transcriptionally down-regulates EGFR expression. (a) Plot of the changes in steady state mrna levels versus
 Plot of the changes in steady state mrna levels versus") Supplementary Fig. 1. GPRC5A post-transcriptionally down-regulates EGFR expression. (a) Plot of the changes in steady state mrna levels versus changes in corresponding proteins between wild type and Gprc5a-/-
Supplementary Fig. 1. GPRC5A post-transcriptionally down-regulates EGFR expression. (a) Plot of the changes in steady state mrna levels versus changes in corresponding proteins between wild type and Gprc5a-/-
RAW264.7 cells stably expressing control shrna (Con) or GSK3b-specific shrna (sh-
 or GSK3b-specific shrna (sh-") 1 a b Supplementary Figure 1. Effects of GSK3b knockdown on poly I:C-induced cytokine production. RAW264.7 cells stably expressing control shrna (Con) or GSK3b-specific shrna (sh- GSK3b) were stimulated
1 a b Supplementary Figure 1. Effects of GSK3b knockdown on poly I:C-induced cytokine production. RAW264.7 cells stably expressing control shrna (Con) or GSK3b-specific shrna (sh- GSK3b) were stimulated
Supplementary Figure 1. Normal T lymphocyte populations in Dapk -/- mice. (a) Normal thymic development in Dapk -/- mice. Thymocytes from WT and Dapk
 Normal thymic development in Dapk -/- mice. Thymocytes from WT and Dapk") Supplementary Figure 1. Normal T lymphocyte populations in Dapk -/- mice. (a) Normal thymic development in Dapk -/- mice. Thymocytes from WT and Dapk -/- mice were stained for expression of CD4 and CD8.
Supplementary Figure 1. Normal T lymphocyte populations in Dapk -/- mice. (a) Normal thymic development in Dapk -/- mice. Thymocytes from WT and Dapk -/- mice were stained for expression of CD4 and CD8.
Type of file: PDF Title of file for HTML: Supplementary Information Description: Supplementary Figures
 Type of file: PDF Title of file for HTML: Supplementary Information Description: Supplementary Figures Type of file: MOV Title of file for HTML: Supplementary Movie 1 Description: NLRP3 is moving along
Supplementary fig. 1. Crystals induce necroptosis does not involve caspases, TNF receptor or NLRP3. A. Mouse tubular epithelial cells were pretreated
 Supplementary fig. 1. Crystals induce necroptosis does not involve caspases, TNF receptor or NLRP3. A. Mouse tubular epithelial cells were pretreated with zvad-fmk (10µM) and exposed to calcium oxalate
SUPPLEMENTARY INFORMATION
 doi: 1.138/nature89 IFN- (ng ml ) 5 4 3 1 Splenocytes NS IFN- (ng ml ) 6 4 Lymph node cells NS Nfkbiz / Nfkbiz / Nfkbiz / Nfkbiz / IL- (ng ml ) 3 1 Splenocytes IL- (ng ml ) 1 8 6 4 *** ** Lymph node cells
Protein SD Units (P-value) Cluster order
 Cluster order") SUPPLEMENTAL TABLE AND FIGURES Table S1. Signature Phosphoproteome of CD22 E12 Transgenic Mouse BPL Cells. T-test vs. Other Protein SD Units (P-value) Cluster order ATPase (Ab-16) 1.41 0.000880 1 mtor
SUPPLEMENTAL TABLE AND FIGURES Table S1. Signature Phosphoproteome of CD22 E12 Transgenic Mouse BPL Cells. T-test vs. Other Protein SD Units (P-value) Cluster order ATPase (Ab-16) 1.41 0.000880 1 mtor
Supplementary Figure 1 IL-27 IL
 Tim-3 Supplementary Figure 1 Tc0 49.5 0.6 Tc1 63.5 0.84 Un 49.8 0.16 35.5 0.16 10 4 61.2 5.53 10 3 64.5 5.66 10 2 10 1 10 0 31 2.22 10 0 10 1 10 2 10 3 10 4 IL-10 28.2 1.69 IL-27 Supplementary Figure 1.
Supplementary Figure 1: si-craf but not si-braf sensitizes tumor cells to radiation.
 Supplementary Figure 1: si-craf but not si-braf sensitizes tumor cells to radiation. (a) Embryonic fibroblasts isolated from wildtype (WT), BRAF -/-, or CRAF -/- mice were irradiated (6 Gy) and DNA damage
Intracellular MHC class II molecules promote TLR-triggered innate. immune responses by maintaining Btk activation
 Intracellular MHC class II molecules promote TLR-triggered innate immune responses by maintaining Btk activation Xingguang Liu, Zhenzhen Zhan, Dong Li, Li Xu, Feng Ma, Peng Zhang, Hangping Yao and Xuetao
Supplementary Figure 1. Deletion of Smad3 prevents B16F10 melanoma invasion and metastasis in a mouse s.c. tumor model.
 A B16F1 s.c. Lung LN Distant lymph nodes Colon B B16F1 s.c. Supplementary Figure 1. Deletion of Smad3 prevents B16F1 melanoma invasion and metastasis in a mouse s.c. tumor model. Highly invasive growth
Cell isolation. Spleen and lymph nodes (axillary, inguinal) were removed from mice
 were removed from mice") Supplementary Methods: Cell isolation. Spleen and lymph nodes (axillary, inguinal) were removed from mice and gently meshed in DMEM containing 10% FBS to prepare for single cell suspensions. CD4 + CD25
Supplementary Methods: Cell isolation. Spleen and lymph nodes (axillary, inguinal) were removed from mice and gently meshed in DMEM containing 10% FBS to prepare for single cell suspensions. CD4 + CD25
blood mononuclear cells were stained with AAD, annexin, CD3, CD4, CD25, LAP and specific
 Supplementary figure legends Figure 1: Selective expression of regulatory markers on CD4 + LAP + T cells. Human peripheral blood mononuclear cells were stained with AAD, annexin, CD3, CD4, CD25, LAP and
Supplementary Figure 1. Expression of CUGBP1 in non-parenchymal liver cells treated with TGF-β
 Supplementary Figures Supplementary Figure 1. Expression of CUGBP1 in non-parenchymal liver cells treated with TGF-β and LPS. Non-parenchymal liver cells were isolated and treated with or without TGF-β
Supplemental Information
 Supplemental Information Tobacco-specific Carcinogen Induces DNA Methyltransferases 1 Accumulation through AKT/GSK3β/βTrCP/hnRNP-U in Mice and Lung Cancer patients Ruo-Kai Lin, 1 Yi-Shuan Hsieh, 2 Pinpin
Supplementary Figure 1. HOPX is hypermethylated in NPC. (a) Methylation levels of HOPX in Normal (n = 24) and NPC (n = 24) tissues from the
 Methylation levels of HOPX in Normal (n = 24) and NPC (n = 24) tissues from the") Supplementary Figure 1. HOPX is hypermethylated in NPC. (a) Methylation levels of HOPX in Normal (n = 24) and NPC (n = 24) tissues from the genome-wide methylation microarray data. Mean ± s.d.; Student
Supplementary Figure 1. HOPX is hypermethylated in NPC. (a) Methylation levels of HOPX in Normal (n = 24) and NPC (n = 24) tissues from the genome-wide methylation microarray data. Mean ± s.d.; Student
Supplementary Figure 1. Characterization of basophils after reconstitution of SCID mice
 Supplementary figure legends Supplementary Figure 1. Characterization of after reconstitution of SCID mice with CD4 + CD62L + T cells. (A-C) SCID mice (n = 6 / group) were reconstituted with 2 x 1 6 CD4
Bezzi et al., Supplementary Figure 1 *** Nature Medicine: doi: /nm Pten pc-/- ;Zbtb7a pc-/- Pten pc-/- ;Pml pc-/- Pten pc-/- ;Trp53 pc-/-
 Gr-1 Gr-1 Gr-1 Bezzi et al., Supplementary Figure 1 a Gr1-CD11b 3 months Spleen T cells 3 months Spleen B cells 3 months Spleen Macrophages 3 months Spleen 15 4 8 6 c CD11b+/Gr1+ cells [%] 1 5 b T cells
(A) RT-PCR for components of the Shh/Gli pathway in normal fetus cell (MRC-5) and a
 RT-PCR for components of the Shh/Gli pathway in normal fetus cell (MRC-5) and a") Supplementary figure legends Supplementary Figure 1. Expression of Shh signaling components in a panel of gastric cancer. (A) RT-PCR for components of the Shh/Gli pathway in normal fetus cell (MRC-5) and
Supplementary figure legends Supplementary Figure 1. Expression of Shh signaling components in a panel of gastric cancer. (A) RT-PCR for components of the Shh/Gli pathway in normal fetus cell (MRC-5) and
Supplemental Figure 1
 Supplemental Figure 1 1a 1c PD-1 MFI fold change 6 5 4 3 2 1 IL-1α IL-2 IL-4 IL-6 IL-1 IL-12 IL-13 IL-15 IL-17 IL-18 IL-21 IL-23 IFN-α Mut Human PD-1 promoter SBE-D 5 -GTCTG- -1.2kb SBE-P -CAGAC- -1.kb
Supplemental Figure 1. Signature gene expression in in vitro differentiated Th0, Th1, Th2, Th17 and Treg cells. (A) Naïve CD4 + T cells were cultured
 Naïve CD4 + T cells were cultured") Supplemental Figure 1. Signature gene expression in in vitro differentiated Th0, Th1, Th2, Th17 and Treg cells. (A) Naïve CD4 + T cells were cultured under Th0, Th1, Th2, Th17, and Treg conditions. mrna
Supplemental Figure 1. Signature gene expression in in vitro differentiated Th0, Th1, Th2, Th17 and Treg cells. (A) Naïve CD4 + T cells were cultured under Th0, Th1, Th2, Th17, and Treg conditions. mrna
Nature Medicine: doi: /nm.3922
 Title: Glucocorticoid-induced tumor necrosis factor receptor-related protein co-stimulation facilitates tumor regression by inducing IL-9-producing helper T cells Authors: Il-Kyu Kim, Byung-Seok Kim, Choong-Hyun
Supplemental Figure 1. Western blot analysis indicated that MIF was detected in the fractions of
 Supplemental Figure Legends Supplemental Figure 1. Western blot analysis indicated that was detected in the fractions of plasma membrane and cytosol but not in nuclear fraction isolated from Pkd1 null
Supplementary Figure 1. PD-L1 is glycosylated in cancer cells. (a) Western blot analysis of PD-L1 in breast cancer cells. (b) Western blot analysis
 Western blot analysis of PD-L1 in breast cancer cells. (b) Western blot analysis") Supplementary Figure 1. PD-L1 is glycosylated in cancer cells. (a) Western blot analysis of PD-L1 in breast cancer cells. (b) Western blot analysis of PD-L1 in ovarian cancer cells. (c) Western blot analysis
Supplementary Figure 1. PD-L1 is glycosylated in cancer cells. (a) Western blot analysis of PD-L1 in breast cancer cells. (b) Western blot analysis of PD-L1 in ovarian cancer cells. (c) Western blot analysis
Supplementary Figure 1.TRIM33 binds β-catenin in the nucleus. a & b, Co-IP of endogenous TRIM33 with β-catenin in HT-29 cells (a) and HEK 293T cells
 and HEK 293T cells") Supplementary Figure 1.TRIM33 binds β-catenin in the nucleus. a & b, Co-IP of endogenous TRIM33 with β-catenin in HT-29 cells (a) and HEK 293T cells (b). TRIM33 was immunoprecipitated, and the amount of
Supplementary Figure 1.TRIM33 binds β-catenin in the nucleus. a & b, Co-IP of endogenous TRIM33 with β-catenin in HT-29 cells (a) and HEK 293T cells (b). TRIM33 was immunoprecipitated, and the amount of
Nature Immunology: doi: /ni.3866
 Nature Immunology: doi:10.1038/ni.3866 Supplementary Figure 1 The effect of TIPE2 on chemotaxis. a, The expression of TIPE2 in dhl-60c, dhl-60t, TIPE2-expressing and 15/16Q-expressing dhl-60t neutrophils
Table S1. Primer sequences used for qrt-pcr. CACCATTGGCAATGAGCGGTTC AGGTCTTTGCGGATGTCCACGT ACTB AAGTCCATGTGCTGGCAGCACT ATCACCACTCCGAAGTCCGTCT LCOR
 Table S1. Primer sequences used for qrt-pcr. ACTB LCOR KLF6 CTBP1 CDKN1A CDH1 ATF3 PLAU MMP9 TFPI2 CACCATTGGCAATGAGCGGTTC AGGTCTTTGCGGATGTCCACGT AAGTCCATGTGCTGGCAGCACT ATCACCACTCCGAAGTCCGTCT CGGCTGCAGGAAAGTTTACA
Title of file for HTML: Supplementary Information Description: Supplementary Figures and Supplementary Table
 Title of file for HTML: Supplementary Information Description: Supplementary Figures and Supplementary Table Title of file for HTML: Peer Review File Description: Innate Scavenger Receptor-A regulates
a. b. c. d. e. f. g. h. i. j. k. l. m. n. o. p.
 a. b. c. d. e. f. g. h. i. j. k. l. 2.5 2 1.5 1.5 IL-1β 12 8 6 4 2 IL-1β 9 8 7 6 4 3 3 2.9 IL-1β m. n. o. p. 1.8 1.6 1.4 1.2 1.8.6.4.2 6h LPS 2 15 1 5 6h LPS 2 6h LPS 6 4 3 6h LPS Supplementary Figure
Supplementary. presence of the. (c) mrna expression. Error. in naive or
 mrna expression. Error. in naive or") Figure 1. (a) Naive CD4 + T cells were activated in the presence of the indicated cytokines for 3 days. Enpp2 mrna expression was measured by qrt-pcrhr, infected with (b, c) Naive CD4 + T cells were activated
Figure 1. (a) Naive CD4 + T cells were activated in the presence of the indicated cytokines for 3 days. Enpp2 mrna expression was measured by qrt-pcrhr, infected with (b, c) Naive CD4 + T cells were activated
SUPPLEMENTARY INFORMATION
 SUPPLEMENTARY INFORMATION doi:10.1038/nature11429 S1a 6 7 8 9 Nlrc4 allele S1b Nlrc4 +/+ Nlrc4 +/F Nlrc4 F/F 9 Targeting construct 422 bp 273 bp FRT-neo-gb-PGK-FRT 3x.STOP S1c Nlrc4 +/+ Nlrc4 F/F casp1
Supporting Information. FADD regulates NF-кB activation and promotes ubiquitination of cflip L to induce. apoptosis
 1 2 Supporting Information 3 4 5 FADD regulates NF-кB activation and promotes ubiquitination of cflip L to induce apoptosis 6 7 Kishu Ranjan and Chandramani Pathak* 8 9 Department of Cell Biology, School
Supplementary Figure 1 Role of Raf-1 in TLR2-Dectin-1-mediated cytokine expression
 Supplementary Figure 1 Supplementary Figure 1 Role of Raf-1 in TLR2-Dectin-1-mediated cytokine expression. Quantitative real-time PCR of indicated mrnas in DCs stimulated with TLR2-Dectin-1 agonist zymosan
well for 2 h at rt. Each dot represents an individual mouse and bar is the mean ±
 Supplementary data: Control DC Blimp-1 ko DC 8 6 4 2-2 IL-1β p=.5 medium 8 6 4 2 IL-2 Medium p=.16 8 6 4 2 IL-6 medium p=.3 5 4 3 2 1-1 medium IL-1 n.s. 25 2 15 1 5 IL-12(p7) p=.15 5 IFNγ p=.65 4 3 2 1
Nature Immunology doi: /ni.3268
 Supplementary Figure 1 Loss of Mst1 and Mst2 increases susceptibility to bacterial sepsis. (a) H&E staining of colon and kidney sections from wild type and Mst1 -/- Mst2 fl/fl Vav-Cre mice. Scale bar,
SUPPLEMENTARY METHODS
 SUPPLEMENTARY METHODS Histological analysis. Colonic tissues were collected from 5 parts of the middle colon on day 7 after the start of DSS treatment, and then were cut into segments, fixed with 4% paraformaldehyde,
SUPPLEMENTARY FIGURES AND TABLE
 SUPPLEMENTARY FIGURES AND TABLE Supplementary Figure S1: Characterization of IRE1α mutants. A. U87-LUC cells were transduced with the lentiviral vector containing the GFP sequence (U87-LUC Tet-ON GFP).
Supplementary Figure 1
 Supplementary Figure 1 Constitutive EGFR signaling does not activate canonical EGFR signals (a) U251EGFRInd cells with or without tetracycline exposure (24h, 1µg/ml) were treated with EGF for 15 minutes
SUPPLEMENTARY MATERIAL
 SUPPLEMENTARY MATERIAL IL-1 signaling modulates activation of STAT transcription factors to antagonize retinoic acid signaling and control the T H 17 cell it reg cell balance Rajatava Basu 1,5, Sarah K.
Supplemental Table 1. Primers used for RT-PCR analysis of inflammatory cytokines Gene Primer Sequence
 Supplemental Table 1. Primers used for RT-PCR analysis of inflammatory cytokines Gene Primer Sequence IL-1α Forward primer 5 -CAAGATGGCCAAAGTTCGTGAC-3' Reverse primer 5 -GTCTCATGAAGTGAGCCATAGC-3 IL-1β
Irf1 fold changes (D) 24h 48h. p-p65. t-p65. p-irf3. t-irf3. β-actin SKO TKO 100% 80% 60% 40% 20%
 24h 48h. p-p65. t-p65. p-irf3. t-irf3. β-actin SKO TKO 100% 80% 60% 40% 20%") Irf7 Fold changes 3 1 Irf1 fold changes 3 1 8h h 8h 8h h 8h p-p6 p-p6 t-p6 p-irf3 β-actin p-irf3 t-irf3 β-actin TKO TKO STKO (E) (F) TKO TKO % of p6 nuclear translocation % % 1% 1% % % p6 TKO % of IRF3
Irf7 Fold changes 3 1 Irf1 fold changes 3 1 8h h 8h 8h h 8h p-p6 p-p6 t-p6 p-irf3 β-actin p-irf3 t-irf3 β-actin TKO TKO STKO (E) (F) TKO TKO % of p6 nuclear translocation % % 1% 1% % % p6 TKO % of IRF3
Supplementary Information. Induction of human pancreatic beta cell replication by inhibitors of dual specificity tyrosine regulated kinase
 Journal: Nature Medicine Supplementary Information Induction of human pancreatic beta cell replication by inhibitors of dual specificity tyrosine regulated kinase 1,2 Peng Wang PhD, 1,2 Juan-Carlos Alvarez-Perez
Supplementary Figure 1. Dynamic Response of WT and mir-21 -/- mice to caerulein. (a) Representative histological sections of mouse pancreas stained
 Representative histological sections of mouse pancreas stained") Supplementary Figure 1. Dynamic Response of WT and mir-21 -/- mice to caerulein. (a) Representative histological sections of mouse pancreas stained with hematoxylin from caerulein-treated WT and mir-21
Supplementary Figure 1. Dynamic Response of WT and mir-21 -/- mice to caerulein. (a) Representative histological sections of mouse pancreas stained with hematoxylin from caerulein-treated WT and mir-21
Supplement Figure S1. Real Time PCR analysis of mrna levels of C/EBPα and PU.1 in wild type (WT) and NQO1-null (NQO1-/-) mice.
 and NQO1-null (NQO1-/-) mice.") competes with 20S proteasome for binding with C/EBP leading to its stabilization and Relative mrna levels Supplement Figure S1. Real Time PCR analysis of mrna levels of C/EBPα and PU.1 in wild type (WT)
competes with 20S proteasome for binding with C/EBP leading to its stabilization and Relative mrna levels Supplement Figure S1. Real Time PCR analysis of mrna levels of C/EBPα and PU.1 in wild type (WT)
Supplementary Figure S1: Defective heterochromatin repair in HGPS progeroid cells
 Supplementary Figure S1: Defective heterochromatin repair in HGPS progeroid cells Immunofluorescence staining of H3K9me3 and 53BP1 in PH and HGADFN003 (HG003) cells at 24 h after γ-irradiation. Scale bar,
for six pairs of mice. (b) Representative FACS analysis of absolute number of T cells (CD4 + and
 Representative FACS analysis of absolute number of T cells (CD4 + and") SUPPLEMENTARY DATA Supplementary Figure 1: Peripheral lymphoid organs of SMAR1 -/- mice have an effector memory phenotype. (a) Lymphocytes collected from MLNs and Peyer s patches (PPs) of WT and SMAR1
SUPPLEMENTARY DATA Supplementary Figure 1: Peripheral lymphoid organs of SMAR1 -/- mice have an effector memory phenotype. (a) Lymphocytes collected from MLNs and Peyer s patches (PPs) of WT and SMAR1
Supplementary Figure 1. The CagA-dependent wound healing or transwell migration of gastric cancer cell. AGS cells transfected with vector control or
 Supplementary Figure 1. The CagA-dependent wound healing or transwell migration of gastric cancer cell. AGS cells transfected with vector control or 3xflag-CagA expression vector were wounded using a pipette
The encephalitogenicity of TH17 cells is dependent on IL-1- and IL-23- induced production of the cytokine GM-CSF
 CORRECTION NOTICE Nat.Immunol. 12, 568 575 (2011) The encephalitogenicity of TH17 cells is dependent on IL-1- and IL-23- induced production of the cytokine GM-CSF Mohamed El-Behi, Bogoljub Ciric, Hong
W/T Itgam -/- F4/80 CD115. F4/80 hi CD115 + F4/80 + CD115 +
 F4/8 % in the peritoneal lavage 6 4 2 p=.15 n.s p=.76 CD115 F4/8 hi CD115 + F4/8 + CD115 + F4/8 hi CD115 + F4/8 + CD115 + MHCII MHCII Supplementary Figure S1. CD11b deficiency affects the cellular responses
File Name: Supplementary Information Description: Supplementary Figures and Supplementary Tables. File Name: Peer Review File Description:
 File Name: Supplementary Information Description: Supplementary Figures and Supplementary Tables File Name: Peer Review File Description: Primer Name Sequence (5'-3') AT ( C) RT-PCR USP21 F 5'-TTCCCATGGCTCCTTCCACATGAT-3'
Protection against doxorubicin-induced myocardial dysfunction in mice by cardiac-specific expression of carboxyl terminus of hsp70-interacting protein
 Protection against doxorubicin-induced myocardial dysfunction in mice by cardiac-specific expression of carboxyl terminus of hsp70-interacting protein Lei Wang 1, Tian-Peng Zhang 1, Yuan Zhang 2, Hai-Lian
L1 on PyMT tumor cells but Py117 cells are more responsive to IFN-γ. (A) Flow
 Flow") A MHCI B PD-L1 Fold expression 8 6 4 2 Fold expression 3 2 1 No tx 1Gy 2Gy IFN Py117 Py117 Supplementary Figure 1. Radiation and IFN-γ enhance MHCI expression and PD- L1 on PyMT tumor cells but Py117 cells
A MHCI B PD-L1 Fold expression 8 6 4 2 Fold expression 3 2 1 No tx 1Gy 2Gy IFN Py117 Py117 Supplementary Figure 1. Radiation and IFN-γ enhance MHCI expression and PD- L1 on PyMT tumor cells but Py117 cells
Title: Cytosolic DNA-mediated, STING-dependent pro-inflammatory gene. Fig. S1. STING ligands-mediated signaling response in MEFs. (A) Primary MEFs (1
 Primary MEFs (1") 1 Supporting Information 2 3 4 Title: Cytosolic DNA-mediated, STING-dependent pro-inflammatory gene induction necessitates canonical NF-κB activation through TBK1 5 6 Authors: Abe et al. 7 8 9 Supporting
1 Supporting Information 2 3 4 Title: Cytosolic DNA-mediated, STING-dependent pro-inflammatory gene induction necessitates canonical NF-κB activation through TBK1 5 6 Authors: Abe et al. 7 8 9 Supporting
SUPPLEMENTARY INFORMATION
 Supplementary Discussion The cell cycle machinery and the DNA damage response network are highly interconnected and co-regulated in assuring faithful duplication and partition of genetic materials into
Nature Neuroscience: doi: /nn Supplementary Figure 1
 Supplementary Figure 1 EGFR inhibition activates signaling pathways (a-b) EGFR inhibition activates signaling pathways (a) U251EGFR cells were treated with erlotinib (1µM) for the indicated times followed
supplementary information
 DOI: 10.1038/ncb1875 Figure S1 (a) The 79 surgical specimens from NSCLC patients were analysed by immunohistochemistry with an anti-p53 antibody and control serum (data not shown). The normal bronchi served
Integrin CD11b negatively regulates TLR-triggered inflammatory responses by. activating Syk and promoting MyD88 and TRIF degradation via cbl-b
 Integrin CD11b negatively regulates TLR-triggered inflammatory responses by activating Syk and promoting MyD88 and TRIF degradation via cbl-b Chaofeng Han, Jing Jin, Sheng Xu, Haibo Liu, Nan Li, and Xuetao
Supplementary Information
 Supplementary Information Figure S1. Int6 gene silencing efficiency. (A) Western Blot analysis of Int6 expression at different times after sirna transfection. Int6 expression is strongly silenced in Int6
Supplementary Figure 1 IMQ-Induced Mouse Model of Psoriasis. IMQ cream was
 Supplementary Figure 1 IMQ-Induced Mouse Model of Psoriasis. IMQ cream was painted on the shaved back skin of CBL/J and BALB/c mice for consecutive days. (a, b) Phenotypic presentation of mouse back skin
Stewart et al. CD36 ligands promote sterile inflammation through assembly of a TLR 4 and 6 heterodimer
 NFκB (fold induction) Stewart et al. ligands promote sterile inflammation through assembly of a TLR 4 and 6 heterodimer a. mrna (fold induction) 5 4 3 2 1 LDL oxldl Gro1a MIP-2 RANTES mrna (fold induction)
SUPPLEMENTARY INFORMATION
 DOI:.38/ncb2822 a MTC02 FAO cells EEA1 b +/+ MEFs /DAPI -/- MEFs /DAPI -/- MEFs //DAPI c HEK 293 cells WCE N M C P AKT TBC1D7 Lamin A/C EEA1 VDAC d HeLa cells WCE N M C P AKT Lamin A/C EEA1 VDAC Figure
Dox. R26-rtTA Tyr-CreERT2. any ink/arf, no rtta (n=8) ink/arf +/+ (n=5) Day 0 Day 11 Day 18 Day 28
 ink/arf +/+ (n=5) Day 0 Day 11 Day 18 Day 28") A 4OHT Dox hraf iip tumors inras ddh 2 O -RT Ink/Arf / Pten l/ l R26-lsl-rtTA Tyr-reERT2 TetO-hRAF V6E Ink/Arf / Pten / R26-rtTA Tyr-reERT2 TetO-hRAF V6E Ink/Arf / Pten / R26-rtTA Tyr-reERT2 TetO-hRAF
A 4OHT Dox hraf iip tumors inras ddh 2 O -RT Ink/Arf / Pten l/ l R26-lsl-rtTA Tyr-reERT2 TetO-hRAF V6E Ink/Arf / Pten / R26-rtTA Tyr-reERT2 TetO-hRAF V6E Ink/Arf / Pten / R26-rtTA Tyr-reERT2 TetO-hRAF
Supplementary Table 1. Characterization of HNSCC PDX models established at MSKCC
 Supplementary Table 1. Characterization of HNSCC PDX models established at MSKCC Supplementary Table 2. Drug content and loading efficiency estimated with F-NMR and UV- Vis Supplementary Table 3. Complete
p = formed with HCI-001 p = Relative # of blood vessels that formed with HCI-002 Control Bevacizumab + 17AAG Bevacizumab 17AAG
 A.. Relative # of ECs associated with HCI-001 1.4 1.2 1.0 0.8 0.6 0.4 0.2 0.0 ol b p < 0.001 Relative # of blood vessels that formed with HCI-001 1.4 1.2 1.0 0.8 0.6 0.4 0.2 0.0 l b p = 0.002 Control IHC:
Supplementary Figure 1. mrna expression of chitinase and chitinase-like protein in splenic immune cells. Each splenic immune cell population was
 Supplementary Figure 1. mrna expression of chitinase and chitinase-like protein in splenic immune cells. Each splenic immune cell population was sorted by FACS. Surface markers for sorting were CD11c +
Therapeutic effect of baicalin on experimental autoimmune encephalomyelitis. is mediated by SOCS3 regulatory pathway
 Therapeutic effect of baicalin on experimental autoimmune encephalomyelitis is mediated by SOCS3 regulatory pathway Yuan Zhang 1,2, Xing Li 1,2, Bogoljub Ciric 1, Cun-gen Ma 3, Bruno Gran 4, Abdolmohamad
S1a S1b S1c. S1d. S1f S1g S1h SUPPLEMENTARY FIGURE 1. - si sc Il17rd Il17ra bp. rig/s IL-17RD (ng) -100 IL-17RD
 -100 IL-17RD") SUPPLEMENTARY FIGURE 1 0 20 50 80 100 IL-17RD (ng) S1a S1b S1c IL-17RD β-actin kda S1d - si sc Il17rd Il17ra rig/s15-574 - 458-361 bp S1f S1g S1h S1i S1j Supplementary Figure 1. Knockdown of IL-17RD enhances
SUPPLEMENTARY FIGURE 1 0 20 50 80 100 IL-17RD (ng) S1a S1b S1c IL-17RD β-actin kda S1d - si sc Il17rd Il17ra rig/s15-574 - 458-361 bp S1f S1g S1h S1i S1j Supplementary Figure 1. Knockdown of IL-17RD enhances
Supplementary Figures
 Supplementary Figures Supplementary Figure 1 Increased ABHD5 expression in human colon cancer associated macrophages. (a) Murine peritoneal macrophages were treated with regular culture medium (Ctrl) or
Supplementary Figure 1
 Supplementary Figure 1 3 3 3 1 1 Bregma -1.6mm 3 : Bregma Ref) Http://www.mbl.org/atlas165/atlas165_start.html Bregma -.18mm Supplementary Figure 1 Schematic representation of the utilized brain slice
Supplementary Figure S I: Effects of D4F on body weight and serum lipids in apoe -/- mice.
 Supplementary Figures: Supplementary Figure S I: Effects of D4F on body weight and serum lipids in apoe -/- mice. Male apoe -/- mice were fed a high-fat diet for 8 weeks, and given PBS (model group) or
Supplementary Materials for
 www.sciencesignaling.org/cgi/content/full/7/310/ra11/dc1 Supplementary Materials for STAT3 Induction of mir-146b Forms a Feedback Loop to Inhibit the NF-κB to IL-6 Signaling Axis and STAT3-Driven Cancer
Supplementary Figure S1 Supplementary Figure S2
 Supplementary Figure S A) The blots shown in Figure B were qualified by using Gel-Pro analyzer software (Rockville, MD, USA). The ratio of LC3II/LC3I to actin was then calculated. The data are represented
293T cells were transfected with indicated expression vectors and the whole-cell extracts were subjected
 SUPPLEMENTARY INFORMATION Supplementary Figure 1. Formation of a complex between Slo1 and CRL4A CRBN E3 ligase. (a) HEK 293T cells were transfected with indicated expression vectors and the whole-cell
Supplementary Figure 1. DNA methylation of the adiponectin promoter R1, Pparg2, and Tnfa promoter in adipocytes is not affected by obesity.
 Supplementary Figure 1. DNA methylation of the adiponectin promoter R1, Pparg2, and Tnfa promoter in adipocytes is not affected by obesity. (a) Relative amounts of adiponectin, Ppar 2, C/ebp, and Tnf mrna
Supplementary Information
 Supplementary Information TABLE S1. SUBJECT CHARACTERISTICS* Normal Control Subjects Subjects with Asthma p Value Number 23 48 Age (years) 35±10 35±10 0.75 Sex, M:F (% F) 9:12 (57) 17:26 (60) 0.76 FEV1
Type of file: PDF Size of file: 0 KB Title of file for HTML: Supplementary Information Description: Supplementary Figures
 Type of file: PDF Size of file: 0 KB Title of file for HTML: Supplementary Information Description: Supplementary Figures Supplementary Figure 1 mir-128-3p is highly expressed in chemoresistant, metastatic
Supplementary Figures
 Supplementary Figures Supplementary Figure 1. NKT ligand-loaded tumour antigen-presenting B cell- and monocyte-based vaccine induces NKT, NK and CD8 T cell responses. (A) The cytokine profiles of liver
Supplementary Figure 1: Expression of NFAT proteins in Nfat2-deleted B cells (a+b) Protein expression of NFAT2 (a) and NFAT1 (b) in isolated splenic
 Protein expression of NFAT2 (a) and NFAT1 (b) in isolated splenic") Supplementary Figure 1: Expression of NFAT proteins in Nfat2-deleted B cells (a+b) Protein expression of NFAT2 (a) and NFAT1 (b) in isolated splenic B cells from WT Nfat2 +/+, TCL1 Nfat2 +/+ and TCL1 Nfat2
Supplementary Figure 1: Expression of NFAT proteins in Nfat2-deleted B cells (a+b) Protein expression of NFAT2 (a) and NFAT1 (b) in isolated splenic B cells from WT Nfat2 +/+, TCL1 Nfat2 +/+ and TCL1 Nfat2
Nature Immunology: doi: /ni Supplementary Figure 1. Cellularity of leukocytes and their progenitors in naive wild-type and Spp1 / mice.
 Supplementary Figure 1 Cellularity of leukocytes and their progenitors in naive wild-type and Spp1 / mice. (a, b) Gating strategies for differentiated cells including PMN (CD11b + Ly6G hi and CD11b + Ly6G
SUPPLEMENTARY INFORMATION
 doi:10.1038/nature12652 Supplementary Figure 1. PRDM16 interacts with endogenous EHMT1 in brown adipocytes. Immunoprecipitation of PRDM16 complex by flag antibody (M2) followed by Western blot analysis
Supplementary Material
 Supplementary Material accompanying the manuscript Interleukin 37 is a fundamental inhibitor of innate immunity Marcel F Nold, Claudia A Nold-Petry, Jarod A Zepp, Brent E Palmer, Philip Bufler & Charles
SUPPLEMENTARY INFORMATION. Supplementary Figures S1-S9. Supplementary Methods
 SUPPLEMENTARY INFORMATION SUMO1 modification of PTEN regulates tumorigenesis by controlling its association with the plasma membrane Jian Huang 1,2#, Jie Yan 1,2#, Jian Zhang 3#, Shiguo Zhu 1, Yanli Wang
Supplementary Figures
 Supplementary Figures Supplementary Figure 1. Confirmation of Dnmt1 conditional knockout out mice. a, Representative images of sorted stem (Lin - CD49f high CD24 + ), luminal (Lin - CD49f low CD24 + )
Supplementary Figure 1. Procedures for p38 activity imaging in living cells. (a) Schematic model of the p38 activity reporter. The reporter consists
 Schematic model of the p38 activity reporter. The reporter consists") Supplementary Figure 1. Procedures for p38 activity imaging in living cells. (a) Schematic model of the p38 activity reporter. The reporter consists of: (i) the YPet domain (an enhanced YFP); (ii) the
Supplementary Figure 1. Procedures for p38 activity imaging in living cells. (a) Schematic model of the p38 activity reporter. The reporter consists of: (i) the YPet domain (an enhanced YFP); (ii) the
SUPPLEMENTARY INFORMATION
 doi:1.138/nature1554 a TNF-α + in CD4 + cells [%] 1 GF SPF 6 b IL-1 + in CD4 + cells [%] 5 4 3 2 1 Supplementary Figure 1. Effect of microbiota on cytokine profiles of T cells in GALT. Frequencies of TNF-α
SUPPLEMENTARY INFORMATION
 DOI: 1.138/ncb3355 a S1A8 + cells/ total.1.8.6.4.2 b S1A8/?-Actin c % T-cell proliferation 3 25 2 15 1 5 T cells Supplementary Figure 1 Inter-tumoral heterogeneity of MDSC accumulation in mammary tumor
Supplementary information to: Mechanism of lipopolysaccharide-induced skin edema formation in the mouse
 Supplementary information to: Mechanism of lipopolysaccharide-induced skin edema formation in the mouse Ivan Zanoni*, Renato Ostuni*, Simona Barresi, Marco Di Gioia, Achille Broggi, Barbara Costa, Roberta
A Hepatocyte Growth Factor Receptor (Met) Insulin Receptor hybrid governs hepatic glucose metabolism SUPPLEMENTARY FIGURES, LEGENDS AND METHODS
 Insulin Receptor hybrid governs hepatic glucose metabolism SUPPLEMENTARY FIGURES, LEGENDS AND METHODS") A Hepatocyte Growth Factor Receptor (Met) Insulin Receptor hybrid governs hepatic glucose metabolism Arlee Fafalios, Jihong Ma, Xinping Tan, John Stoops, Jianhua Luo, Marie C. DeFrances and Reza Zarnegar
A Hepatocyte Growth Factor Receptor (Met) Insulin Receptor hybrid governs hepatic glucose metabolism Arlee Fafalios, Jihong Ma, Xinping Tan, John Stoops, Jianhua Luo, Marie C. DeFrances and Reza Zarnegar
Pro-apoptotic signalling through Toll-like receptor 3 involves TRIF-dependent
 Pro-apoptotic signalling through Toll-like receptor 3 involves TRIF-dependent activation of caspase-8 and is under the control of inhibitor of apoptosis proteins in melanoma cells Arnim Weber, Zofia Kirejczyk,
Gallic acid prevents isoproterenol-induced cardiac hypertrophy and fibrosis through regulation of JNK2 signaling and Smad3 binding activity
 Gallic acid prevents isoproterenol-induced cardiac hypertrophy and fibrosis through regulation of JNK2 signaling and Smad3 binding activity Yuhee Ryu 1,+, Li Jin 1,2+, Hae Jin Kee 1,, Zhe Hao Piao 3, Jae
Supplementary Figure 1
 Supplementary Figure 1 YAP negatively regulates IFN- signaling. (a) Immunoblot analysis of Yap knockdown efficiency with sh-yap (#1 to #4 independent constructs) in Raw264.7 cells. (b) IFN- -Luc and PRDs
Supplementary Figure 1 CD4 + T cells from PKC-θ null mice are defective in NF-κB activation during T cell receptor signaling. CD4 + T cells were
 Supplementary Figure 1 CD4 + T cells from PKC-θ null mice are defective in NF-κB activation during T cell receptor signaling. CD4 + T cells were isolated from wild type (PKC-θ- WT) or PKC-θ null (PKC-θ-KO)
ECM1 controls T H 2 cell egress from lymph nodes through re-expression of S1P 1
 ZH, Li et al, page 1 ECM1 controls T H 2 cell egress from lymph nodes through re-expression of S1P 1 Zhenhu Li 1,4,Yuan Zhang 1,4, Zhiduo Liu 1, Xiaodong Wu 1, Yuhan Zheng 1, Zhiyun Tao 1, Kairui Mao 1,
SUPPLEMENTARY INFORMATION
 doi:10.1038/nature12215 Supplementary Figure 1. The effects of full and dissociated GR agonists in supporting BFU-E self-renewal divisions. BFU-Es were cultured in self-renewal medium with indicated GR
Supplemental Figure 1.
 antifas CD40L 0 15 30 60 0 15 30 60 min piκbα IκBα p38 Supplemental Figure 1. CD40L and antifas stimulation induces NFkB activation. BMDM were stimulated with CD40L (1ug/ml) or antifas (10ug/ml). Cell
Supplementary Materials for
 www.sciencesignaling.org/cgi/content/full/4/199/ra75/dc1 Supplementary Materials for Signaling by the Matrix Proteoglycan Decorin Controls Inflammation and Cancer Through PDCD4 and MicroRNA-21 Rosetta
NLRX1: 5 -GCTCCATGGCTTAGAGCATC-3 (forward) 5 -AACTCCTCCTCCGTCCTGAT-3 (reverse) β-actin
 5 -AACTCCTCCTCCGTCCTGAT-3 (reverse) β-actin") NLRX1 β-actin 1 2 3 4 5 6 1 2 3 4 5 6 NLRX1 (667 bp) β-actin (523 bp) Supplementary Figure 1: Expression of NLRX1 in human cell lines. 1: HeLa, 2: HEK293T, 3: MCF-7, 4:Ramos, 5:Jurkat, 6: THP1. The following
NLRX1 β-actin 1 2 3 4 5 6 1 2 3 4 5 6 NLRX1 (667 bp) β-actin (523 bp) Supplementary Figure 1: Expression of NLRX1 in human cell lines. 1: HeLa, 2: HEK293T, 3: MCF-7, 4:Ramos, 5:Jurkat, 6: THP1. The following
Supplemental Materials for. Effects of sphingosine-1-phosphate receptor 1 phosphorylation in response to. FTY720 during neuroinflammation
 Supplemental Materials for Effects of sphingosine-1-phosphate receptor 1 phosphorylation in response to FTY7 during neuroinflammation This file includes: Supplemental Table 1. EAE clinical parameters of
Supplemental Figure 1. (A) Western blot for the expression of RIPK1 in HK-2 cells treated with or without LPS (1 µg/ml) for indicated times.
 Western blot for the expression of RIPK1 in HK-2 cells treated with or without LPS (1 µg/ml) for indicated times.") Supplemental Figure 1. (A) Western blot for the expression of RIPK1 in HK-2 cells treated with or without LPS (1 µg/ml) for indicated times. Western blots shown are representative results from 3 independent
Supplemental Figure 1. (A) Western blot for the expression of RIPK1 in HK-2 cells treated with or without LPS (1 µg/ml) for indicated times. Western blots shown are representative results from 3 independent