Excessive fatty acid oxidation induces muscle atrophy in cancer cachexia
|
|
|
- Todd Shaw
- 5 years ago
- Views:
Transcription
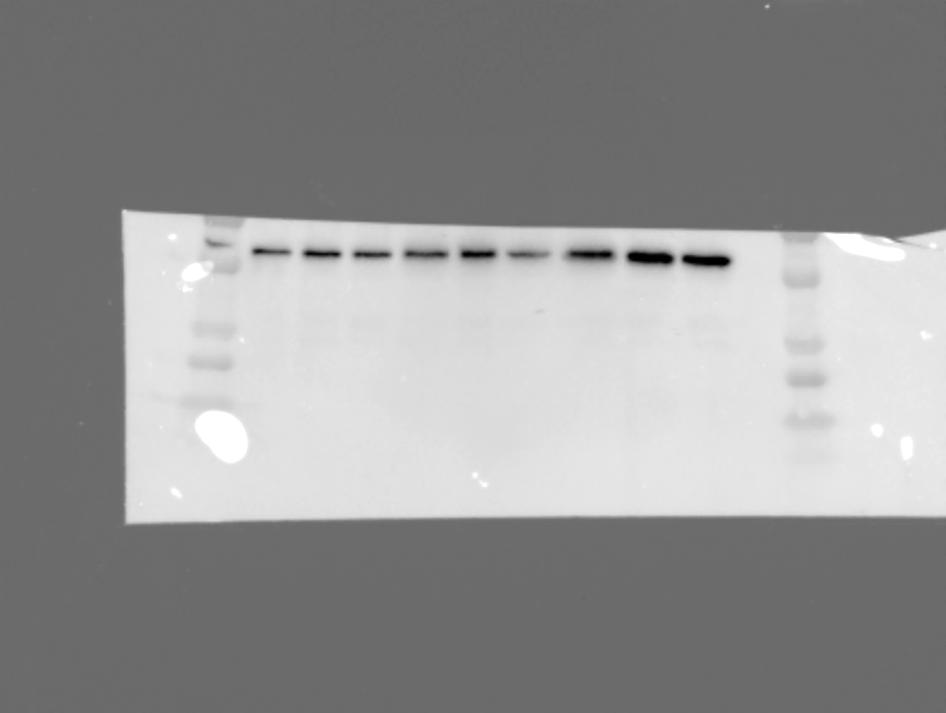
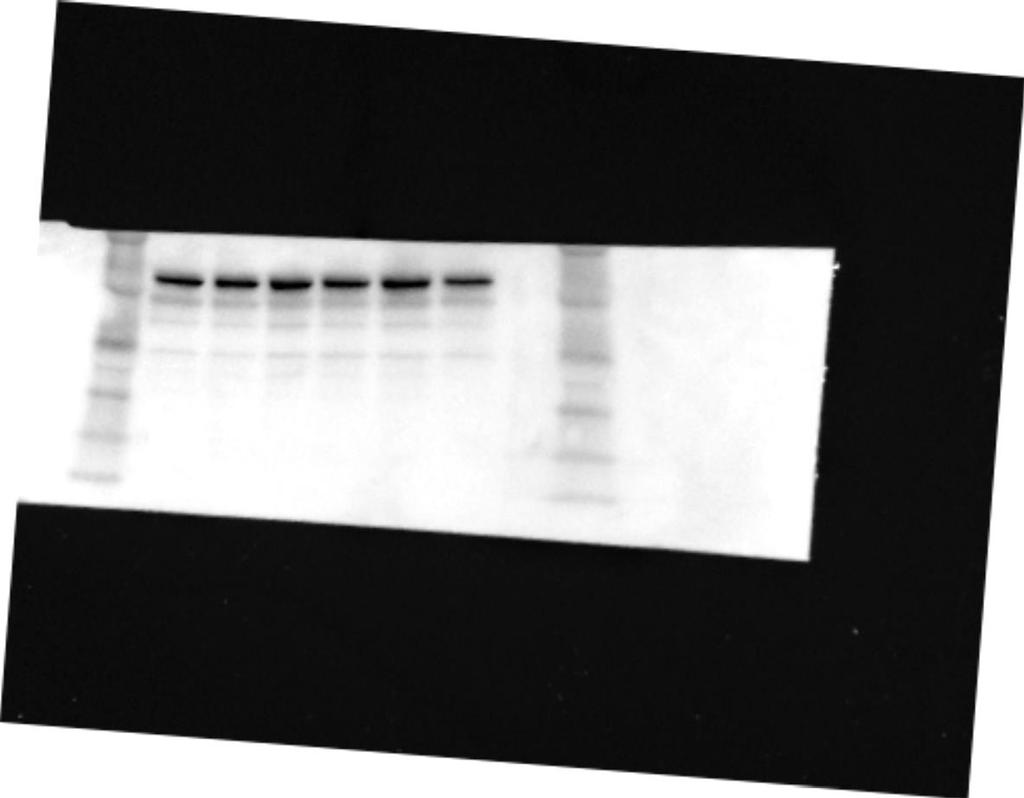
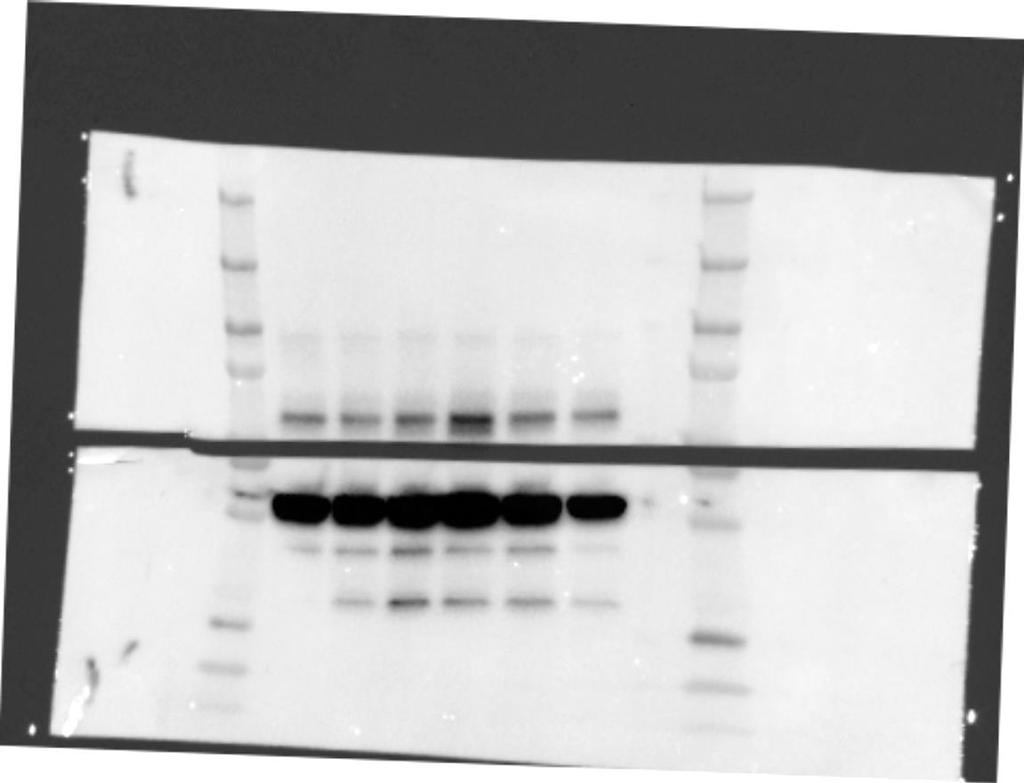
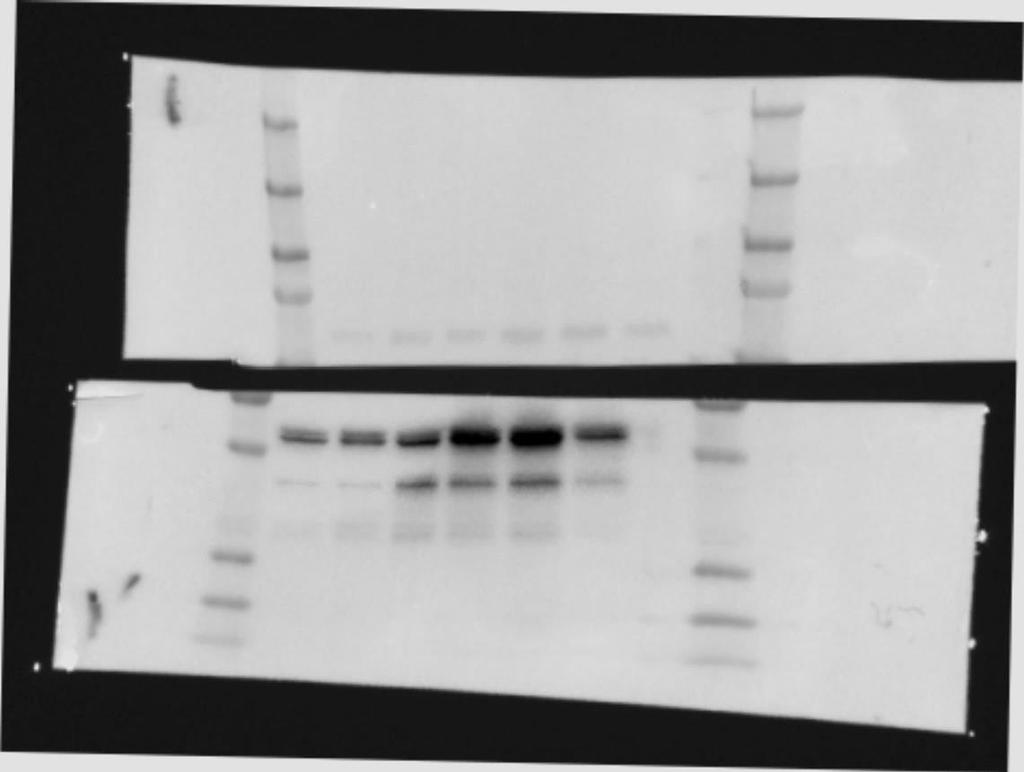
1 SUPPLEMENTARY INFORMATION Excessive fatty acid oxidation induces muscle atrophy in cancer cachexia Tomoya Fukawa, Benjamin Chua Yan-Jiang, Jason Chua Min-Wen, Elwin Tan Jun-Hao, Dan Huang, Chao-Nan Qian, Pauline Ong, Zhimei Li, Shuwen Chen, Shi Ya Mak, Wan Jun Lim, Hiro-omi Kanayama, Rosmin Elsa Mohan, Ruiqi Rachel Wang, Jiunn Herng Lai, Clarinda Chua, Hock Soo Ong, Ker-Kan Tan, Ying Swan Ho, Iain Beehuat Tan, Bin Tean Teh, Ng Shyh-Chang Supplementary Figure 1 Human RXF393 cancer cells induce muscle atrophy. (a) Relative frequency distributions of myofiber cross-sectional area in matching quadriceps muscle biopsies from SKR- and RXF-bearing mice. AU, arbitrary units of pixels. Data are expressed as means. P <.1 relative to SKR control, as determined by Mann-Whitney test. (b) Representative phase contrast images of early myotubes derived from human muscle stem cells isolated from patient biopsies, after 6d exposure to cachectic RXF media or non-cachectic SKR media. (c) Measurements of total cell volume differences in early myotubes from (b), based on quantitative phase imaging. Data are expressed as means ± s.e.m. P <.5 relative to SKR control, as determined by Student s t-test. (d) Western blot of human myotubes after 6 days of exposure to cachectic RXF or non-cachectic SKR medias, using antibodies against myogenin, α-actinin, fast myosin heavy chain (MHC), pan-mhc, GAPDH and tubulin. Supplementary Figure 2 Cachectic RXF media induces mitochondrial oxidative stress in human myotubes. (a) Representative MitoSox Red fluorescence images of live human myotubes after 1h exposure to cachectic RXF versus non-cachectic SKR media. (b) Representative MitoSox Red fluorescence images of live human myotubes after 1h exposure to cachectic RXF with and without the fatty acid oxidation inhibitor etomoxir 1 µm. (c) Quantification of cell death using ethidium dye, after 6d exposure to RXF media. Data are
2 expressed as means ± s.e.m. P <.5 relative to SKR control, as determined by Student s t- test. Supplementary Figure 3 Human G361 and mouse Lewis lung carcinoma (LLC) cells both cause excessive fatty acid oxidation to induce p38 MAPK signaling in myofibers as well. Western blot for phospho-p38, phospho-akt, IκBα, MHC, and GAPDH levels in quadriceps myofibers of G361- or LLC-bearing mice after daily intraperitoneal injections of DMSO vehicle or 2 mg/kg etomoxir (n = 3 each). Supplementary Figure 4 rescues muscle atrophy in mouse models of cachexia. (a) Representative images of RXF-bearing mice quadriceps muscle morphology with and without etomoxir treatment. -treated mice quadriceps preserved their muscle mass. (b) Forelimb and hindlimb muscle mass (% of body mass) of RXF-bearing mice after daily injections of DMSO vehicle, etomoxir or SB2219 (n = 5 each). (c) Forelimbs and hindlimbs muscle mass (% body mass) of G361-bearing mice after daily injections of DMSO vehicle, 2 mg/kg etomoxir or 5 mg/kg SB2219 (n = 5 each). Etoxomir and SB2219 rescued limb muscle loss. (d) Representative H&E histology of quadriceps muscles after daily intraperitoneal injections of DMSO vehicle or etomoxir in LLC-bearing C57BL/6J mice. rescued myofiber atrophy. Bar represents 2 µm. (e-g) Tumor growth curves of (e) RXF, (f) G361, and (g) LLC tumors, with daily injections of DMSO vehicle, 2 mg/kg etomoxir or 5 mg/kg of SB2219 (n = 5 each). Data are expressed as means ± s.e.m. P <.5 relative to DMSO vehicle control, as determined by Student s t-test. Supplementary Figure 5 Intramuscular controlled-release formulation of etomoxir only rescues treated hindlimbs muscle mass. (a) Hindlimb muscle mass (% of body mass) of RXF-bearing 2
3 mice after intramuscular injections of vehicle- (2% oxidized alginate beads, n = 6) or etomoxirgel (1 µg / 5 µl, n = 7) into hindlimb thigh muscles every 7 days. Mice were sacrificed when the mice lost 15% weight. Untreated and vehicle-gel-treated hindlimbs atrophied to 3.2% body mass, whereas the etomoxir-gel-treated hindlimbs showed a significant rescue from atrophy (3.8%, P =.7), similar to normal non-cachectic hindlimbs (3.6%). (b) Representative images of etomoxir-gel-treated left quadriceps muscle morphology and H&E histology, relative to the untreated right quadriceps muscles. Bar represents 2 µm. Data are expressed as means ± s.e.m. P <.1 relative to vehicle-gel control, as determined by Student s t-test. Supplementary Figure 6 inhibited fatty acid oxidation, but not PPARα-associated sterol and carbohydrate metabolism. (a) Acyl-carnitine levels in quadriceps muscles after 2 mg/kg etomoxir treatment (n = 4). (b) Fatty acid and cholesterol levels in quadriceps muscles after 2 mg/kg etomoxir treatment (n = 4). (c) Polar metabolites significantly changed in quadriceps muscles after 2 mg/kg etomoxir treatment (n = 4). altered only 12 of 3743 polar metabolites in quadriceps muscles, none of which were PPARα-associated carbohydrates. Instead only a polar fatty acid, several nucleotide-related metabolites, and redox-related metabolites were affected by etomoxir, supporting a fatty acid oxidation-specific mechanism that regulated the redox state and myocellular growth. CMP, cytidine monophosphate. FAD, flavin adenine dinucleotide. GSSG, glutathione disulfide. Data are expressed as means ± s.e.m. P <.5 and P <.1 relative to DMSO vehicle control, as determined by Student s t-test. Supplementary Figure 7 did not affect PPARα target genes in quadriceps muscles. Raw microarray expression values for PPARα target genes and PPARα itself, relative to Pax3 and Pax7, which are at the background level, after 2 mg/kg etomoxir treatment (n = 3). Pdk4, pyruvate dehydrogenase kinase 4. Fabp3, fatty acid binding protein 3. Ldha, lactate 3
4 dehydrogenase A. Pcx, pyruvate carboxylase. Pck1, phosphoenolpyruvate carboxykinase 1. Data are expressed as means ± s.e.m. P <.5 relative to DMSO vehicle control, as determined by Student s t-test. Supplementary Figure 8 Oxidative damage is correlated with p38 activation in cachexia patients muscle biopsies. (a-b) Representative immunohistochemical staining for (a) 8-oxoguanine and (b) nuclear phospho-p38 in non-cachexia and cachexia subject muscle biopsies (n = 11), and their quantitative H-scores. Bar represents 5µm. (c) Correlation plot for the H- scores of 8-oxo-guanine vs. phospho-p38 immunohistochemical staining in non-cachectic (black) and cachectic (red) subjects rectus abdominus muscles (n = 11). Data are expressed as means ± s.e.m. P <.5 relative to non-cachectic control, as determined by Student s t-test. Supplementary Table 1 Top 4 upregulated and downregulated gene sets in mouse myotubes after 6h exposure to cachectic RXF conditioned media, relative to SKR media (n = 3 each). Supplementary Table 2 Top 4 upregulated and downregulated gene sets in human myotubes after 6h exposure to cachectic RXF conditioned media, relative to SKR media (n = 3 each). Supplementary Table 3 Top 4 upregulated and downregulated gene sets in cachectic RXFbearing mouse quadriceps muscles, relative to non-cachectic SKR-bearing mouse quadriceps muscles (n = 3 each). Supplementary Table 4 Top 1 downregulated and upregulated gene sets in cachectic RXFbearing mouse quadriceps muscles, after daily intraperitoneal injections of 2 mg/kg etoxomir, relative to vehicle control (n = 3 each). 4
 5 4 3 2 1 5 1, 2,")


.8.6.4.")
5 a b Rlea-ve frequency (%) , 2, 8, 2, SKR media AU RXF SKR P <.1 RXF media (cachec-c) c SKR 1.2 d 1 RXF Total cell volume (fold) SKR RXF Supplementary Figure 1


6 a RXF condi-oned media SKR condi-oned media b RXF media +DMSO RXF media + c Cell death (fold change in ethidium fluorescence) SKR RXF n.s. Supplementary Figure 2


7 G361 LLC p- p38 p38 p- AKT (S473) AKT IκBα MHC GAPDH Supplementary Figure 3
 5 SB2219 c 9 G361 (n = 5) d")
 4 35 3 25 2")
 1 8 6 4 2")
 6 5 4")
8 a b Limbs muscle mass (% body mass) RXF (n = 5) 5 SB2219 c 9 G361 (n = 5) d Limbs muscle mass (% body mass) LLC 5 e f g Tumor Volume (mm 3 ) RXF SB2219 n.s Time (d) SB2219 G361 n.s Time (d) LLC n.s Time (d) Supplementary Figure 4


9 a RXF hindlimb muscle (% body mass) 4.% 3.8% 3.6% 3.4% 3.2% Normal Hindlimb b Eto- gel 3.% Eto no treatment no treatment - gel - gel Supplementary Figure 5 a b Fold change 1% 5% % Fold change 2% 15% 1% 5% % n.s. c Fold Change 25% 2% 15% 1% 5% % Decanoyl- carni-ne Stearoyl- carni-ne Palmitoyl- carni-ne Docosapent aenoyl- carni-ne Supplementary Figure 6


10 Supplementary Figure 7 a Non-cachexia Patients Cachexia Patients 2 8- Oxo- guanine 8- Oxo- guanine H- score b non- CX Noncachexia Cachexia CX Phospho- p38 c 2 Phospho- p38 H- score non- CX Noncachexia Cachexia CX 8- Oxo- guanine r = Supplementary Figure 8 Phospho- p38


11 Supplementary Table 1 Gene sets Up in cachec=c Mouse myotubes GALINDO_IMMUNE_RESPONSE_TO_ENTEROTOXIN ICHIBA_GRAFT_VERSUS_HOST_DISEASE_D7_UP BAKKER_FOXO3_TARGETS_UP MIZUSHIMA_AUTOPHAGOSOME_FORMATION Gene sets Down in cachec=c Mouse myotubes MANALO_HYPOXIA_DN REACTOME_MRNA_PROCESSING PENG_RAPAMYCIN_RESPONSE_DN KARLSSON_TGFB1_TARGETS_UP 5.23E E E E- 2.E-.E-.E- 3.E- 3 Supplementary Table 2 Gene sets Up in cachec=c Human myotubes DACOSTA_UV_RESPONSE_VIA_ERCC3_DN DACOSTA_UV_RESPONSE_VIA_ERCC3_COMMON_DN GARGALOVIC_RESPONSE_TO_OXIDIZED_PHOSPHOLIPIDS_UP BUYTAERT_PHOTODYNAMIC_THERAPY_STRESS_UP Gene sets Down in cachec=c Human myotubes ELVIDGE_HIF1A_AND_HIF2A_TARGETS_DN QI_HYPOXIA WINTER_HYPOXIA_UP ELVIDGE_HYPOXIA_BY_DMOG_UP 2.72E E E E- 1.E-.E- 5.45E E- 3 Supplementary Table 3 Top Gene sets Up in cachec=c mouse muscles BUYTAERT_PHOTODYNAMIC_THERAPY_STRESS_UP. REACTOME_ACTIVATION_OF_NF_KAPPAB_IN_B_CELLS.3 DAUER_STAT3_TARGETS_UP.3 KEGG_PROTEASOME.6 Top Gene sets Down in cachec=c mouse muscles MOOTHA_VOXPHOS. REACTOME_RESPIRATORY_ELECTRON_TRANSPORT. REACTOME_GLYCOLYSIS_GLUCONEOGENESIS.3 EBAUER_MYOGENIC_TARGETS_OF_PAX3_FOXO1_FUSION.4
12 Supplementary Table 4 Top Gene sets Down in cachec=c mouse muscles aver KEGG_PROTEASOME. REACTOME_ACTIVATION_OF_NF_KAPPAB_IN_B_CELLS. REACTOME_REGULATION_OF_MRNA_STABILITY_BY_PROTEINS_THAT_BIND_AU_RICH_ELEMENTS. BIOCARTA_PROTEASOME_PATHWAY. REACTOME_P53_DEPENDENT_G1_DNA_DAMAGE_RESPONSE. REACTOME_REGULATION_OF_APOPTOSIS. REACTOME_HOST_INTERACTIONS_OF_HIV_FACTORS. DAUER_STAT3_TARGETS_UP. RASHI_RESPONSE_TO_IONIZING_RADIATION_1. GARGALOVIC_RESPONSE_TO_OXIDIZED_PHOSPHOLIPIDS_BLUE_UP.1 Top Gene sets Up in cachec=c mouse muscles aver CHEMELLO_SOLEUS_VS_EDL_MYOFIBERS_UP. REACTOME_MUSCLE_CONTRACTION. EBAUER_MYOGENIC_TARGETS_OF_PAX3_FOXO1_FUSION. REACTOME_RESPIRATORY_ELECTRON_TRANSPORT_ATP_SYNTHESIS_BY_CHEMIOSMOTIC_COUPLING_A ND_HEAT_PRODUCTION_BY_UNCOUPLING_PROTEINS. REACTOME_RESPIRATORY_ELECTRON_TRANSPORT. REACTOME_TCA_CYCLE_AND_RESPIRATORY_ELECTRON_TRANSPORT. KUNINGER_IGF1_VS_PDGFB_TARGETS_UP. KEGG_CARDIAC_MUSCLE_CONTRACTION. REACTOME_GLUCOSE_METABOLISM.1 DELASERNA_MYOD_TARGETS_UP.2
SINGAPORE SCIENTISTS DISCOVER METABOLIC DRUG CAN TREAT TERMINAL WEIGHT LOSS IN CANCER PATIENTS
 MEDIA RELEASE 3 MAY 2016 SINGAPORE SCIENTISTS DISCOVER METABOLIC DRUG CAN TREAT TERMINAL WEIGHT LOSS IN CANCER PATIENTS Finding by researchers from Genome Institute of Singapore, National Cancer Centre
Fig. S1. Dose-response effects of acute administration of the β3 adrenoceptor agonists CL316243, BRL37344, ICI215,001, ZD7114, ZD2079 and CGP12177 at
 Fig. S1. Dose-response effects of acute administration of the β3 adrenoceptor agonists CL316243, BRL37344, ICI215,001, ZD7114, ZD2079 and CGP12177 at doses of 0.1, 0.5 and 1 mg/kg on cumulative food intake
SUPPLEMENTARY INFORMATION
 SUPPLEMENTARY INFORMATION doi:10.1038/nature11464 Supplemental Figure S1. The expression of Vegfb is increased in obese and diabetic mice as compared to lean mice. a-b, Body weight and postprandial blood
GPR120 *** * * Liver BAT iwat ewat mwat Ileum Colon. UCP1 mrna ***
 a GPR120 GPR120 mrna/ppia mrna Arbitrary Units 150 100 50 Liver BAT iwat ewat mwat Ileum Colon b UCP1 mrna Fold induction 20 15 10 5 - camp camp SB202190 - - - H89 - - - - - GW7647 Supplementary Figure
Supplementary Table 1. Primer Sequences Used for Quantitative Real-Time PCR
 Supplementary Table 1. Primer Sequences Used for Quantitative Real-Time PCR Gene Forward Primer (5-3 ) Reverse Primer (5-3 ) cadl CTTGGGGGCGCGTCT CTGTTCTTTTGTGCCGTTTCG cyl-coenzyme Dehydrogenase, very
Human recombinat MIF protein (hrmif), MW: Da. m/z. hrmif ( Da) + 4-IPP (282 Da) MWtot ~ Da. m/z.
, MW: Da. m/z. hrmif ( Da) + 4-IPP (282 Da) MWtot ~ Da. m/z.") Intensity % Intensity % A Human recombinat MIF protein (hrmif), MW: 12428.31 Da m/z hrmif (12428.31 Da) + 4-IPP (282 Da) MWtot ~ 12715.21 Da m/z B HTC/C3 DAPI phistone-h3 Merge HTC/C3 DAPI phistone-h3
Intensity % Intensity % A Human recombinat MIF protein (hrmif), MW: 12428.31 Da m/z hrmif (12428.31 Da) + 4-IPP (282 Da) MWtot ~ 12715.21 Da m/z B HTC/C3 DAPI phistone-h3 Merge HTC/C3 DAPI phistone-h3
SUPPLEMENTARY DATA. Supplementary Table 1. Primers used in qpcr
 Supplementary Table 1. Primers used in qpcr Gene forward primer (5'-3') reverse primer (5'-3') β-actin AGAGGGAAATCGTGCGTGAC CAATAGTGATGACCTGGCCGT Hif-p4h-2 CTGGGCAACTACAGGATAAAC GCGTCCCAGTCTTTATTTAGATA
Supplementary Figure S I: Effects of D4F on body weight and serum lipids in apoe -/- mice.
 Supplementary Figures: Supplementary Figure S I: Effects of D4F on body weight and serum lipids in apoe -/- mice. Male apoe -/- mice were fed a high-fat diet for 8 weeks, and given PBS (model group) or
Supplementary Table 1.
 Supplementary Table 1. Expression of genes involved in brown fat differentiation in WAT of db/db mice treated with HDAC inhibitors. Data are expressed as fold change (FC) versus control. symbol FC SAHA
W/T Itgam -/- F4/80 CD115. F4/80 hi CD115 + F4/80 + CD115 +
 F4/8 % in the peritoneal lavage 6 4 2 p=.15 n.s p=.76 CD115 F4/8 hi CD115 + F4/8 + CD115 + F4/8 hi CD115 + F4/8 + CD115 + MHCII MHCII Supplementary Figure S1. CD11b deficiency affects the cellular responses
Figure S1. Sorting nexin 9 (SNX9) specifically binds psmad3 and not psmad 1/5/8. Lysates from AKR-2B cells untreated (-) or stimulated (+) for 45 min
 specifically binds psmad3 and not psmad 1/5/8. Lysates from AKR-2B cells untreated (-) or stimulated (+) for 45 min") Figure S1. Sorting nexin 9 (SNX9) specifically binds psmad3 and not psmad 1/5/8. Lysates from AKR2B cells untreated () or stimulated () for 45 min with 5 ng/ml TGFβ or 10 ng/ml BMP4 were incubated with
Figure S1. Sorting nexin 9 (SNX9) specifically binds psmad3 and not psmad 1/5/8. Lysates from AKR2B cells untreated () or stimulated () for 45 min with 5 ng/ml TGFβ or 10 ng/ml BMP4 were incubated with
SUPPLEMENTARY LEGENDS...
 TABLE OF CONTENTS SUPPLEMENTARY LEGENDS... 2 11 MOVIE S1... 2 FIGURE S1 LEGEND... 3 FIGURE S2 LEGEND... 4 FIGURE S3 LEGEND... 5 FIGURE S4 LEGEND... 6 FIGURE S5 LEGEND... 7 FIGURE S6 LEGEND... 8 FIGURE
CYLD Negatively Regulates Transforming Growth Factor-β Signaling via Deubiquitinating Akt
 Supplementary Information CYLD Negatively Regulates Transforming Growth Factor-β Signaling via Deubiquitinating Akt Jae Hyang Lim, Hirofumi Jono, Kensei Komatsu, Chang-Hoon Woo, Jiyun Lee, Masanori Miyata,
Supplementary Figure 1. DJ-1 modulates ROS concentration in mouse skeletal muscle.
 Supplementary Figure 1. DJ-1 modulates ROS concentration in mouse skeletal muscle. (a) mrna levels of Dj1 measured by quantitative RT-PCR in soleus, gastrocnemius (Gastroc.) and extensor digitorum longus
a. b. c. d. e. f. g. h. i. j. k. l. m. n. o. p.
 a. b. c. d. e. f. g. h. i. j. k. l. 2.5 2 1.5 1.5 IL-1β 12 8 6 4 2 IL-1β 9 8 7 6 4 3 3 2.9 IL-1β m. n. o. p. 1.8 1.6 1.4 1.2 1.8.6.4.2 6h LPS 2 15 1 5 6h LPS 2 6h LPS 6 4 3 6h LPS Supplementary Figure
Gallic acid prevents isoproterenol-induced cardiac hypertrophy and fibrosis through regulation of JNK2 signaling and Smad3 binding activity
 Gallic acid prevents isoproterenol-induced cardiac hypertrophy and fibrosis through regulation of JNK2 signaling and Smad3 binding activity Yuhee Ryu 1,+, Li Jin 1,2+, Hae Jin Kee 1,, Zhe Hao Piao 3, Jae
SUPPLEMENTARY INFORMATION
 doi:10.1038/nature12652 Supplementary Figure 1. PRDM16 interacts with endogenous EHMT1 in brown adipocytes. Immunoprecipitation of PRDM16 complex by flag antibody (M2) followed by Western blot analysis
Supplemental Figure 1. Western blot analysis indicated that MIF was detected in the fractions of
 Supplemental Figure Legends Supplemental Figure 1. Western blot analysis indicated that was detected in the fractions of plasma membrane and cytosol but not in nuclear fraction isolated from Pkd1 null
Supplementary Figure 1. Mitochondrial function in skeletal muscle and plasma parameters of STZ mice A D-F
 Supplementary Figure 1. Mitochondrial function in skeletal muscle and plasma parameters of STZ mice A Expression of representative subunits of the mitochondrial respiratory chain was analyzed by real time
Supplementary Figure 1.
 Supplementary Figure 1. FGF21 does not exert direct effects on hepatic glucose production. The liver explants from C57BL/6J mice (A, B) or primary rat hepatocytes (C, D) were incubated with rmfgf21 (2
SUPPLEMENTARY DATA. Nature Medicine: doi: /nm.4171
 SUPPLEMENTARY DATA Supplementary Figure 1 a b c PF %Change - -4-6 Body weight Lean mass Body fat Tissue weight (g).4.3.2.1. PF GC iwat awat BAT PF d e f g week 2 week 3 NEFA (mmol/l) 1..5. PF phsl (Ser565)
18s AAACGGCTACCACATCCAAG CCTCCAATGGATCCTCGTTA. 36b4 GTTCTTGCCCATCAGCACC AGATGCAGCAGATCCGCAT. Acc1 AGCAGATCCGCAGCTTG ACCTCTGCTCGCTGAGTGC
 Supplementary Table 1. Quantitative PCR primer sequences Gene symbol Sequences (5 to 3 ) Forward Reverse 18s AAACGGCTACCACATCCAAG CCTCCAATGGATCCTCGTTA 36b4 GTTCTTGCCCATCAGCACC AGATGCAGCAGATCCGCAT Acc1
Suppl. Figure 1. T 3 induces autophagic flux in hepatic cells. (A) RFP-GFP-LC3 transfected HepG2/TRα cells were visualized and cells were quantified
 RFP-GFP-LC3 transfected HepG2/TRα cells were visualized and cells were quantified") Suppl. Figure 1. T 3 induces autophagic flux in hepatic cells. (A) RFP-GFP-LC3 transfected HepG2/TRα cells were visualized and cells were quantified for RFP-LC3 puncta (red dots) representing both autolysosomes
Suppl. Figure 1. T 3 induces autophagic flux in hepatic cells. (A) RFP-GFP-LC3 transfected HepG2/TRα cells were visualized and cells were quantified for RFP-LC3 puncta (red dots) representing both autolysosomes
c Ischemia (30 min) Reperfusion (8 w) Supplementary Figure bp 300 bp Ischemia (30 min) Reperfusion (4 h) Dox 20 mg/kg i.p.
 Reperfusion (8 w) Supplementary Figure bp 300 bp Ischemia (30 min) Reperfusion (4 h) Dox 20 mg/kg i.p.") a Marker Ripk3 +/ 5 bp 3 bp b Ischemia (3 min) Reperfusion (4 h) d 2 mg/kg i.p. 1 w 5 w Sacrifice for IF size A subset for echocardiography and morphological analysis c Ischemia (3 min) Reperfusion (8
a Marker Ripk3 +/ 5 bp 3 bp b Ischemia (3 min) Reperfusion (4 h) d 2 mg/kg i.p. 1 w 5 w Sacrifice for IF size A subset for echocardiography and morphological analysis c Ischemia (3 min) Reperfusion (8
Supporting Information
 Supporting Information M1 macrophage-derived nanovesicles potentiate the anticancer efficacy of immune checkpoint inhibitors Yeon Woong Choo, 1, Mikyung Kang, 2, Han Young Kim, 1 Jin Han, 1 Seokyung Kang,
Supplementary Table I Blood pressure and heart rate measurements pre- and post-stroke
 SUPPLEMENTARY INFORMATION doi:10.1038/nature09511 Supplementary Table I Blood pressure and heart rate measurements pre- and post-stroke Pre Post 7-days Systolic Diastolic BPM Systolic Diastolic BPM Systolic
Astragaloside IV ameliorates 2,4,6-trinitrobenzene sulfonic acid (TNBS)-induced
-induced") Astragaloside IV ameliorates 2,4,6-trinitrobenzene sulfonic acid (TNBS)-induced colitis implicating regulation of energy metabolism Xu-Guang Jiang 1,2,, Kai Sun 1,3,4,5,, Yu-Ying Liu 1,4,5, Li Yan 1,4,5,
Astragaloside IV ameliorates 2,4,6-trinitrobenzene sulfonic acid (TNBS)-induced colitis implicating regulation of energy metabolism Xu-Guang Jiang 1,2,, Kai Sun 1,3,4,5,, Yu-Ying Liu 1,4,5, Li Yan 1,4,5,
Supplemental Table 1 Primer sequences (mouse) used for real-time qrt-pcr studies
 used for real-time qrt-pcr studies") Supplemental Table 1 Primer sequences (mouse) used for real-time qrt-pcr studies Gene symbol Forward primer Reverse primer ACC1 5'-TGAGGAGGACCGCATTTATC 5'-GCATGGAATGGCAGTAAGGT ACLY 5'-GACACCATCTGTGATCTTG
Supplemental Table 1 Primer sequences (mouse) used for real-time qrt-pcr studies Gene symbol Forward primer Reverse primer ACC1 5'-TGAGGAGGACCGCATTTATC 5'-GCATGGAATGGCAGTAAGGT ACLY 5'-GACACCATCTGTGATCTTG
Supplementary Figure 1 Expression of Crb3 in mouse sciatic nerve: biochemical analysis (a) Schematic of Crb3 isoforms, ERLI and CLPI, indicating the
 Schematic of Crb3 isoforms, ERLI and CLPI, indicating the") Supplementary Figure 1 Expression of Crb3 in mouse sciatic nerve: biochemical analysis (a) Schematic of Crb3 isoforms, ERLI and CLPI, indicating the location of the transmembrane (TM), FRM binding (FB)
Supplementary Figure 1 Expression of Crb3 in mouse sciatic nerve: biochemical analysis (a) Schematic of Crb3 isoforms, ERLI and CLPI, indicating the location of the transmembrane (TM), FRM binding (FB)
Supplementary Table 1. Characterization of HNSCC PDX models established at MSKCC
 Supplementary Table 1. Characterization of HNSCC PDX models established at MSKCC Supplementary Table 2. Drug content and loading efficiency estimated with F-NMR and UV- Vis Supplementary Table 3. Complete
Supplemental Information. Metabolic Maturation during Muscle Stem Cell. Differentiation Is Achieved by mir-1/133a-mediated
 Cell Metabolism, Volume 27 Supplemental Information Metabolic Maturation during Muscle Stem Cell Differentiation Is Achieved by mir-1/133a-mediated Inhibition of the Dlk1-Dio3 Mega Gene Cluster Stas Wüst,
SUPPLEMENTARY INFORMATION
 DOI: 10.1038/ncb3461 In the format provided by the authors and unedited. Supplementary Figure 1 (associated to Figure 1). Cpeb4 gene-targeted mice develop liver steatosis. a, Immunoblot displaying CPEB4
glucose glucose 6-phospho fructose 6-phosphate fructose 1,6-bisphosphate glyceraldehyde 3-phosphate 1,3-bisphosphoglycerate 3-phosphoglycerate
 Cells glucose glucose glucose 6-phospho glycogen pentose phosphate T 1-phosphate 6-phosphate gluconate CC T CC+PD-1 pathway Isobar: fructose 1,6-diphosphate; glucose 1,6-diphosphate DHAP lactate fructose
Boucher et al NCOMMS B
 1 Supplementary Figure 1 (linked to Figure 1). mvegfr1 constitutively internalizes in endothelial cells. (a) Immunoblot of mflt1 from undifferentiated mouse embryonic stem (ES) cells with indicated genotypes;
Rescue of mutant rhodopsin traffic by metformin-induced AMPK activation accelerates photoreceptor degeneration Athanasiou et al
 Supplementary Material Rescue of mutant rhodopsin traffic by metformin-induced AMPK activation accelerates photoreceptor degeneration Athanasiou et al Supplementary Figure 1. AICAR improves P23H rod opsin
Supplementary Figure S1
 Lipidomic-based investigation into the regulatory effect of Schisandrin B on palmitic acid level in non-alcoholic steatotic livers Hiu Yee Kwan 1,2, Xuyan Niu 3, Wenlin Dai 4, Tiejun Tong 4, Xiaojuan Chao
SUPPLEMENTARY DATA Supplementary Figure 1. Body weight and fat mass of AdicerKO mice.
 SUPPLEMENTARY DATA Supplementary Figure 1. Body weight and fat mass of AdicerKO mice. Twelve week old mice were subjected to ad libitum (AL) or dietary restriction (DR) regimens for three months. (A) Body
Supplementary Figure 1. Spatial distribution of LRP5 and β-catenin in intact cardiomyocytes. (a) and (b) Immunofluorescence staining of endogenous
 and (b) Immunofluorescence staining of endogenous") Supplementary Figure 1. Spatial distribution of LRP5 and β-catenin in intact cardiomyocytes. (a) and (b) Immunofluorescence staining of endogenous LRP5 in intact adult mouse ventricular myocytes (AMVMs)
Supplementary Figure 1. Spatial distribution of LRP5 and β-catenin in intact cardiomyocytes. (a) and (b) Immunofluorescence staining of endogenous LRP5 in intact adult mouse ventricular myocytes (AMVMs)
Protein tyrosine phosphatase 1B targets PITX1/p120RasGAP. thus showing therapeutic potential in colorectal carcinoma
 Protein tyrosine phosphatase 1B targets PITX1/p120RasGAP thus showing therapeutic potential in colorectal carcinoma Hao-Wei Teng, Man-Hsin Hung, Li-Ju Chen, Mao-Ju Chang, Feng-Shu Hsieh, Ming-Hsien Tsai,
Supplementary Materials for
 www.sciencesignaling.org/cgi/content/full/8/375/ra41/dc1 Supplementary Materials for Actin cytoskeletal remodeling with protrusion formation is essential for heart regeneration in Hippo-deficient mice
Supplementary Figure 1. Metabolic landscape of cancer discovery pipeline. RNAseq raw counts data of cancer and healthy tissue samples were downloaded
 Supplementary Figure 1. Metabolic landscape of cancer discovery pipeline. RNAseq raw counts data of cancer and healthy tissue samples were downloaded from TCGA and differentially expressed metabolic genes
Supplementary Materials
 Supplementary Materials Figure S1. MTT Cell viability assay. To measure the cytotoxic potential of the oxidative treatment, the MTT [3-(4,5-dimethylthiazol- 2-yl)-2,5-diphenyl tetrazolium bromide] assay
Ginkgo biloba leaf extract induces DNA damage by inhibiting topoisomerase II activity in human hepatic cells
 Ginkgo biloba leaf extract induces DNA damage by inhibiting topoisomerase II activity in human hepatic cells Zhuhong Zhang 1, Si Chen 2, Hu Mei 3, Jiekun Xuan 2, Xiaoqing Guo 1, Letha Couch 2, Vasily N.
Supplemental Figure S1. RANK expression on human lung cancer cells.
 Supplemental Figure S1. RANK expression on human lung cancer cells. (A) Incidence and H-Scores of RANK expression determined from IHC in the indicated primary lung cancer subgroups. The overall expression
Supplementary Figure 1. Antibiotic partially rescues mice from sepsis. (ab) BALB/c mice under CLP were treated with antibiotic or PBS.
 BALB/c mice under CLP were treated with antibiotic or PBS.") 1 Supplementary Figure 1. Antibiotic partially rescues mice from sepsis. (ab) BALB/c mice under CLP were treated with antibiotic or PBS. (a) Survival curves. WT Sham (n=5), WT CLP or WT CLP antibiotic
1 Supplementary Figure 1. Antibiotic partially rescues mice from sepsis. (ab) BALB/c mice under CLP were treated with antibiotic or PBS. (a) Survival curves. WT Sham (n=5), WT CLP or WT CLP antibiotic
Supplementary Figure 1 IMQ-Induced Mouse Model of Psoriasis. IMQ cream was
 Supplementary Figure 1 IMQ-Induced Mouse Model of Psoriasis. IMQ cream was painted on the shaved back skin of CBL/J and BALB/c mice for consecutive days. (a, b) Phenotypic presentation of mouse back skin
Supplementary Figure 1
 Combination index (CI) Supplementary Figure 1 2. 1.5 1. Ishikawa AN3CA Nou-1 Hec-18.5...2.4.6.8 1. Fraction affected (Fa) Supplementary Figure 1. The synergistic effect of PARP inhibitor and PI3K inhibitor
Disrupting GluA2-GAPDH Interaction Affects Axon and Dendrite Development
 Disrupting GluA2-GAPDH Interaction Affects Axon and Dendrite Development 1 Frankie Hang Fung Lee, 1 Ping Su, 1 Yu Feng Xie, 1 Kyle Ethan Wang, 2 Qi Wan and 1,3 Fang Liu 1 Campbell Research Institute, Centre
Supplemental Figures:
 Supplemental Figures: Figure 1: Intracellular distribution of VWF by electron microscopy in human endothelial cells. a) Immunogold labeling of LC3 demonstrating an LC3-positive autophagosome (white arrow)
SHREE ET AL, SUPPLEMENTAL MATERIALS. (A) Workflow for tumor cell line derivation and orthotopic implantation.
 Workflow for tumor cell line derivation and orthotopic implantation.") SHREE ET AL, SUPPLEMENTAL MATERIALS SUPPLEMENTAL FIGURE AND TABLE LEGENDS Supplemental Figure 1. Derivation and characterization of TS1-TGL and TS2-TGL PyMT cell lines and development of an orthotopic
SHREE ET AL, SUPPLEMENTAL MATERIALS SUPPLEMENTAL FIGURE AND TABLE LEGENDS Supplemental Figure 1. Derivation and characterization of TS1-TGL and TS2-TGL PyMT cell lines and development of an orthotopic
Figure S1A. Blood glucose levels in mice after glucose injection
 ## Figure S1A. Blood glucose levels in mice after glucose injection Blood glucose (mm/l) 25 2 15 1 5 # 15 3 6 3+3 Time after glucose injection (min) # Figure S1B. α-kg levels in mouse livers after glucose
Ephrin receptor A2 is an epithelial cell receptor for Epstein Barr virus entry
 SUPPLEMENTARY INFORMATION Letters https://doi.org/10.1038/s41564-017-0080-8 In the format provided by the authors and unedited. Ephrin receptor A2 is an epithelial cell receptor for Epstein Barr virus
Supplementary Information. Protectin DX alleviates insulin resistance by activating a myokine-liver glucoregulatory axis.
 Supplementary Information Protectin DX alleviates insulin resistance by activating a myokine-liver glucoregulatory axis. Phillip J. White, Philippe St-Pierre, Alexandre Charbonneau, Patricia Mitchell,
Impact factor: Reporter:4A1H0019 Chen Zi Hao 4A1H0023 Huang Wan ting 4A1H0039 Sue Yi Zhu 4A1H0070 Lin Guan cheng 4A1H0077 Chen Bo xuan
 Curcumin Protects Neonatal Rat Cardiomyocytes against High Glucose-Induced Apoptosis via PI3K/Akt Signalling Pathway Wei Yu,1,2 Wenliang Zha,1 Zhiqiang Ke,1 Qing Min,2 Cairong Li,1 Huirong Sun,3 and Chao
Supplementary Figure 1 Chemokine and chemokine receptor expression during muscle regeneration (a) Analysis of CR3CR1 mrna expression by real time-pcr
 Analysis of CR3CR1 mrna expression by real time-pcr") Supplementary Figure 1 Chemokine and chemokine receptor expression during muscle regeneration (a) Analysis of CR3CR1 mrna expression by real time-pcr at day 0, 1, 4, 10 and 21 post- muscle injury. (b)
Supplementary Figure 1 Chemokine and chemokine receptor expression during muscle regeneration (a) Analysis of CR3CR1 mrna expression by real time-pcr at day 0, 1, 4, 10 and 21 post- muscle injury. (b)
Nature Medicine: doi: /nm.3922
 Title: Glucocorticoid-induced tumor necrosis factor receptor-related protein co-stimulation facilitates tumor regression by inducing IL-9-producing helper T cells Authors: Il-Kyu Kim, Byung-Seok Kim, Choong-Hyun
6. TNF-α regulates oxidative stress, mitochondrial function and autophagy in neuronal cells
 6. TNF-α regulates oxidative stress, mitochondrial function and autophagy in neuronal cells 6.1 TNF-α induces mitochondrial oxidative stress in SH-SY5Y cells. The dysregulation of mitochondria and oxidative
fl/+ KRas;Atg5 fl/+ KRas;Atg5 fl/fl KRas;Atg5 fl/fl KRas;Atg5 Supplementary Figure 1. Gene set enrichment analyses. (a) (b)
 (b)") KRas;At KRas;At KRas;At KRas;At a b Supplementary Figure 1. Gene set enrichment analyses. (a) GO gene sets (MSigDB v3. c5) enriched in KRas;Atg5 fl/+ as compared to KRas;Atg5 fl/fl tumors using gene set
KRas;At KRas;At KRas;At KRas;At a b Supplementary Figure 1. Gene set enrichment analyses. (a) GO gene sets (MSigDB v3. c5) enriched in KRas;Atg5 fl/+ as compared to KRas;Atg5 fl/fl tumors using gene set
Plasma exposure levels from individual mice 4 hours post IP administration at the
 Supplemental Figure Legends Figure S1. Plasma exposure levels of MKC-3946 in mice. Plasma exposure levels from individual mice 4 hours post IP administration at the indicated dose mg/kg. Data represent
GW(g)/BW(g) GW(g)/BW(g) Con Dex Con Dex. GW(g)/BW(g) Relative mrna levels. Atrogin-1 Murf-1. Atrogin-1 Murf-1. Soleus
/BW(g) GW(g)/BW(g) Con Dex Con Dex. GW(g)/BW(g) Relative mrna levels. Atrogin-1 Murf-1. Atrogin-1 Murf-1. Soleus") a b c GW(g) GW(g) GW(g) 0.20 0.15 0.10 0.05 0.00 0.20 0.15 0.10 0.05 Den * ** GW(g)/BW(g) Den Dex Dex GW(g)/BW(g) d 0.00 Fasting GW(g) e 0.15 Cancer Cachexia f GW(g) 0.10 0.05 0.00 Young ** Old g GW(g)/BW(g)
a b c GW(g) GW(g) GW(g) 0.20 0.15 0.10 0.05 0.00 0.20 0.15 0.10 0.05 Den * ** GW(g)/BW(g) Den Dex Dex GW(g)/BW(g) d 0.00 Fasting GW(g) e 0.15 Cancer Cachexia f GW(g) 0.10 0.05 0.00 Young ** Old g GW(g)/BW(g)
nature methods Organelle-specific, rapid induction of molecular activities and membrane tethering
 nature methods Organelle-specific, rapid induction of molecular activities and membrane tethering Toru Komatsu, Igor Kukelyansky, J Michael McCaffery, Tasuku Ueno, Lidenys C Varela & Takanari Inoue Supplementary
Nature Medicine: doi: /nm.4324
 1 2 3 4 5 6 7 8 9 10 11 12 13 14 15 16 17 18 19 20 21 22 23 24 25 Supplementary Figure 1. Kinetics of SnCs development in surgically-induced OA and effect of GCV-induced SnC clearance on OA disease progression
SUPPLEMENTARY INFORMATION
 DOI: 10.1038/ncb2607 Figure S1 Elf5 loss promotes EMT in mammary epithelium while Elf5 overexpression inhibits TGFβ induced EMT. (a, c) Different confocal slices through the Z stack image. (b, d) 3D rendering
SUPPLEMENTARY INFORMATION
 DOI:.38/ncb3399 a b c d FSP DAPI 5mm mm 5mm 5mm e Correspond to melanoma in-situ Figure a DCT FSP- f MITF mm mm MlanaA melanoma in-situ DCT 5mm FSP- mm mm mm mm mm g melanoma in-situ MITF MlanaA mm mm
control kda ATGL ATGLi HSL 82 GAPDH * ** *** WT/cTg WT/cTg ATGLi AKO/cTg AKO/cTg ATGLi WT/cTg WT/cTg ATGLi AKO/cTg AKO/cTg ATGLi iwat gwat ibat
 body weight (g) tissue weights (mg) ATGL protein expression (relative to GAPDH) HSL protein expression (relative to GAPDH) ### # # kda ATGL 55 HSL 82 GAPDH 37 2.5 2. 1.5 1..5 2. 1.5 1..5.. Supplementary
Supplementary Figure 1
 Supplementary Figure 1 A B mir-141, human cell lines mir-2c, human cell lines mir-141, hepatocytes mir-2c, hepatocytes Relative RNA.1.8.6.4.2 Relative RNA.3.2.1 Relative RNA 1.5 1..5 Relative RNA 2. 1.5
a 10 4 Link et al. Supplementary Figure 1 Nature Immunology: doi: /ni.1842 Cells per mouse ( 10 5 ) TRPV2KO anti-gr1 anti-gr anti-f4/80
 TRPV2KO anti-gr1 anti-gr anti-f4/80") a 10 4 WT 10 4 TRPV2KO 10 3 10 3 anti-gr1 10 2 10 1 anti-gr1 10 2 10 1 10 0 10 0 10 1 10 2 10 3 10 4 anti-f4/80 42.3 45.2 10 0 10 0 10 1 10 2 10 3 10 4 anti-f4/80 10 4 10 4 40 42.5 anti-cd11b 10 3 10 2
a 10 4 WT 10 4 TRPV2KO 10 3 10 3 anti-gr1 10 2 10 1 anti-gr1 10 2 10 1 10 0 10 0 10 1 10 2 10 3 10 4 anti-f4/80 42.3 45.2 10 0 10 0 10 1 10 2 10 3 10 4 anti-f4/80 10 4 10 4 40 42.5 anti-cd11b 10 3 10 2
Supplementary Information File
 Supplementary Information File Supplementary Table 1. List of synthesized sirna sequences for target genes sirna Species Sequence Ctrl sirna mouse sense 5 -UUCUCCGAACGUGUCACGUTT-3 Antisense 5 -ACGUGACACGUUCGGAGAATT-3
Supplementary Figure 1. Expression of CUGBP1 in non-parenchymal liver cells treated with TGF-β
 Supplementary Figures Supplementary Figure 1. Expression of CUGBP1 in non-parenchymal liver cells treated with TGF-β and LPS. Non-parenchymal liver cells were isolated and treated with or without TGF-β
Social deficits in Shank3-deficient mouse models of autism are rescued by histone deacetylase (HDAC) inhibition
 inhibition") SUPPLEMENTARY INFORMATION Articles https://doi.org/10.1038/s41593-018-0110-8 In the format provided by the authors and unedited. Social deficits in Shank3-deficient mouse models of autism are rescued by
SUPPLEMENTARY INFORMATION Articles https://doi.org/10.1038/s41593-018-0110-8 In the format provided by the authors and unedited. Social deficits in Shank3-deficient mouse models of autism are rescued by
p = formed with HCI-001 p = Relative # of blood vessels that formed with HCI-002 Control Bevacizumab + 17AAG Bevacizumab 17AAG
 A.. Relative # of ECs associated with HCI-001 1.4 1.2 1.0 0.8 0.6 0.4 0.2 0.0 ol b p < 0.001 Relative # of blood vessels that formed with HCI-001 1.4 1.2 1.0 0.8 0.6 0.4 0.2 0.0 l b p = 0.002 Control IHC:
(A) RT-PCR for components of the Shh/Gli pathway in normal fetus cell (MRC-5) and a
 RT-PCR for components of the Shh/Gli pathway in normal fetus cell (MRC-5) and a") Supplementary figure legends Supplementary Figure 1. Expression of Shh signaling components in a panel of gastric cancer. (A) RT-PCR for components of the Shh/Gli pathway in normal fetus cell (MRC-5) and
Supplementary figure legends Supplementary Figure 1. Expression of Shh signaling components in a panel of gastric cancer. (A) RT-PCR for components of the Shh/Gli pathway in normal fetus cell (MRC-5) and
Nature Neuroscience: doi: /nn Supplementary Figure 1
 Supplementary Figure 1 EGFR inhibition activates signaling pathways (a-b) EGFR inhibition activates signaling pathways (a) U251EGFR cells were treated with erlotinib (1µM) for the indicated times followed
Supplementary Material
 Electronic Supplementary Material (ESI) for Integrative Biology. This journal is The Royal Society of Chemistry 2018 Supplementary Material 1 Supplemental Figures Supplemental Figure S1. Mechanical properties
Supplementary Figures
 Supplementary Figures Supplementary Figure 1 Increased ABHD5 expression in human colon cancer associated macrophages. (a) Murine peritoneal macrophages were treated with regular culture medium (Ctrl) or
SUPPLEMENTARY INFORMATION
 1. Supplementary Figures and Legends Supplementary Fig. 1. S1P-mediated transcriptional regulation of integrins expressed in OP/monocytoid cells. Real-time quantitative PCR analyses of mrna for two integrins,
islets scored 1 week month months
 Supplementary Table 1. Sampling parameters for the morphometrical analyses Time (post- DT) Control mice (age-matched) α-cells mice pancreatic surface (mm 2 ) scored DT-treated mice islets scored mice pancreatic
Supplementary Figure 1
 Supplementary Figure 1 Genetic labeling of microglia Male and female 2-3 month-old CreERT2;R26-tdTomato mice or CreERT2;R26-tdTomato;Iba1-eGFP transgenic mice were treated with 1x, 2x (48 h apart), or
Loss of Calreticulin Uncovers a Critical Role for Calcium in Regulating Cellular Lipid Homeostasis
 SUPPLEMENTARY MATERIAL Loss of Calreticulin Uncovers a Critical Role for Calcium in Regulating Cellular Lipid Homeostasis Wen-An Wang 1, Wen-Xin Liu 1, Serpen Durnaoglu 2, Sun-Kyung Lee 2, Jihong Lian
Supplementary. limb. bars
 Figure 1. CD163 -/- mice exhibit a similar phenotype ass WT mice in the absence of ischemic injury. a, Laser Doppler analysiss with perfusion quantitation at baseline (n= =10 per group). b, Immunostaining
CELLULAR RESPIRATION SUMMARY EQUATION. C 6 H 12 O 6 + O 2 6CO2 + 6H 2 O + energy (ATP) STEPWISE REDOX REACTION
 STEPWISE REDOX REACTION") CELLULAR RESPIRATION SUMMARY EQUATION C 6 H 12 O 6 + O 2 6CO2 + 6H 2 O + energy (ATP) STEPWISE REDOX REACTION Oxidation: partial or complete loss of electrons Reduction: partial or complete gain of electrons
CELLULAR RESPIRATION SUMMARY EQUATION C 6 H 12 O 6 + O 2 6CO2 + 6H 2 O + energy (ATP) STEPWISE REDOX REACTION Oxidation: partial or complete loss of electrons Reduction: partial or complete gain of electrons
SUPPLEMENTARY INFORMATION
 SUPPLEMENTARY INFORMATION doi:1.138/nature9814 a A SHARPIN FL B SHARPIN ΔNZF C SHARPIN T38L, F39V b His-SHARPIN FL -1xUb -2xUb -4xUb α-his c Linear 4xUb -SHARPIN FL -SHARPIN TF_LV -SHARPINΔNZF -SHARPIN
Supplementary Table 1. Metabolic parameters in GFP and OGT-treated mice
 Supplementary Table 1. Metabolic parameters in GFP and OGT-treated mice Fasted Refed GFP OGT GFP OGT Liver G6P (mmol/g) 0.03±0.01 0.04±0.02 0.60±0.04 0.42±0.10 A TGs (mg/g of liver) 20.08±5.17 16.29±0.8
Supplementary Figures
 Supplementary Figures Supplementary Figure 1 Characterization of stable expression of GlucB and sshbira in the CT26 cell line (a) Live cell imaging of stable CT26 cells expressing green fluorescent protein
Supplementary Material for
 Supplementary Material for Parathyroid Hormone Signaling through Low-density-lipoprotein-related Protein 6 Mei Wan, Chaozhe Yang, Jun Li, Xiangwei Wu, Hongling Yuan, Hairong Ma, Xi He, Shuyi Nie, Chenbei
Aggregated neutrophil extracellular traps limit inflammation by degrading cytokines and chemokines
 CORRECTION NOTICE Nat. Med. doi:10.1038/nm.3547; corrected online 25 August 2014 Aggregated neutrophil extracellular traps limit inflammation by degrading cytokines and chemokines Christine Schauer, Christina
Supplemental Materials. STK16 regulates actin dynamics to control Golgi organization and cell cycle
 Supplemental Materials STK16 regulates actin dynamics to control Golgi organization and cell cycle Juanjuan Liu 1,2,3, Xingxing Yang 1,3, Binhua Li 1, Junjun Wang 1,2, Wenchao Wang 1, Jing Liu 1, Qingsong
Supplementary Figure 1
 Supplementary Figure 1 Expression of apoptosis-related genes in tumor T reg cells. (a) Identification of FOXP3 T reg cells by FACS. CD45 + cells were gated as enriched lymphoid cell populations with low-granularity.
Supplementary material. VAMP7 controls T cell activation by regulating recruitment and phosphorylation of vesicular
 Supplementary material VAMP7 controls T cell activation by regulating recruitment and phosphorylation of vesicular Lat to the TCR activation sites. Paola Larghi, David J Williamson, Jean-Marie Carpier,
Supplemental Table I
 Supplemental Table I Cortex Hippocampus Age (weeks) Genotype STE 61 pste 61 STE 61 pste 61 8 100.0 ± 4.4 96.2 ± 6.0 99.8 ± 8.7 167.5 ± 7.8* 100.0 ± 7.0 90.5 ± 13.8 100.0 ± 12.8 260.4 ± 33.9** 12 100.0
Inhibition of DYRK1A stimulates human beta-cell proliferation
 Inhibition of DYRK1A stimulates human beta-cell proliferation Ercument Dirice 1,, Deepika Walpita 2,, Amedeo Vetere 2, Bennett C. Meier 2,5, Sevim Kahraman 1, Jiang Hu 1, Vlado Dančík 2, Sean M. Burns
HSP72 HSP90. Quadriceps Muscle. MEF2c MyoD1 MyoG Myf5 Hsf1 Hsp GLUT4/GAPDH (AU)
") Supplementary Figure 1. Impaired insulin action in HSP72 deficient muscle and myotubes in culture cannot be explained by altered myogenesis or reduced total GLUT4 expression. Genes associated with myogenesis
Supplementary Figure 1. Impaired insulin action in HSP72 deficient muscle and myotubes in culture cannot be explained by altered myogenesis or reduced total GLUT4 expression. Genes associated with myogenesis
Intracellular MHC class II molecules promote TLR-triggered innate. immune responses by maintaining Btk activation
 Intracellular MHC class II molecules promote TLR-triggered innate immune responses by maintaining Btk activation Xingguang Liu, Zhenzhen Zhan, Dong Li, Li Xu, Feng Ma, Peng Zhang, Hangping Yao and Xuetao
A263 A352 A204. Pan CK. pstat STAT3 pstat3 STAT3 pstat3. Columns Columns 1-6 Positive control. Omentum. Rectosigmoid A195.
 pstat3 75 Pan CK A A263 A352 A24 B Columns 1-6 Positive control A195 A22 A24 A183 Rectal Nodule STAT3 pstat3 STAT3 pstat3 Columns 7-12 Omentum Rectosigmoid Left Ovary Right Ovary Omentum Uterus Uterus
ras Multikinase Inhibitor Multikinase Inhibitor 0.1
 a ras ** * ** * ** ** ** ** un in et m lu Se ib SL G 32 W 7 So 50 ra 74 fe ni b LY W 294 or 0 tm 02 R an ap n a in Ev my er cin ol im BE us Z2 3 En P 5 za I13 st 0 au rin D as SP ati 60 nib C 012 is 5
Supplementary Materials for
 www.sciencesignaling.org/cgi/content/full/6/271/ra25/dc1 Supplementary Materials for Phosphoproteomic Analysis Implicates the mtorc2-foxo1 Axis in VEGF Signaling and Feedback Activation of Receptor Tyrosine
Supplementary Figure S1. Flow cytometric analysis of the expression of Thy1 in NH cells. Flow cytometric analysis of the expression of T1/ST2 and
 Supplementary Figure S1. Flow cytometric analysis of the expression of Thy1 in NH cells. Flow cytometric analysis of the expression of T1/ST2 and Thy1 in NH cells derived from the lungs of naïve mice.
SUPPLEMENTARY INFORMATION
 Supplementary Figure 1. Behavioural effects of ketamine in non-stressed and stressed mice. Naive C57BL/6 adult male mice (n=10/group) were given a single dose of saline vehicle or ketamine (3.0 mg/kg,
Figure S1. ERBB3 mrna levels are elevated in Luminal A breast cancers harboring ERBB3
 Supplemental Figure Legends. Figure S1. ERBB3 mrna levels are elevated in Luminal A breast cancers harboring ERBB3 ErbB3 gene copy number gain. Supplemental Figure S1. ERBB3 mrna levels are elevated in
Cornstarch
 Electronic Supplementary Material (ESI) for Food & Function. This journal is The Royal Society of Chemistry 2018 Supplementary data : Supplementary Table 1: Diet composition (g/kg) on the basis of the