NOD-like receptor signaling and inflammasome-related pathways are highlighted in psoriatic epidermis
|
|
|
- Camilla Lloyd
- 5 years ago
- Views:
Transcription
1 Supplementary Information NOD-like receptor signaling and inflammasome-related pathways are highlighted in psoriatic epidermis Mari H. Tervaniemi, Shintaro Katayama, Tiina Skoog, H. Annika Siitonen, Jyrki Vuola, Kristo Nuutila, Raija Sormunen, Anna Johnsson, Sten Linnarsson, Sari Suomela, Esko Kankuri, Juha Kere, and Outi Elomaa

.")


")
2 a b c PL.09 PN.09 C.05 d Figure S1. Split-thickness skin grafts (SG). The SGs consist mainly of the epidermis, as seen from the figures (a), (b), and (c). The samples were harvested using a dermatome (Zimmer ) with fixed setting for thickness (d). a b
 (a), lysosome (Run2; Run1 shown in Figure 1) (b), and pathways in")
 shows only the downregulated genes.")
3 c Figure S2. Gene expression profiles of up- and downregulated pathways in psoriatic lesions. Heat maps of genes involved in the NLR signaling (Run2; Run1 shown in Figure 1) (a), lysosome (Run2; Run1 shown in Figure 1) (b), and pathways in cancer (c). Lysosome includes several V-ATPase and cathepsin genes that are upregulated in PL samples. Pathways in cancer is identifiable among both the upregulated and downregulated DEGs of PL. The heat map (c) shows only the downregulated genes. Color key: red represents upregulation and blue downregulation, according to the intensity of the color (row Z-score).
4
5
6
7
8 Figure S3. Expression of the NLR-pathway key component transcripts shown in box plots. Plots are based on the spike-in normalized gene expression data of RNAseq. a qpcr primers: Forward Reverse CARD6 AGGCGACCTGTCAGCATTTT TTAAAACTTCATGCCTTAAGCCGC IFI16 AACCACGTTGAAACCAAGACT TGCGTTCAGCACCATCACTT PYCARD GTTCAAGCTGAAGCTGCTGTCG GTGAGGTCCAAGGCGTCCAT IL8 TCTGTGTGAAGGTGCAGTTTTG TGGGGTGGAAAGGTTTGGAGT RPLP13 CTCAAGGTCGTGCGTCTGAA TGGCTGTCACTGCCTGGTACT GAPDH GAGTCAACGGATTTGGTCGT CATGGGTGGAATCATATTGG


 IEM of PL skin shows PYCARD clusters in")


9 Normal rabbit IgG NOD2 PYCARD b PL.02 PL.08 c d NLRP10 CARD6 e PL PN C f Figure S4. Expression of the NLR-signaling related genes in psoriatic and control epidermis. (a) Confirmation of changes in the expression of CARD6, IFI16, PYCARD, and IL8, with qpcr. Two control genes were used for normalization: RPLP13 and GAPHD. The samples were compared to the sample C.04, which therefore has the value 1. (b) NOD2 has induced expression in PL epidermis, which varies between individuals: staining in PL.02 sample is moderate whereas in PL.08 it is highly upregulated when compared with corresponding PN samples. (c) IEM of PL skin shows PYCARD clusters in connection with membrane structures that resemble desmosomes. (d) In the higher magnification of immunostaining in PL skin CARD6 is observable as cytoplasmic granules. The IEM reveals abundant CARD6 in keratinocyte contacts as well. (e) Immunohistochemistry (IH) with antibody against NLRP10 reveals strong expression in control as well as in psoriatic skin (PL and PN). (f) Control stainings with normal rabbit IgG are negative. IH scale bars: 50μm. IEM scale bars: 500nm.
10 Figure S5. Expression of the fibroblast marker genes shown in box plots. Plots are based on the spike-in normalized gene expression data of RNAseq. The Run1 contains samples: 02C, 04C, 05C, 07C, 10C, 11C, 12C, 02PN, 03PN, 06PN, 02PL, 03PL, 06PL, and 08PL. The Run2 contains samples: 02C, 04C, 05C, 07C, 09C, 10C, 11C, 12C, 14C, 05PN, 09PN, 05PL, and 09PL. All the triplicates of each sample are shown as pink spots. We selected the fibroblast markers COL3A1 and COL1A2 and examined their expression. We could see a slight decrease in the expression of these markers in some of the samples, which might be due to the thickened architecture of the epidermis.
11 a b
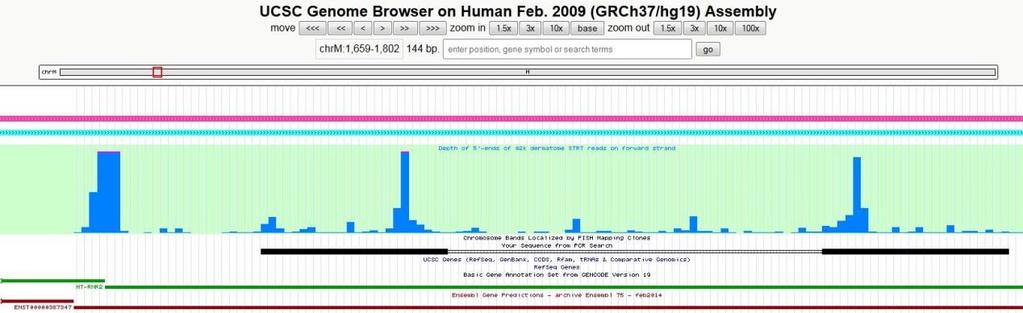


12 c chrm:1673 GCTAAACCTAGCCCCAAACCCACTCCACCTTACTACCAG (~ 95% of total alignments at this site) d
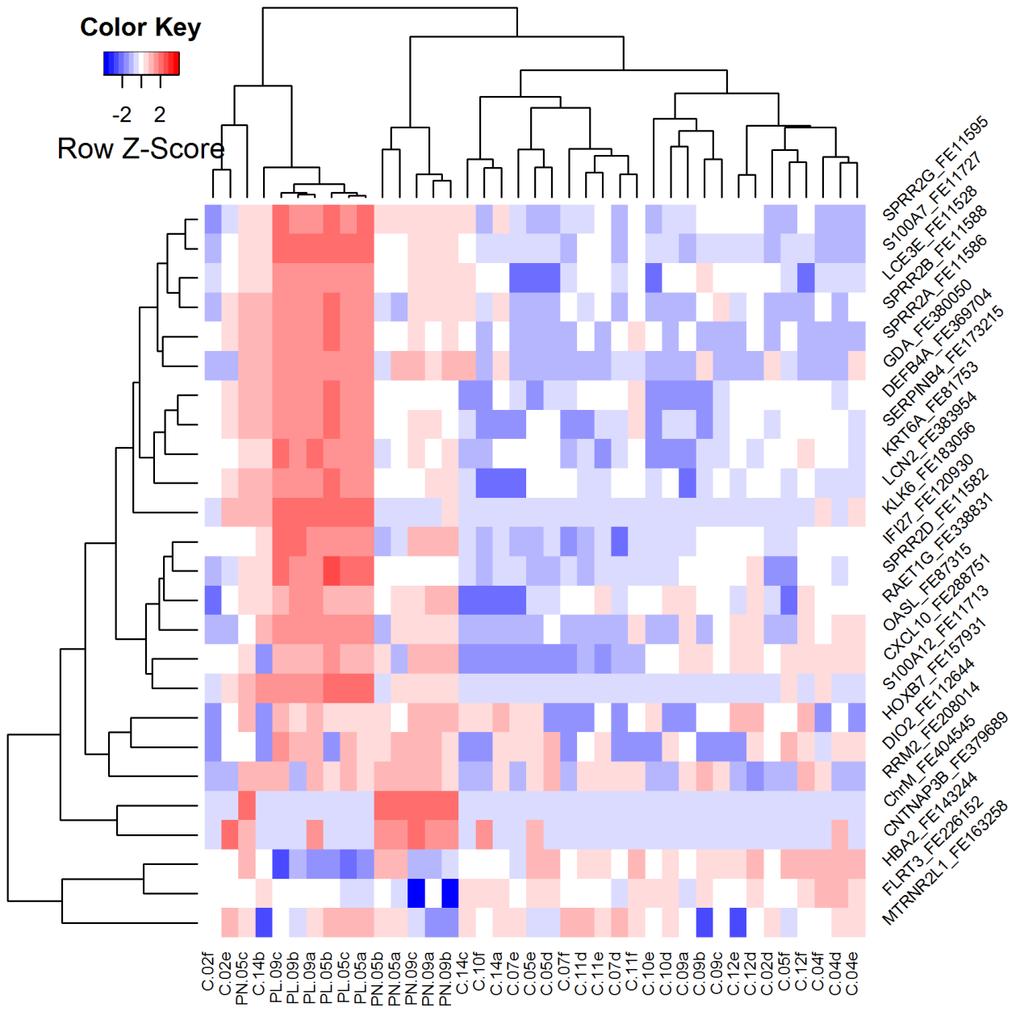
13 Fold change e qpcr primers: Forward Reverse MTRNR2 (FE404545) CACTCCACCTTACTACCAGACAAC GGTACTATATCTATTGCGCCAGGT MTRNR2L1 (FE163258) AGGACATCCCAATGGTGCAG ACCTGGATTACTCCGGTCTGA RNA18S5 GTGAAACTGCGAATGGCTC CGTCGGCATGTATTAGCTC Mottaghi-Dastjerdi et al. 2014: MTRNR2L1 (FE163258) CGCAGGCCCTAAACTACCAG TGCTACTGTCGATGTGGACC 2,5 2 1,5 1 MTRNR2 Mottaghi-MTRNR2L1 MTRNR2L1 0,5 0 C.05 C.07 PN.02 PN.05 PL.02 PL.05 Figure S6: Differentially expressed genes in non-lesional psoriatic skin. (a) Heat map of DEGs from the PNvsC comparison; gene expressions in samples (PL, PN, and C) of the Run2. Color key: red represents upregulated and blue downregulated expression levels according to the intensity of the color (row Z-score). The gene name includes transcript first exon (TFE) code. The most highly upregulated transcript in PN samples, ChrM_FE404545, represents MTRNR2 and shows no induction in PL. Heat map of the Run1 is shown in Figure 5. (b) Box plots of ChrM_FE404545_o and MTRNR2L1_FE163258_c. Plots are based on the spike-in normalized gene expression data of RNAseq. (c) Chromosomal localization of C.02 reads shown in UCSC genome browser: ChrM_FE404545_o reads map at the start site of the MTRNR2 gene and (d) MTRNR2L1 reads align with the 3 -end region of the gene. (e) MTRNR2 and MTRNR2L1 expressions were studied in SG samples (PL, PN, and C) by qpcr. Here presented data from a representative experiment where RNA18S5 was used as a reference and the data compared here to C.05 (PCR target regions shown in c and d). We were unable to detect significant difference between the sample groups with qpcr.
NOD-like receptor signaling and inflammasome-related pathways are highlighted in psoriatic epidermis. Tervaniemi, Mari H.
 https://helda.helsinki.fi NOD-like receptor signaling and inflammasome-related pathways are highlighted in psoriatic epidermis Tervaniemi, Mari H. 2016-03-15 Tervaniemi, M H, Katayama, S, Skoog, T, Siitonen,
SUPPLEMENTARY INFORMATION
 DOI:.38/ncb3399 a b c d FSP DAPI 5mm mm 5mm 5mm e Correspond to melanoma in-situ Figure a DCT FSP- f MITF mm mm MlanaA melanoma in-situ DCT 5mm FSP- mm mm mm mm mm g melanoma in-situ MITF MlanaA mm mm
Nature Structural & Molecular Biology: doi: /nsmb Supplementary Figure 1
 Supplementary Figure 1 Effect of HSP90 inhibition on expression of endogenous retroviruses. (a) Inducible shrna-mediated Hsp90 silencing in mouse ESCs. Immunoblots of total cell extract expressing the
Supplementary Figure S1. Gene expression analysis of epidermal marker genes and TP63.
 Supplementary Figure Legends Supplementary Figure S1. Gene expression analysis of epidermal marker genes and TP63. A. Screenshot of the UCSC genome browser from normalized RNAPII and RNA-seq ChIP-seq data
Supplementary Figure 1: TSLP receptor skin expression in dcssc. A: Healthy control (HC) skin with TSLP receptor expression in brown (10x
 skin with TSLP receptor expression in brown (10x") Supplementary Figure 1: TSLP receptor skin expression in dcssc. A: Healthy control (HC) skin with TSLP receptor expression in brown (10x magnification). B: Second HC skin stained for TSLP receptor in brown
Supplementary Figure 1: TSLP receptor skin expression in dcssc. A: Healthy control (HC) skin with TSLP receptor expression in brown (10x magnification). B: Second HC skin stained for TSLP receptor in brown
Supplementary Figures
 Supplementary Figures Supplementary Figure 1. Confirmation of Dnmt1 conditional knockout out mice. a, Representative images of sorted stem (Lin - CD49f high CD24 + ), luminal (Lin - CD49f low CD24 + )
7SK ChIRP-seq is specifically RNA dependent and conserved between mice and humans.
 Supplementary Figure 1 7SK ChIRP-seq is specifically RNA dependent and conserved between mice and humans. Regions targeted by the Even and Odd ChIRP probes mapped to a secondary structure model 56 of the
Supplementary Figure 1. Spitzoid Melanoma with PPFIBP1-MET fusion. (a) Histopathology (4x) shows a domed papule with melanocytes extending into the
 Histopathology (4x) shows a domed papule with melanocytes extending into the") Supplementary Figure 1. Spitzoid Melanoma with PPFIBP1-MET fusion. (a) Histopathology (4x) shows a domed papule with melanocytes extending into the deep dermis. (b) The melanocytes demonstrate abundant
Supplementary Figure 1. Spitzoid Melanoma with PPFIBP1-MET fusion. (a) Histopathology (4x) shows a domed papule with melanocytes extending into the deep dermis. (b) The melanocytes demonstrate abundant
Table S1. Relative abundance of AGO1/4 proteins in different organs. Table S2. Summary of smrna datasets from various samples.
 Supplementary files Table S1. Relative abundance of AGO1/4 proteins in different organs. Table S2. Summary of smrna datasets from various samples. Table S3. Specificity of AGO1- and AGO4-preferred 24-nt
Supplementary Figure 1 The ability to regenerate an ear hole is discontinuous with wound healing. Ear-hole closure at D85 for each sex within each
 Supplementary Figure 1 The ability to regenerate an ear hole is discontinuous with wound healing. Ear-hole closure at D85 for each sex within each species observed. Data show a binary response to a 4 mm
fl/+ KRas;Atg5 fl/+ KRas;Atg5 fl/fl KRas;Atg5 fl/fl KRas;Atg5 Supplementary Figure 1. Gene set enrichment analyses. (a) (b)
 (b)") KRas;At KRas;At KRas;At KRas;At a b Supplementary Figure 1. Gene set enrichment analyses. (a) GO gene sets (MSigDB v3. c5) enriched in KRas;Atg5 fl/+ as compared to KRas;Atg5 fl/fl tumors using gene set
KRas;At KRas;At KRas;At KRas;At a b Supplementary Figure 1. Gene set enrichment analyses. (a) GO gene sets (MSigDB v3. c5) enriched in KRas;Atg5 fl/+ as compared to KRas;Atg5 fl/fl tumors using gene set
Supplementary Figure 1: Fn14 is upregulated in the epidermis and dermis of mice
 Supplementary Figure 1: Fn14 is upregulated in the epidermis and dermis of mice undergoing AD- and psoriasis-like disease. Immunofluorescence staining for Fn14 (green) and DAPI (blue) in skin of naïve
SUPPLEMENTARY APPENDIX
 SUPPLEMENTARY APPENDIX 1) Supplemental Figure 1. Histopathologic Characteristics of the Tumors in the Discovery Cohort 2) Supplemental Figure 2. Incorporation of Normal Epidermal Melanocytic Signature
MII. Supplement Figure 1. CapZ β2. Merge. 250ng. 500ng DIC. Merge. Journal of Cell Science Supplementary Material. GFP-CapZ β2 DNA
 A GV GVBD MI DNA CapZ β2 CapZ β2 Merge B DIC GFP-CapZ β2 Merge CapZ β2-gfp 250ng 500ng Supplement Figure 1. MII A early MI late MI Control RNAi CapZαβ DNA Actin Tubulin B Phalloidin Intensity(A.U.) n=10
SUPPLEMENTARY INFORMATION
 doi:.38/nature8975 SUPPLEMENTAL TEXT Unique association of HOTAIR with patient outcome To determine whether the expression of other HOX lincrnas in addition to HOTAIR can predict patient outcome, we measured
Supplementary Figure 1. Expression of phospho-sik3 in normal and osteoarthritic articular cartilage in the knee. (a) Semiserial histological sections
 Semiserial histological sections") Supplementary Figure 1. Expression of phospho-sik3 in normal and osteoarthritic articular cartilage in the knee. (a) Semiserial histological sections of normal cartilage were stained with safranin O-fast
Supplementary Figure 1. Expression of phospho-sik3 in normal and osteoarthritic articular cartilage in the knee. (a) Semiserial histological sections of normal cartilage were stained with safranin O-fast
Nature Genetics: doi: /ng Supplementary Figure 1. Assessment of sample purity and quality.
 Supplementary Figure 1 Assessment of sample purity and quality. (a) Hematoxylin and eosin staining of formaldehyde-fixed, paraffin-embedded sections from a human testis biopsy collected concurrently with
Supplemental Figure S1. Tertiles of FKBP5 promoter methylation and internal regulatory region
 Supplemental Figure S1. Tertiles of FKBP5 promoter methylation and internal regulatory region methylation in relation to PSS and fetal coupling. A, PSS values for participants whose placentas showed low,
Supplementary Table 1. The primers used for quantitative RT-PCR. Gene name Forward (5 > 3 ) Reverse (5 > 3 )
 Reverse (5 > 3 )") 770 771 Supplementary Table 1. The primers used for quantitative RT-PCR. Gene name Forward (5 > 3 ) Reverse (5 > 3 ) Human CXCL1 GCGCCCAAACCGAAGTCATA ATGGGGGATGCAGGATTGAG PF4 CCCCACTGCCCAACTGATAG TTCTTGTACAGCGGGGCTTG
770 771 Supplementary Table 1. The primers used for quantitative RT-PCR. Gene name Forward (5 > 3 ) Reverse (5 > 3 ) Human CXCL1 GCGCCCAAACCGAAGTCATA ATGGGGGATGCAGGATTGAG PF4 CCCCACTGCCCAACTGATAG TTCTTGTACAGCGGGGCTTG
Figure S1. A Non-lesional Lesional
 Figure S1 Non-lesional Lesional GEN1 Non-lesional GEN1 Lesional C Normal Negative control Figure S1. Dermal Populations of + cells are found in human skin. Immunohistochemistry for on fixed, frozen skin
Effects of UBL5 knockdown on cell cycle distribution and sister chromatid cohesion
 Supplementary Figure S1. Effects of UBL5 knockdown on cell cycle distribution and sister chromatid cohesion A. Representative examples of flow cytometry profiles of HeLa cells transfected with indicated
Supplementary Figure 1 Induction of cellular senescence and isolation of exosome. a to c, Pre-senescent primary normal human diploid fibroblasts
 Supplementary Figure 1 Induction of cellular senescence and isolation of exosome. a to c, Pre-senescent primary normal human diploid fibroblasts (TIG-3 cells) were rendered senescent by either serial passage
Supplementary Figure 1
 A B D Relative TAp73 mrna p73 Supplementary Figure 1 25 2 15 1 5 p63 _-tub. MDA-468 HCC1143 HCC38 SUM149 MDA-468 HCC1143 HCC38 SUM149 HCC-1937 MDA-MB-468 ΔNp63_ TAp73_ TAp73β E C Relative ΔNp63 mrna TAp73
SUPPLEMENTARY FIGURE LEGENDS
 SUPPLEMENTARY FIGURE LEGENDS Supplementary Figure 1. Hippocampal sections from new-born Pten+/+ and PtenFV/FV pups were stained with haematoxylin and eosin (H&E) and were imaged at (a) low and (b) high
Supplementary Figures
 Supplementary Figures Supplementary Figure 1 Characterization of stable expression of GlucB and sshbira in the CT26 cell line (a) Live cell imaging of stable CT26 cells expressing green fluorescent protein
Supplementary Figure 1 IL-27 IL
 Tim-3 Supplementary Figure 1 Tc0 49.5 0.6 Tc1 63.5 0.84 Un 49.8 0.16 35.5 0.16 10 4 61.2 5.53 10 3 64.5 5.66 10 2 10 1 10 0 31 2.22 10 0 10 1 10 2 10 3 10 4 IL-10 28.2 1.69 IL-27 Supplementary Figure 1.
SSM signature genes are highly expressed in residual scar tissues after preoperative radiotherapy of rectal cancer.
 Supplementary Figure 1 SSM signature genes are highly expressed in residual scar tissues after preoperative radiotherapy of rectal cancer. Scatter plots comparing expression profiles of matched pretreatment
Tcf21 MCM ; R26 mtmg Sham GFP Col 1/3 TAC 8W TAC 2W. Postn MCM ; R26 mtmg Sham GFP Col 1/3 TAC 8W TAC 2W
 A Tcf21 MCM ; R26 mtmg Sham GFP Col 1/3 Tcf21 MCM ; R26 mtmg TAC 2W Tcf21 MCM ; R26 mtmg TAC 8W B Postn MCM ; R26 mtmg Sham GFP Col 1/3 Postn MCM ; R26 mtmg TAC 2W Postn MCM ; R26 mtmg TAC 8W Supplementary
Supplementary Figures
 Supplementary Figures a miel1-2 (SALK_41369).1kb miel1-1 (SALK_978) b TUB MIEL1 Supplementary Figure 1. MIEL1 expression in miel1 mutant and S:MIEL1-MYC transgenic plants. (a) Mapping of the T-DNA insertion
Name Animal source Vendor Cat # Dilutions
 Supplementary data Table S1. Primary and Secondary antibody sources Devi et al, TXNIP in mitophagy A. Primary Antibodies Name Animal source Vendor Cat # Dilutions 1. TXNIP mouse MBL KO205-2 1:2000 (WB)
Supplemental Information. Derivation of Human Trophoblast Stem Cells
 Cell Stem Cell, Volume 22 Supplemental Information Derivation of Human Trophoblast Stem Cells Hiroaki Okae, Hidehiro Toh, Tetsuya Sato, Hitoshi Hiura, Sota Takahashi, Kenjiro Shirane, Yuka Kabayama, Mikita
SUPPLEMENTARY FIGURES AND TABLES
 SUPPLEMENTARY FIGURES AND TABLES Supplementary Figure S1: CaSR expression in neuroblastoma models. A. Proteins were isolated from three neuroblastoma cell lines and from the liver metastasis of a MYCN-non
!! INL!!!! ONL!! IS/OS!!
 SUPPLEMENTARY FIGURES GCL INL ONL IS/OS RPE Choroid GR MR A B C HSD2 Cc RPE CV D Cc RPE CV E RPE Cc CV F RPE Cc CV Figure S1 Figure S1: Immunohistochemistry eidence for glucocorticoid receptor (GR), mineralocorticoid
GENE EXPRESSION AND FUNCTIONAL STUDIES ON PSORIATIC EPIDERMIS
 GENE EXPRESSION AND FUNCTIONAL STUDIES ON PSORIATIC EPIDERMIS Mari Hannele Tervaniemi Department of Medical and Clinical Genetics Medicum, Research Programs Unit Faculty of Medicine Doctoral Programmes
CHAPTER 5 RESULTS Previous study: cell culture and organotypical slices
 45 CHAPTER 5 RESULTS 5.1. Previous study: cell culture and organotypical slices Initial experiments have been conducted to ensure that the tet-on system works. A neuronal cell culture from mice expressing
nature methods Organelle-specific, rapid induction of molecular activities and membrane tethering
 nature methods Organelle-specific, rapid induction of molecular activities and membrane tethering Toru Komatsu, Igor Kukelyansky, J Michael McCaffery, Tasuku Ueno, Lidenys C Varela & Takanari Inoue Supplementary
a) List of KMTs targeted in the shrna screen. The official symbol, KMT designation,
 List of KMTs targeted in the shrna screen. The official symbol, KMT designation,") Supplementary Information Supplementary Figures Supplementary Figure 1. a) List of KMTs targeted in the shrna screen. The official symbol, KMT designation, gene ID and specifities are provided. Those highlighted
Supplementary Information Supplementary Figures Supplementary Figure 1. a) List of KMTs targeted in the shrna screen. The official symbol, KMT designation, gene ID and specifities are provided. Those highlighted
Nature Immunology: doi: /ni Supplementary Figure 1. Gene expression profile of CD4 + T cells and CTL responses in Bcl6-deficient mice.
 Supplementary Figure 1 Gene expression profile of CD4 + T cells and CTL responses in Bcl6-deficient mice. (a) Gene expression profile in the resting CD4 + T cells were analyzed by an Affymetrix microarray
Supplemental Data. Integrating omics and alternative splicing i reveals insights i into grape response to high temperature
 Supplemental Data Integrating omics and alternative splicing i reveals insights i into grape response to high temperature Jianfu Jiang 1, Xinna Liu 1, Guotian Liu, Chonghuih Liu*, Shaohuah Li*, and Lijun
Supplementary Information Titles Journal: Nature Medicine
 Supplementary Information Titles Journal: Nature Medicine Article Title: Corresponding Author: Supplementary Item & Number Supplementary Fig.1 Fig.2 Fig.3 Fig.4 Fig.5 Fig.6 Fig.7 Fig.8 Fig.9 Fig. Fig.11
Novel PRD-like homeodomain transcription factors and retrotransposon elements in early human
 Novel PRD-like homeodomain transcription factors and retrotransposon elements in early human development Virpi öhönen, Shintaro Katayama, Liselotte Vesterlund, Eeva-Mari Jouhilahti, Mona Sheikhi, Elo Madissoon,
Supplementary information CD4 T cells are required for both development and maintenance of disease in a new model of reversible colitis
 Supplementary information CD4 T cells are required for both development and maintenance of disease in a new model of reversible colitis rasseit and Steiner et al. .. Supplementary Figure 1 % of initial
SUPPLEMENTARY INFORMATION
 DOI: 10.1038/ncb2535 Figure S1 SOX10 is expressed in human giant congenital nevi and its expression in human melanoma samples suggests that SOX10 functions in a MITF-independent manner. a, b, Representative
Supplementary Figure 1 ITGB1 and ITGA11 increase with evidence for heterodimers following HSC activation. (a) Time course of rat HSC activation
 Time course of rat HSC activation") Supplementary Figure 1 ITGB1 and ITGA11 increase with evidence for heterodimers following HSC activation. (a) Time course of rat HSC activation indicated by the detection of -SMA and COL1 (log scale).
Supplementary Figure 1 ITGB1 and ITGA11 increase with evidence for heterodimers following HSC activation. (a) Time course of rat HSC activation indicated by the detection of -SMA and COL1 (log scale).
SUPPLEMENTARY INFORMATION
 -. -. SUPPLEMENTARY INFORMATION DOI: 1.1/ncb86 a WAT-1 WAT- BAT-1 BAT- sk-muscle-1 sk-muscle- mir-133b mir-133a mir-6 mir-378 mir-1 mir-85 mir-378 mir-6a mir-18 mir-133a mir- mir- mir-341 mir-196a mir-17
EPIGENETIC RE-EXPRESSION OF HIF-2α SUPPRESSES SOFT TISSUE SARCOMA GROWTH
 EPIGENETIC RE-EXPRESSION OF HIF-2α SUPPRESSES SOFT TISSUE SARCOMA GROWTH Supplementary Figure 1. Supplementary Figure 1. Characterization of KP and KPH2 autochthonous UPS tumors. a) Genotyping of KPH2
SUPPLEMENTARY FIGURES AND TABLE
 SUPPLEMENTARY FIGURES AND TABLE Supplementary Figure S1: Characterization of IRE1α mutants. A. U87-LUC cells were transduced with the lentiviral vector containing the GFP sequence (U87-LUC Tet-ON GFP).
Supplementary Figure S1. Monolayer differentiation of mouse ESCs into telencephalic neural precursors. (a) Schematic representation of the protocols
 Schematic representation of the protocols") Supplementary Figure S1. Monolayer differentiation of mouse ESCs into telencephalic neural precursors. (a) Schematic representation of the protocols used to differentiate mouse ESCs. (b) Representative
Supplementary Figure S1. Monolayer differentiation of mouse ESCs into telencephalic neural precursors. (a) Schematic representation of the protocols used to differentiate mouse ESCs. (b) Representative
SUPPLEMENTARY INFORMATION
 DOI: 10.1038/ncb2638 Figure S1 Morphological characteristics of fetal testes and ovaries from 6.5-20 developmental weeks. Representative images of Hematoxylin and Eosin staining of testes and ovaries over
SUPPLEMENTARY INFORMATION
 SUPPLEMENTARY INFORMATION Supplementary Figure 1. Long-term protection studies. 45 minutes of ischemia was induced in wild type (S1pr2 +/+ ) and S1pr2 -/- by MCAO. A) 5 days later brains were harvested
gliomas. Fetal brain expected who each low-
 Supplementary Figure S1. Grade-specificity aberrant expression of HOXA genes in gliomas. (A) Representative RT-PCR analyses of HOXA gene expression in human astrocytomas. Exemplified glioma samples include
Supplementary Figure 1 IMQ-Induced Mouse Model of Psoriasis. IMQ cream was
 Supplementary Figure 1 IMQ-Induced Mouse Model of Psoriasis. IMQ cream was painted on the shaved back skin of CBL/J and BALB/c mice for consecutive days. (a, b) Phenotypic presentation of mouse back skin
Nature Genetics: doi: /ng Supplementary Figure 1. HOX fusions enhance self-renewal capacity.
 Supplementary Figure 1 HOX fusions enhance self-renewal capacity. Mouse bone marrow was transduced with a retrovirus carrying one of three HOX fusion genes or the empty mcherry reporter construct as described
Nature Immunology: doi: /ni Supplementary Figure 1. RNA-Seq analysis of CD8 + TILs and N-TILs.
 Supplementary Figure 1 RNA-Seq analysis of CD8 + TILs and N-TILs. (a) Schematic representation of the tumor and cell types used for the study. HNSCC, head and neck squamous cell cancer; NSCLC, non-small
SHREE ET AL, SUPPLEMENTAL MATERIALS. (A) Workflow for tumor cell line derivation and orthotopic implantation.
 Workflow for tumor cell line derivation and orthotopic implantation.") SHREE ET AL, SUPPLEMENTAL MATERIALS SUPPLEMENTAL FIGURE AND TABLE LEGENDS Supplemental Figure 1. Derivation and characterization of TS1-TGL and TS2-TGL PyMT cell lines and development of an orthotopic
SHREE ET AL, SUPPLEMENTAL MATERIALS SUPPLEMENTAL FIGURE AND TABLE LEGENDS Supplemental Figure 1. Derivation and characterization of TS1-TGL and TS2-TGL PyMT cell lines and development of an orthotopic
SUPPLEMENTARY INFORMATION
 DOI: 10.1038/ncb3200 Supplementary Figure 1 Expression analysis of stomach markers in gutlike structure. (a) Differentiation scheme of gut-like structure formation from embryonic stem cells. (b) RT-PCR
Supplemental Figure 1. Genes showing ectopic H3K9 dimethylation in this study are DNA hypermethylated in Lister et al. study.
 mc mc mc mc SUP mc mc Supplemental Figure. Genes showing ectopic HK9 dimethylation in this study are DNA hypermethylated in Lister et al. study. Representative views of genes that gain HK9m marks in their
Dynamic Interaction of Stress Granule, DDX3X and IKK-α Mediates Multiple Functions in
 Dynamic Interaction of Stress Granule, and Mediates Multiple Functions in Hepatitis C Virus Infection Véronique Pène, Qisheng Li#, Catherine Sodroski, Ching-Sheng Hsu, T. Jake Liang# Liver Diseases Branch,
SUPPLEMENTARY INFORMATION
 doi: 1.138/nature8645 Physical coverage (x haploid genomes) 11 6.4 4.9 6.9 6.7 4.4 5.9 9.1 7.6 125 Neither end mapped One end mapped Chimaeras Correct Reads (million ns) 1 75 5 25 HCC1187 HCC1395 HCC1599
(A) RT-PCR for components of the Shh/Gli pathway in normal fetus cell (MRC-5) and a
 RT-PCR for components of the Shh/Gli pathway in normal fetus cell (MRC-5) and a") Supplementary figure legends Supplementary Figure 1. Expression of Shh signaling components in a panel of gastric cancer. (A) RT-PCR for components of the Shh/Gli pathway in normal fetus cell (MRC-5) and
Supplementary figure legends Supplementary Figure 1. Expression of Shh signaling components in a panel of gastric cancer. (A) RT-PCR for components of the Shh/Gli pathway in normal fetus cell (MRC-5) and
Nature Structural & Molecular Biology: doi: /nsmb.2419
 Supplementary Figure 1 Mapped sequence reads and nucleosome occupancies. (a) Distribution of sequencing reads on the mouse reference genome for chromosome 14 as an example. The number of reads in a 1 Mb
SUPPLEMENTAL INFORMATIONS
 1 SUPPLEMENTAL INFORMATIONS Figure S1 Cumulative ZIKV production by testis explants over a 9 day-culture period. Viral titer values presented in Figure 1B (viral release over a 3 day-culture period measured
Nature Neuroscience: doi: /nn Supplementary Figure 1
 Supplementary Figure 1 EGFR inhibition activates signaling pathways (a-b) EGFR inhibition activates signaling pathways (a) U251EGFR cells were treated with erlotinib (1µM) for the indicated times followed
Comparison of open chromatin regions between dentate granule cells and other tissues and neural cell types.
 Supplementary Figure 1 Comparison of open chromatin regions between dentate granule cells and other tissues and neural cell types. (a) Pearson correlation heatmap among open chromatin profiles of different
Supplemental Figure S1. PLAG1 kidneys contain fewer glomeruli (A) Quantitative PCR for Igf2 and PLAG1 in whole kidneys taken from mice at E15.
 Quantitative PCR for Igf2 and PLAG1 in whole kidneys taken from mice at E15.") Supplemental Figure S1. PLAG1 kidneys contain fewer glomeruli (A) Quantitative PCR for Igf2 and PLAG1 in whole kidneys taken from mice at E15.5, E18.5, P4, and P8. Values shown are means from four technical
Supplemental Figure S1. PLAG1 kidneys contain fewer glomeruli (A) Quantitative PCR for Igf2 and PLAG1 in whole kidneys taken from mice at E15.5, E18.5, P4, and P8. Values shown are means from four technical
MODULE 4: SPLICING. Removal of introns from messenger RNA by splicing
 Last update: 05/10/2017 MODULE 4: SPLICING Lesson Plan: Title MEG LAAKSO Removal of introns from messenger RNA by splicing Objectives Identify splice donor and acceptor sites that are best supported by
Supplementary Materials for
 www.sciencesignaling.org/cgi/content/full/8/375/ra41/dc1 Supplementary Materials for Actin cytoskeletal remodeling with protrusion formation is essential for heart regeneration in Hippo-deficient mice
Nature Biotechnology: doi: /nbt Supplementary Figure 1. Binding capacity of DNA-barcoded MHC multimers and recovery of antigen specificity
 Supplementary Figure 1 Binding capacity of DNA-barcoded MHC multimers and recovery of antigen specificity (a, b) Fluorescent-based determination of the binding capacity of DNA-barcoded MHC multimers (+barcode)
Endocannabinoid-activated Nlrp3 inflammasome in infiltrating macrophages mediates β- cell loss in type 2 diabetes
 Endocannabinoid-activated Nlrp3 inflammasome in infiltrating macrophages mediates β- cell loss in type 2 diabetes T Jourdan, G Godlewski, R Cinar, A Bertola, G Szanda, J Liu, J Tam, T Han, B Mukhopadhyay,
SUPPLEMENTARY INFORMATION
 DOI: 10.1038/ncb3311 A B TSC2 -/- MEFs C Rapa Hours WCL 0 6 12 24 36 pakt.s473 AKT ps6k S6K CM IGF-1 Recipient WCL - + - + - + pigf-1r IGF-1R pakt ps6 AKT D 1 st SILAC 2 nd SILAC E GAPDH FGF21 ALKPGVIQILGVK
Primer sequences Target Sequence F Sequence R TNF-α (Tnfa) TCAGCCGATTTGCTATCTCAT A
 TCAGCCGATTTGCTATCTCAT A") Supplementary Table 1. Q- and RT-PR primers used in this study. Primer sequences Target Sequence F Sequence R TNF-α (Tnfa) TGGTTTGTTTT GTTTGGGGTTG T hemokine (- motif) ligand 5 (cl5) GTGTTTGTTT TGGTGGTG
Supplementary Table 1. Q- and RT-PR primers used in this study. Primer sequences Target Sequence F Sequence R TNF-α (Tnfa) TGGTTTGTTTT GTTTGGGGTTG T hemokine (- motif) ligand 5 (cl5) GTGTTTGTTT TGGTGGTG
Islet viability assay and Glucose Stimulated Insulin Secretion assay RT-PCR and Western Blot
 Islet viability assay and Glucose Stimulated Insulin Secretion assay Islet cell viability was determined by colorimetric (3-(4,5-dimethylthiazol-2-yl)-2,5- diphenyltetrazolium bromide assay using CellTiter
Lentiviral Delivery of Combinatorial mirna Expression Constructs Provides Efficient Target Gene Repression.
 Supplementary Figure 1 Lentiviral Delivery of Combinatorial mirna Expression Constructs Provides Efficient Target Gene Repression. a, Design for lentiviral combinatorial mirna expression and sensor constructs.
Protection against doxorubicin-induced myocardial dysfunction in mice by cardiac-specific expression of carboxyl terminus of hsp70-interacting protein
 Protection against doxorubicin-induced myocardial dysfunction in mice by cardiac-specific expression of carboxyl terminus of hsp70-interacting protein Lei Wang 1, Tian-Peng Zhang 1, Yuan Zhang 2, Hai-Lian
Supplementary Figure 1. Ent inhibits LPO activity in a dose- and time-dependent fashion.
 Supplementary Information Supplementary Figure 1. Ent inhibits LPO activity in a dose- and time-dependent fashion. Various concentrations of Ent, DHBA or ABAH were pre-incubated for 10 min with LPO (50
Supplementary Figure 1: si-craf but not si-braf sensitizes tumor cells to radiation.
 Supplementary Figure 1: si-craf but not si-braf sensitizes tumor cells to radiation. (a) Embryonic fibroblasts isolated from wildtype (WT), BRAF -/-, or CRAF -/- mice were irradiated (6 Gy) and DNA damage
Set the stage: Genomics technology. Jos Kleinjans Dept of Toxicogenomics Maastricht University, the Netherlands
 Set the stage: Genomics technology Jos Kleinjans Dept of Toxicogenomics Maastricht University, the Netherlands Amendment to the latest consolidated version of the REACH legislation REACH Regulation 1907/2006:
Supplemental Figure 1. Egr1 expression in adult Achilles tendons. (A,B) Achilles tendons were isolated from 2 month-old Egr1 +/- mice and stained for
 Achilles tendons were isolated from 2 month-old Egr1 +/- mice and stained for") Supplemental Figure 1. Egr1 expression in adult Achilles tendons. (A,B) Achilles tendons were isolated from 2 month-old Egr1 +/- mice and stained for LacZ activity, which reflects Egr1 expression. (A)
Supplemental Figure 1. Egr1 expression in adult Achilles tendons. (A,B) Achilles tendons were isolated from 2 month-old Egr1 +/- mice and stained for LacZ activity, which reflects Egr1 expression. (A)
SUPPLEMENTARY FIGURE 1
 SUPPLEMENTARY FIGURE 1 A LN Cell count (1 ) 1 3 1 CD+ 1 1 CDL lo CD hi 1 CD+FoxP3+ 1 1 1 7 3 3 3 % of cells 9 7 7 % of cells CD+ 3 1 % of cells CDL lo CD hi 1 1 % of CD+ cells CD+FoxP3+ 3 1 % of CD+ T
Supplementary Figure 1 Cytokine receptors on developing thymocytes that can potentially signal Runx3d expression.
 Supplementary Figure 1 Cytokine receptors on developing thymocytes that can potentially signal Runx3d expression. (a) Characterization of c-independent SP8 cells. Stainings for maturation markers (top)
Primary Cilia Can Both Mediate and Suppress Hedgehog Pathway- Dependent Tumorigenesis (Supplementary Figures and Materials)
") Primary Cilia Can Both Mediate and Suppress Hedgehog Pathway- Dependent Tumorigenesis (Supplementary Figures and Materials) Sunny Y. Wong, Allen D. Seol, Po-Lin So, Alexandre N. Ermilov, Christopher K.
Primary Cilia Can Both Mediate and Suppress Hedgehog Pathway- Dependent Tumorigenesis (Supplementary Figures and Materials) Sunny Y. Wong, Allen D. Seol, Po-Lin So, Alexandre N. Ermilov, Christopher K.
Supplementary Table 1. Primer sequences for conventional RT-PCR on mouse islets
 Supplementary Table 1. Primer sequences for conventional RT-PCR on mouse islets Gene 5 Forward 3 5 Reverse 3.T. Product (bp) ( C) mnox1 GTTCTTGGGCTGCCTTGG GCTGGGGCGGCGG 60 300 mnoxa1 GCTTTGCCGCGTGC GGTTCGGGTCCTTTGTGC
Supplemental Information. Metabolic Maturation during Muscle Stem Cell. Differentiation Is Achieved by mir-1/133a-mediated
 Cell Metabolism, Volume 27 Supplemental Information Metabolic Maturation during Muscle Stem Cell Differentiation Is Achieved by mir-1/133a-mediated Inhibition of the Dlk1-Dio3 Mega Gene Cluster Stas Wüst,
Supplementary Figure S1 Expression of mir-181b in EOC (A) Kaplan-Meier
 Kaplan-Meier") Supplementary Figure S1 Expression of mir-181b in EOC (A) Kaplan-Meier curves for progression-free survival (PFS) and overall survival (OS) in a cohort of patients (N=52) with stage III primary ovarian
Supplementary Figure S1 Expression of mir-181b in EOC (A) Kaplan-Meier curves for progression-free survival (PFS) and overall survival (OS) in a cohort of patients (N=52) with stage III primary ovarian
Title: Smooth muscle cell-specific Tgfbr1 deficiency promotes aortic aneurysm formation by stimulating multiple signaling events
 Title: Smooth muscle cell-specific Tgfbr1 deficiency promotes aortic aneurysm formation by stimulating multiple signaling events Pu Yang 1, 3, radley M. Schmit 1, Chunhua Fu 1, Kenneth DeSart 1, S. Paul
High expression of cellular retinol binding protein-1 in lung adenocarcinoma is associated with poor prognosis
 High expression of cellular retinol binding protein-1 in lung adenocarcinoma is associated with poor prognosis Supplementary Material Supplementary Figure S1. Representative CRBP-1 immunostaining of non-neoplastic
Supplementary Figure 1
 Supplementary Figure 1 Constitutive EGFR signaling does not activate canonical EGFR signals (a) U251EGFRInd cells with or without tetracycline exposure (24h, 1µg/ml) were treated with EGF for 15 minutes
Nature Medicine: doi: /nm.4322
 1 2 3 4 5 6 7 8 9 10 11 Supplementary Figure 1. Predicted RNA structure of 3 UTR and sequence alignment of deleted nucleotides. (a) Predicted RNA secondary structure of ZIKV 3 UTR. The stem-loop structure
Fig. S1. Upregulation of K18 and K14 mrna levels during ectoderm specification of hescs. Quantitative real-time PCR analysis of mrna levels of OCT4
 Fig. S1. Upregulation of K18 and K14 mrna levels during ectoderm specification of hescs. Quantitative real-time PCR analysis of mrna levels of OCT4 (n=3 independent differentiation experiments for each
Supplementary Figures
 Supplementary Figures Supplementary Figure 1. Heatmap of GO terms for differentially expressed genes. The terms were hierarchically clustered using the GO term enrichment beta. Darker red, higher positive
Supplementary Figures and Tables
 Supplementary Figures and Tables Supplementary Figure 1. Study design and sample collection. S.japonicum were harvested from C57 mice at 8 time points after infection. Total number of samples for RNA-Seq:
SUPPLEMENTARY FIGURES
 SUPPLEMENTARY FIGURES Figure S1. Clinical significance of ZNF322A overexpression in Caucasian lung cancer patients. (A) Representative immunohistochemistry images of ZNF322A protein expression in tissue
(a) Significant biological processes (upper panel) and disease biomarkers (lower panel)
 Significant biological processes (upper panel) and disease biomarkers (lower panel)") Supplementary Figure 1. Functional enrichment analyses of secretomic proteins. (a) Significant biological processes (upper panel) and disease biomarkers (lower panel) 2 involved by hrab37-mediated secretory
Supplementary Figure 1. Functional enrichment analyses of secretomic proteins. (a) Significant biological processes (upper panel) and disease biomarkers (lower panel) 2 involved by hrab37-mediated secretory
Title: Epigenetic mechanisms underlying maternal diabetes-associated risk of congenital heart disease
 1 Supplemental Materials 2 3 Title: Epigenetic mechanisms underlying maternal diabetes-associated risk of congenital heart disease 4 5 6 Authors: Madhumita Basu, 1 Jun-Yi Zhu, 2 Stephanie LaHaye 1,3, Uddalak
sequences of a styx mutant reveals a T to A transversion in the donor splice site of intron 5
 sfigure 1 Styx mutant mice recapitulate the phenotype of SHIP -/- mice. (A) Analysis of the genomic sequences of a styx mutant reveals a T to A transversion in the donor splice site of intron 5 (GTAAC
Supplementary Figure 1. Metabolic landscape of cancer discovery pipeline. RNAseq raw counts data of cancer and healthy tissue samples were downloaded
 Supplementary Figure 1. Metabolic landscape of cancer discovery pipeline. RNAseq raw counts data of cancer and healthy tissue samples were downloaded from TCGA and differentially expressed metabolic genes
Lung Met 1 Lung Met 2 Lung Met Lung Met H3K4me1. Lung Met H3K27ac Primary H3K4me1
 a Gained Met-VELs 1.5 1.5 -.5 Lung Met 1 Lung Met Lung Met 3 1. Lung Met H3K4me1 Lung Met H3K4me1 1 Lung Met H3K4me1 Lung Met H3K7ac 1.5 Lung Met H3K7ac Lung Met H3K7ac.8 Primary H3K4me1 Primary H3K7ac
SUPPLEMENTARY INFORMATION
 SUPPLEMENTARY INFORMATION Supplementary Figure 1. Generation of a conditional allele of the Kindlin-2 gene. (A) A restriction map of the relevant genomic region of Kindlin-2 (top), the targeting construct
SUPPLEMENTARY INFORMATION
 DOI: 10.1038/ncb2607 Figure S1 Elf5 loss promotes EMT in mammary epithelium while Elf5 overexpression inhibits TGFβ induced EMT. (a, c) Different confocal slices through the Z stack image. (b, d) 3D rendering
Supplementary Figure 1. AdipoR1 silencing and overexpression controls. (a) Representative blots (upper and lower panels) showing the AdipoR1 protein
 Representative blots (upper and lower panels) showing the AdipoR1 protein") Supplementary Figure 1. AdipoR1 silencing and overexpression controls. (a) Representative blots (upper and lower panels) showing the AdipoR1 protein content relative to GAPDH in two independent experiments.
Supplementary Figure 1. AdipoR1 silencing and overexpression controls. (a) Representative blots (upper and lower panels) showing the AdipoR1 protein content relative to GAPDH in two independent experiments.