Diabetic pdx1-mutant zebrafish show conserved responses to nutrient overload and anti-glycemic treatment
|
|
|
- Edward Bridges
- 5 years ago
- Views:
Transcription
1 Supplementary Information Diabetic pdx1-mutant zebrafish show conserved responses to nutrient overload and anti-glycemic treatment Robin A. Kimmel, Stefan Dobler, Nicole Schmitner, Tanja Walsen, Julia Freudenblum, Dirk Meyer
 Weight")

2 Supplementary figure 1 - Kimmel a b c *** *** Length (cm) Weight (g) BMI (g/cm2) *** pdx1+/- pdx1-/- pdx1+/- pdx1-/- pdx1+/- pdx1-/-

3
4

5
6

7

8
9
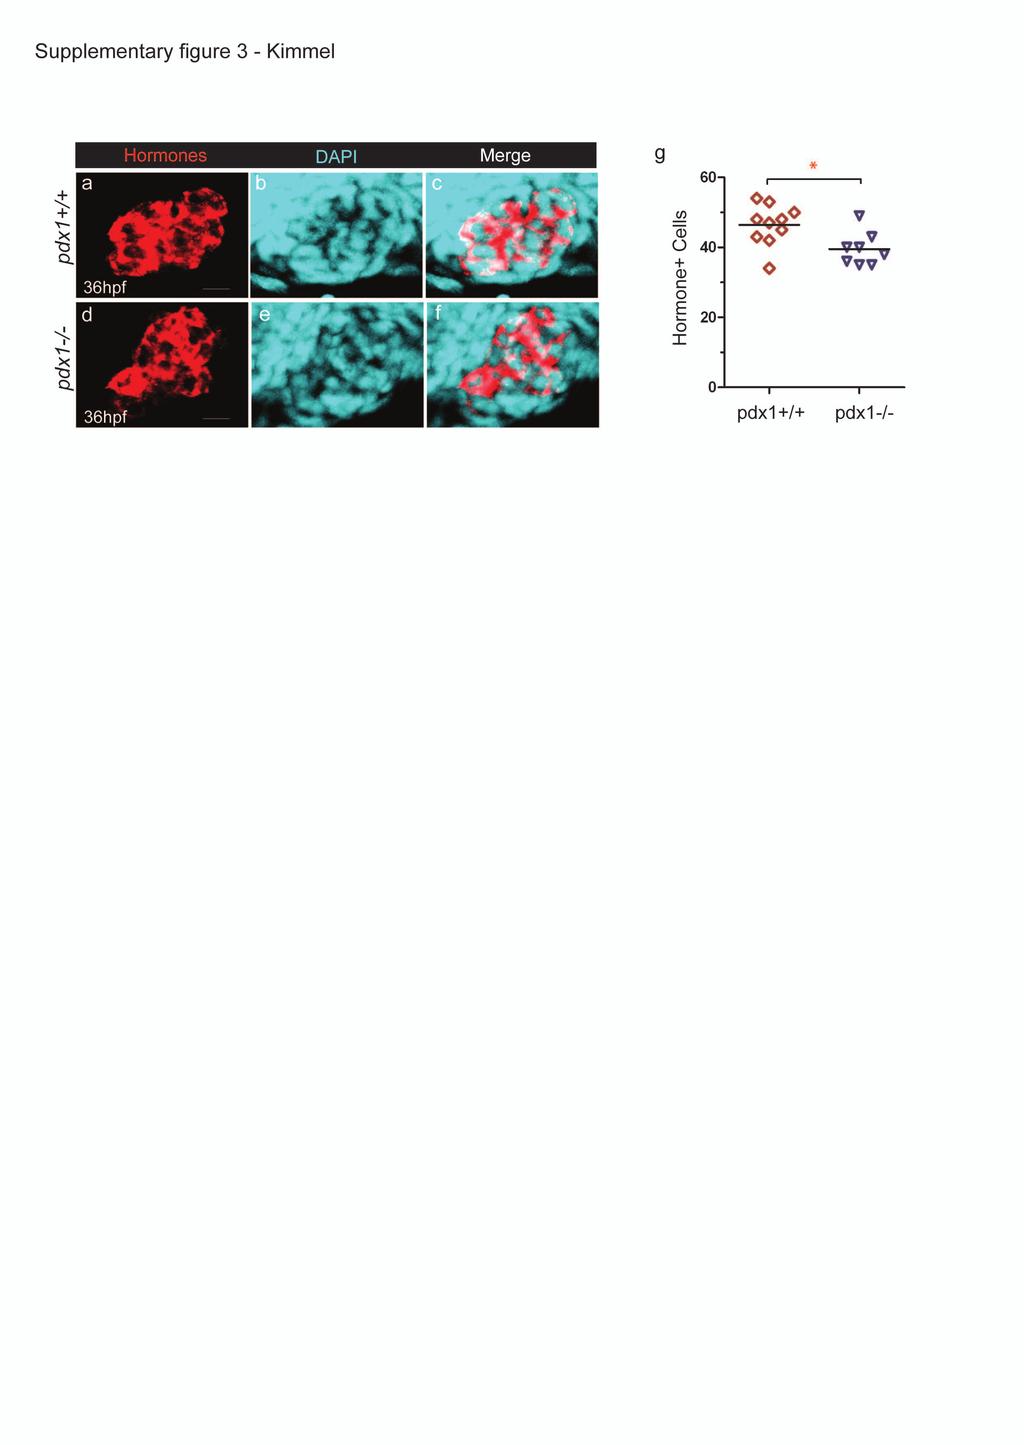
10 Supplementary Figure Legends Supplementary figure 1. Reduced size of pdx1 homozygous mutant adults. At 3 months of age, pdx1 -/- mutants (MU) had decreased length (a), weight (b), and body mass index (BMI, c), as compared to pdx1 +/- heterozygous (HET) siblings from the same clutch. n(pdx1+/-) = 35, n(pdx1-/-) = 16, ***p< (t-test). Supplementary figure 2. Early growth and development is normal in pdx1 mutants (a) Brightfield micrographs of representative WT and MU larvae at 12dpf. (b) Quantification of standard length at 12dpf. n=19 per group. n.s., not significant (t-test). Error bars show s.e.m. (c) Animal length at 5 weeks (pdx1+/+, n=12; pdx1-/-, n=14; *p<0.05; Mann-Whitney test). The line of the box plots shows the median, the box extends from the 25 th to the 75 th percentile, whiskers indicate 10 th and 90 th percentiles.(d) Antibody staining of the pancreas at 12dpf to detect exocrine tissue (anti-carboxypeptidase A, CPA) and beta cells (anti-insulin, Ins). Supplementary figure 3. Early endocrine cell formation in pdx1 mutant embryos. (a-f) Maximum intensity projection of multiple planes from a confocal stacks of the islet at 36hpf in control (a-c) and pdx1 mutant (d-f) embryos. Embryos were immunostained with an antibody cocktail against Ins, Gcga and Somatostatin (Hormone+, red) (a, d) and nuclei were counterstained with DAPI (cyan) (b,e). All are dorsal view, anterior is to the left. Scale bar = 10um. (g) Quantitation of hormone-expressing cells at 36hpf. n(pdx1+/+) = 10, n(pdx1-/-) = 8, *p<0.05 (t-test). Supplementary figure 4. Absence of Pdx1 protein in pdx1 mutant embryos. (a, b) Pdx1 protein is localized in the islet and extrapancreatic duct in 3.5dpf embryos, as shown by antibody staining in wild type embryos expressing the NeuroD:eGFP transgene. Pdx1 protein is not detectable in NeuroD:eGFP;pdx1 -/- mutant embryos (c,d). The region
11 of the islet is outlined in yellow (d). Supplementary Figure 5. Glucagon expression in pdx1 mutants. Maximum intensity projections of confocal stacks showing Glucagon (Gcga)-expressing alpha cells (magenta) at 72hpf in control pdx1+/+ (a,b) and pdx1-/- mutants (c,d). Nuclei are counterstained with DAPI (gray). Scale bars, 20μm. (e) Number of cells expressing Gcga in control (n=11) and mutant (n=8) embryos at 72hpf. Line indicates the mean. *p<0.05 (t-test). (f) Ratio of alpha to beta cell number (as shown in Figure 3a). Box plot shows median, boxes span 25 th to 75 th percentile, whiskters 10 th to 90 th percentile. n.s., the difference in mean value is not significant, t-test. Supplementary Figure 6. Intrapancreatic duct of pdx1 mutants. (a, b) Projections of confocal stacks of 5dpf larvae immunostained for 2F11 (gray) and Ins (green). (c, d) Projections of confocal stacks of 6dpf larvae immunostained for Nkx6.1 (gray), Ins (green) and CPA (magenta). (cʼ,dʼ) Same images with CPA channel removed for clarity. Scale bars, 50 μm. Confocal stack projection of head region of the pancreas (outlined in yellow) of 6dpf pdx1+/+ (e) and pdx1-/- (f) larvae immunostained for Ins (green) and Nkx6.1 (gray). Scale bar, 20μm. In all panels, lateral view with anterior to the right. Supplementary figure 7. Response of pdx1 mutants to nutrient excess. (a) Quantification of Standard Length at 12dpf of wild type larvae fed a powder-only (MIN) or egg-yolk supplemented high fat diet (HFD) at the indicated concentrations from 5-11dpf, and analyzed at day 12. n as indicated per group. ***p< as shown, differences in growth between egg yolk concentrations in the HFD were not significant (Tukey's Multiple Comparison Test). (b). Brightfield micrographs of pdx1 mutant and controls fed a powderonly (MIN) or 10 ug/ml egg-yolk supplemented (HFD) from 5-11dpf, and analyzed at day 12. Scale bar = 1.0mm. (c) Relative increase in length for wild type and mutant fish
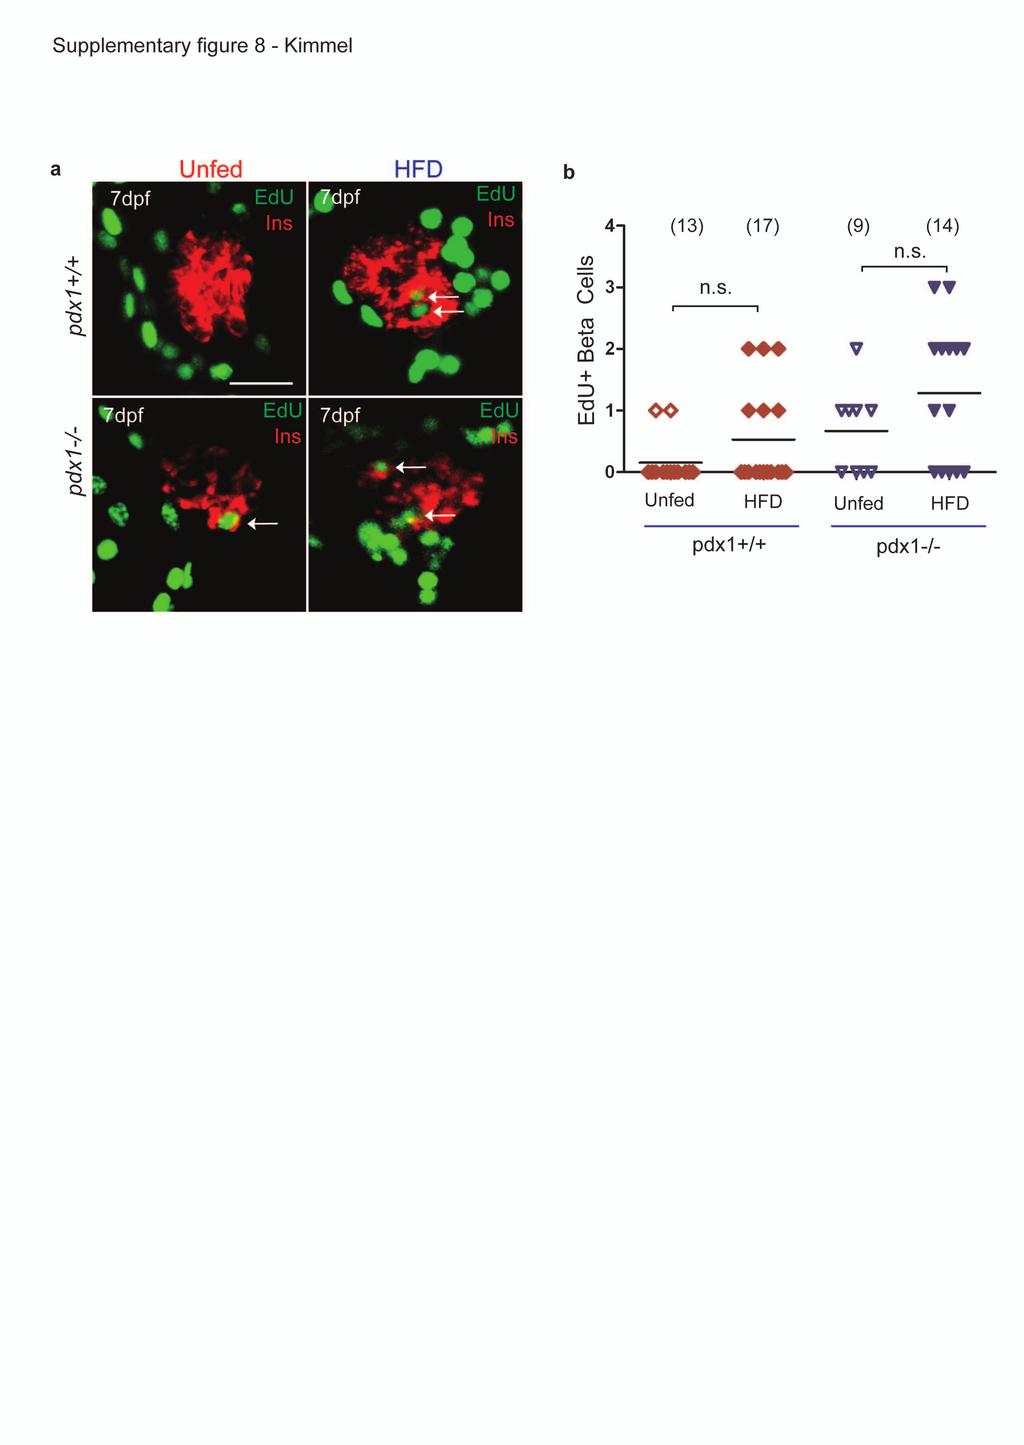
12 treated as in (b). n.s., not significant (t-test). Results combined from 4 (wild type) and 3 (mutant) independent experiments with animals per group. (d) Weight (bottom) at 12dpf of fish treated as in (b). Fish were weighed in pools of 4-6 animals in 3 (wild type) and 2 (mutant) independent experiments. Results from control and 10ug/ml HFD in (a) were included for the calculation in (c). Supplementary figure 8. Proliferative response of beta cells to nutrient excess. (a) Projection of multiple planes through the principal islet from wild type and mutant larvae injected with EdU at 5dpf, not fed or treated with HFD feeding for 48h, followed by analysis for EdU incorporation and immunostaining for Ins at 7dpf. Nuclei were counterstained with DAPI. Arrows indicate EdU+/Ins+ beta cells. Scale bar, 20µm. (b) Quantitation of EdU positive beta cells in the islet of wild type and mutant larvae treated as in (a). Line indicates median. Number of larvae analyzed per group as indicated (combined from 2 or more independent experiments). Differences between fasting and fed conditions for each genotype are not significant (n.s., Mann-Whitney, one-tailed t-test).
Supplementary Figure 1. Nature Neuroscience: doi: /nn.4547
 Supplementary Figure 1 Characterization of the Microfetti mouse model. (a) Gating strategy for 8-color flow analysis of peripheral Ly-6C + monocytes from Microfetti mice 5-7 days after TAM treatment. Living
Supplemental Information. Ciliary Beating Compartmentalizes. Cerebrospinal Fluid Flow in the Brain. and Regulates Ventricular Development
 Current Biology, Volume Supplemental Information Ciliary Beating Compartmentalizes Cerebrospinal Fluid Flow in the Brain and Regulates Ventricular Development Emilie W. Olstad, Christa Ringers, Jan N.
Supplementary Figure 1
 Supplementary Figure 1 Global TeNT expression effectively impairs synaptic transmission. Injection of 100 pg tent mrna leads to a reduction of vesicle mediated synaptic transmission in the spinal cord
Control of Glucose Metabolism
 Glucose Metabolism Control of Glucose Metabolism The pancreas is both an exocrine and endocrine gland. It secretes digestive enzymes into the duodenum (exocrine) and 3 specific hormones into the bloodstream
Inhibition of Cdk5 Promotes β-cell Differentiation from Ductal Progenitors
 Inhibition of Cdk5 Promotes β-cell Differentiation from Ductal Progenitors Ka-Cheuk Liu, Gunter Leuckx, Daisuke Sakano, Philip A. Seymour, Charlotte L. Mattsson, Linn Rautio, Willem Staels, Yannick Verdonck,
a) Primary cultures derived from the pancreas of an 11-week-old Pdx1-Cre; K-MADM-p53
 Primary cultures derived from the pancreas of an 11-week-old Pdx1-Cre; K-MADM-p53") 1 2 3 4 5 6 7 8 9 10 Supplementary Figure 1. Induction of p53 LOH by MADM. a) Primary cultures derived from the pancreas of an 11-week-old Pdx1-Cre; K-MADM-p53 mouse revealed increased p53 KO/KO (green,
1 2 3 4 5 6 7 8 9 10 Supplementary Figure 1. Induction of p53 LOH by MADM. a) Primary cultures derived from the pancreas of an 11-week-old Pdx1-Cre; K-MADM-p53 mouse revealed increased p53 KO/KO (green,
islets scored 1 week month months
 Supplementary Table 1. Sampling parameters for the morphometrical analyses Time (post- DT) Control mice (age-matched) α-cells mice pancreatic surface (mm 2 ) scored DT-treated mice islets scored mice pancreatic
Figure legends Supplemental Fig.1. Glucose-induced insulin secretion and insulin content of islets. Supplemental Fig. 2.
 Figure legends Supplemental Fig.. Glucose-induced insulin secretion and insulin content of islets. Insulin secretory responses to.,., and. mm glucose (A) (n = 7-), and the insulin content in the islets
Ductal pancreatic cancer modeling and drug screening using human pluripotent stem cell and patient-derived tumor organoids
 Ductal pancreatic cancer modeling and drug screening using human pluripotent stem cell and patient-derived tumor organoids Ling Huang 1, Audrey Holtzinger 1,2,11, Ishaan Jagan 1,11, Michael BeGora 1, Ines
Correspondence: mirna regulation of Sdf1 chemokine signaling provides genetic robustness to germ cell migration
 Correspondence: mirna regulation of Sdf1 chemokine signaling provides genetic robustness to germ cell migration Alison A. Staton, Holger Knaut, and Antonio J. Giraldez Supplementary Note Materials and
SUPPLEMENTARY INFORMATION
 SUPPLEMENTARY INFORMATION Advances in pancreatic islet monolayer culture on glass surfaces enable superresolution microscopy and insights into beta cell ciliogenesis and proliferation Edward A. Phelps,
Supplemental Information. Myocardial Polyploidization Creates a Barrier. to Heart Regeneration in Zebrafish
 Developmental Cell, Volume 44 Supplemental Information Myocardial Polyploidization Creates a Barrier to Heart Regeneration in Zebrafish Juan Manuel González-Rosa, Michka Sharpe, Dorothy Field, Mark H.
Supplementary Figure S1: TIPF reporter validation in the wing disc.
 Supplementary Figure S1: TIPF reporter validation in the wing disc. a,b, Test of put RNAi. a, In wildtype discs the Dpp target gene Sal (red) is expressed in a broad stripe in the centre of the ventral
Supplementary Figures
 Supplementary Figures Supplementary Figure 1. nrg1 bns101/bns101 embryos develop a functional heart and survive to adulthood (a-b) Cartoon of Talen-induced nrg1 mutation with a 14-base-pair deletion in
Supplementary Table 1. The primers used for quantitative RT-PCR. Gene name Forward (5 > 3 ) Reverse (5 > 3 )
 Reverse (5 > 3 )") 770 771 Supplementary Table 1. The primers used for quantitative RT-PCR. Gene name Forward (5 > 3 ) Reverse (5 > 3 ) Human CXCL1 GCGCCCAAACCGAAGTCATA ATGGGGGATGCAGGATTGAG PF4 CCCCACTGCCCAACTGATAG TTCTTGTACAGCGGGGCTTG
770 771 Supplementary Table 1. The primers used for quantitative RT-PCR. Gene name Forward (5 > 3 ) Reverse (5 > 3 ) Human CXCL1 GCGCCCAAACCGAAGTCATA ATGGGGGATGCAGGATTGAG PF4 CCCCACTGCCCAACTGATAG TTCTTGTACAGCGGGGCTTG
Progenitor potential of nkx6.1-expressing cells throughout zebrafish life and during beta cell regeneration
 Ghaye et al. BMC Biology (2015) 13:70 DOI 10.1186/s12915-015-0179-4 RESEARCH ARTICLE Open Access Progenitor potential of nkx6.1-expressing cells throughout zebrafish life and during beta cell regeneration
Nature Neuroscience: doi: /nn Supplementary Figure 1. MADM labeling of thalamic clones.
 Supplementary Figure 1 MADM labeling of thalamic clones. (a) Confocal images of an E12 Nestin-CreERT2;Ai9-tdTomato brain treated with TM at E10 and stained for BLBP (green), a radial glial progenitor-specific
McWilliams et al., http :// /cgi /content /full /jcb /DC1
 Supplemental material JCB McWilliams et al., http ://www.jcb.org /cgi /content /full /jcb.201603039 /DC1 THE JOURNAL OF CELL BIOLOGY Figure S1. In vitro characterization of mito-qc. (A and B) Analysis
Supplemental data Supplemental Figure Legends Supplemental Figure 1. Supplemental Figure 2.
 Supplemental data Supplemental Figure Legends Supplemental Figure 1. Analysis of deletion of AMPK!2 in POMC and AgRP neurons in control and POMC!2KO and AgRP!2KO mice. (A) mmunofluorescence analysis for
SUPPLEMENTARY DATA. Supplementary Table 2. Antibodies used for Immunofluoresence. Supplementary Table 3. Real-time PCR primer sequences.
 Supplementary Table 2. Antibodies used for Immunofluoresence. Antibody Dilution Source Goat anti-pdx1 1:100 R&D Systems Rabbit anti-hnf6 1:100 Santa Cruz Biotechnology Mouse anti-nkx6.1 1:200 Developmental
SUPPLEMENTARY INFORMATION
 doi: 10.1038/nature06994 A phosphatase cascade by which rewarding stimuli control nucleosomal response A. Stipanovich*, E. Valjent*, M. Matamales*, A. Nishi, J.H. Ahn, M. Maroteaux, J. Bertran-Gonzalez,
SUPPLEMENTARY INFORMATION
 DOI: 10.1038/ncb2607 Figure S1 Elf5 loss promotes EMT in mammary epithelium while Elf5 overexpression inhibits TGFβ induced EMT. (a, c) Different confocal slices through the Z stack image. (b, d) 3D rendering
Nature Neuroscience: doi: /nn Supplementary Figure 1
 Supplementary Figure 1 Atlas representations of the midcingulate (MCC) region targeted in this study compared against the anterior cingulate (ACC) region commonly reported. Coronal sections are shown on
SUPPLEMENTARY INFORMATION
 doi:10.1038/nature12652 Supplementary Figure 1. PRDM16 interacts with endogenous EHMT1 in brown adipocytes. Immunoprecipitation of PRDM16 complex by flag antibody (M2) followed by Western blot analysis
Supplementary Fig. 1 V-ATPase depletion induces unique and robust phenotype in Drosophila fat body cells.
 Supplementary Fig. 1 V-ATPase depletion induces unique and robust phenotype in Drosophila fat body cells. a. Schematic of the V-ATPase proton pump macro-complex structure. The V1 complex is composed of
Abbreviations: P- paraffin-embedded section; C, cryosection; Bio-SA, biotin-streptavidin-conjugated fluorescein amplification.
 Supplementary Table 1. Sequence of primers for real time PCR. Gene Forward primer Reverse primer S25 5 -GTG GTC CAC ACT ACT CTC TGA GTT TC-3 5 - GAC TTT CCG GCA TCC TTC TTC-3 Mafa cds 5 -CTT CAG CAA GGA
Santulli G. et al. A microrna-based strategy to suppress restenosis while preserving endothelial function
 ONLINE DATA SUPPLEMENTS Santulli G. et al. A microrna-based strategy to suppress restenosis while preserving endothelial function Supplementary Figures Figure S1 Effect of Ad-p27-126TS on the expression
Nature Immunology: doi: /ni eee Supplementary Figure 1
 eee Supplementary Figure 1 Hyphae induce NET release, but yeast do not. (a) NET release by human peripheral neutrophils stimulated with a hgc1 yeast-locked C. albicans mutant (yeast) or pre-formed WT C.
SUPPLEMENTARY INFORMATION
 SUPPLEMENTARY INFORMATION doi:10.1038/nature11464 Supplemental Figure S1. The expression of Vegfb is increased in obese and diabetic mice as compared to lean mice. a-b, Body weight and postprandial blood
Supplementary Materials. for Garmy-Susini, et al, Integrin 4 1 signaling is required for lymphangiogenesis and tumor metastasis
 Supplementary Materials for Garmy-Susini, et al, Integrin 4 1 signaling is required for lymphangiogenesis and tumor metastasis 1 Supplementary Figure Legends Supplementary Figure 1: Integrin expression
Supplementary Figure 1. Genotyping strategies for Mcm3 +/+, Mcm3 +/Lox and Mcm3 +/- mice and luciferase activity in Mcm3 +/Lox mice. A.
 Supplementary Figure 1. Genotyping strategies for Mcm3 +/+, Mcm3 +/Lox and Mcm3 +/- mice and luciferase activity in Mcm3 +/Lox mice. A. Upper part, three-primer PCR strategy at the Mcm3 locus yielding
Online Appendix Material and Methods: Pancreatic RNA isolation and quantitative real-time (q)rt-pcr. Mice were fasted overnight and killed 1 hour (h)
rt-pcr. Mice were fasted overnight and killed 1 hour (h)") Online Appendix Material and Methods: Pancreatic RNA isolation and quantitative real-time (q)rt-pcr. Mice were fasted overnight and killed 1 hour (h) after feeding. A small slice (~5-1 mm 3 ) was taken
Online Appendix Material and Methods: Pancreatic RNA isolation and quantitative real-time (q)rt-pcr. Mice were fasted overnight and killed 1 hour (h) after feeding. A small slice (~5-1 mm 3 ) was taken
Different levels of Notch signaling regulate quiescence, renewal and differentiation in pancreatic endocrine progenitors
 AND STEM CELLS RESEARCH ARTICLE 1557 Development 139, 1557-1567 (2012) doi:10.1242/dev.076000 2012. Published by The Company of Biologists Ltd Different levels of Notch signaling regulate quiescence, renewal
Supplementary Figure 1.
 Supplementary Figure 1. Increased β cell mass and islet diameter in βtsc2 -/- mice up to 35 weeks A: Reconstruction of multiple anti-insulin immunofluorescence images showing differences in β cell mass
Supplementary Information. Induction of human pancreatic beta cell replication by inhibitors of dual specificity tyrosine regulated kinase
 Journal: Nature Medicine Supplementary Information Induction of human pancreatic beta cell replication by inhibitors of dual specificity tyrosine regulated kinase 1,2 Peng Wang PhD, 1,2 Juan-Carlos Alvarez-Perez
marker. DAPI labels nuclei. Flies were 20 days old. Scale bar is 5 µm. Ctrl is
 Supplementary Figure 1. (a) Nos is detected in glial cells in both control and GFAP R79H transgenic flies (arrows), but not in deletion mutant Nos Δ15 animals. Repo is a glial cell marker. DAPI labels
Wenqin Hu, Cuiping Tian, Tun Li, Mingpo Yang, Han Hou & Yousheng Shu
 Distinct contributions of Na v 1.6 and Na v 1.2 in action potential initiation and backpropagation Wenqin Hu, Cuiping Tian, Tun Li, Mingpo Yang, Han Hou & Yousheng Shu Supplementary figure and legend Supplementary
Ahtiainen et al., http :// /cgi /content /full /jcb /DC1
 Supplemental material JCB Ahtiainen et al., http ://www.jcb.org /cgi /content /full /jcb.201512074 /DC1 THE JOURNAL OF CELL BIOLOGY Figure S1. Distinct distribution of different cell cycle phases in the
ROCK/Cdc42-mediated microglial motility and gliapse formation lead to phagocytosis of degenerating dopaminergic neurons in vivo
 Supplementary Information ROCK/Cdc42-mediated microglial motility and gliapse formation lead to phagocytosis of degenerating dopaminergic neurons in vivo Carlos Barcia* 1,2, Carmen M Ros 1,2, Valentina
Supplementary information
 Supplementary information 1 Supplementary Figure 1. CALM regulates autophagy. (a). Quantification of LC3 levels in the experiment described in Figure 1A. Data are mean +/- SD (n > 3 experiments for each
Endocrine System. Regulating Blood Sugar. Thursday, December 14, 17
 Endocrine System Regulating Blood Sugar Stress results in nervous and hormonal responses. The adrenal glands are located above each kidney. Involved in stress response. Stress Upsets Homeostasis Stress
Nature Genetics: doi: /ng Supplementary Figure 1. Parameters and consequences of mononuclear cardiomyocyte frequency.
 Supplementary Figure 1 Parameters and consequences of mononuclear cardiomyocyte frequency. (a) Correlation of the frequency of mononuclear cardiomyocytes to the frequency of cardiomyocytes with three or
JCB. Supplemental material. Gu et al.,
 Supplemental material Gu et al., http://www.jcb.org/cgi/content/full/jcb.201010075/dc1 T H E J O U R N A L O F C E L L B I O L O G Y Figure S1. S1P directly induces actin assembly. Actin assembly at the
Supplementary Figure 1. EC-specific Deletion of Snail1 Does Not Affect EC Apoptosis. (a,b) Cryo-sections of WT (a) and Snail1 LOF (b) embryos at
 Cryo-sections of WT (a) and Snail1 LOF (b) embryos at") Supplementary Figure 1. EC-specific Deletion of Snail1 Does Not Affect EC Apoptosis. (a,b) Cryo-sections of WT (a) and Snail1 LOF (b) embryos at E10.5 were double-stained for TUNEL (red) and PECAM-1 (green).
Supplementary Figure 1. EC-specific Deletion of Snail1 Does Not Affect EC Apoptosis. (a,b) Cryo-sections of WT (a) and Snail1 LOF (b) embryos at E10.5 were double-stained for TUNEL (red) and PECAM-1 (green).
Supplementary Figure 1
 Supplementary Figure 1 5 microns C7 B6 unclassified H19 C7 signal H19 guide signal H19 B6 signal C7 SNP spots H19 RNA spots B6 SNP spots colocalization H19 RNA classification Supplementary Figure 1. Allele-specific
Impact of Sox9 Dosage and Hes1-mediated Notch Signaling in Controlling the Plasticity of Adult Pancreatic Duct Cells in Mice
 Impact of Sox9 Dosage and Hes1-mediated Notch Signaling in Controlling the Plasticity of Adult Pancreatic Duct Cells in Mice Shinichi Hosokawa 1,3,Kenichiro Furuyama 1,3, Masashi Horiguchi 1,3,Yoshiki
SUPPLEMENTARY INFORMATION
 DOI: 10.1038/ncb2988 Supplementary Figure 1 Kif7 L130P encodes a stable protein that does not localize to cilia tips. (a) Immunoblot with KIF7 antibody in cell lysates of wild-type, Kif7 L130P and Kif7
Supplementary Figure 1 Expression of Crb3 in mouse sciatic nerve: biochemical analysis (a) Schematic of Crb3 isoforms, ERLI and CLPI, indicating the
 Schematic of Crb3 isoforms, ERLI and CLPI, indicating the") Supplementary Figure 1 Expression of Crb3 in mouse sciatic nerve: biochemical analysis (a) Schematic of Crb3 isoforms, ERLI and CLPI, indicating the location of the transmembrane (TM), FRM binding (FB)
Supplementary Figure 1 Expression of Crb3 in mouse sciatic nerve: biochemical analysis (a) Schematic of Crb3 isoforms, ERLI and CLPI, indicating the location of the transmembrane (TM), FRM binding (FB)
Supplementary Figure 1: GFAP positive nerves in patients with adenocarcinoma of
 SUPPLEMENTARY FIGURES AND MOVIE LEGENDS Supplementary Figure 1: GFAP positive nerves in patients with adenocarcinoma of the pancreas. (A) Images of nerves stained for GFAP (green), S100 (red) and DAPI
Supplementary Information
 Supplementary Information Title Degeneration and impaired regeneration of gray matter oligodendrocytes in amyotrophic lateral sclerosis Authors Shin H. Kang, Ying Li, Masahiro Fukaya, Ileana Lorenzini,
BMI risk SNPs associate with increased CADM1 and CADM2 expression in the cerebellum of human subjects.
 Supplementary Figure 1 BMI risk SNPs associate with increased CADM1 and CADM2 expression in the cerebellum of human subjects. Boxplots show the 25% and 75% quantiles of normalized mrna expression levels
Karen L.P. McNally, Amy S. Fabritius, Marina L. Ellefson, Jonathan R. Flynn, Jennifer A. Milan, and Francis J. McNally
 Developmental Cell, Volume 22 Supplemental Information Kinesin-1 Prevents Capture of the Oocyte Meiotic Spindle by the Sperm Aster Karen L.P. McNally, Amy S. Fabritius, Marina L. Ellefson, Jonathan R.
SUPPLEMENTARY INFORMATION
 Supplementary Figure 1. Ras V12 expression in the entire eye-antennal disc does not cause invasive tumours. a, Eye-antennal discs expressing Ras V12 in all cells (marked with GFP, green) overgrow moderately
F-actin VWF Vinculin. F-actin. Vinculin VWF
 a F-actin VWF Vinculin b F-actin VWF Vinculin Supplementary Fig. 1. WPBs in HUVECs are located along stress fibers and at focal adhesions. (a) Immunofluorescence images of f-actin (cyan), VWF (yellow),
Nature Biotechnology: doi: /nbt Supplementary Figure 1. Analysis of hair bundle morphology in Ush1c c.216g>a mice at P18 by SEM.
 Supplementary Figure 1 Analysis of hair bundle morphology in Ush1c c.216g>a mice at P18 by SEM. (a-c) Heterozygous c.216ga mice displayed normal hair bundle morphology at P18. (d-i) Disorganized hair bundles
Supplementary Figure 1) GABAergic enhancement by leptin hyperpolarizes POMC neurons A) Representative recording samples showing the membrane
 GABAergic enhancement by leptin hyperpolarizes POMC neurons A) Representative recording samples showing the membrane") Supplementary Figure 1) GABAergic enhancement by leptin hyperpolarizes POMC neurons A) Representative recording samples showing the membrane potential recorded from POMC neurons following treatment with
Supplementary Figure 1) GABAergic enhancement by leptin hyperpolarizes POMC neurons A) Representative recording samples showing the membrane potential recorded from POMC neurons following treatment with
Lack of cadherins Celsr2 and Celsr3 impairs ependymal ciliogenesis, leading to fatal
 Lack of cadherins Celsr2 and Celsr3 impairs ependymal ciliogenesis, leading to fatal hydrocephalus Fadel TISSIR, Yibo QU, Mireille MONTCOUQUIOL, Libing ZHOU, Kouji KOMATSU, Dongbo SHI, Toshihiko FUJIMORI,
Postn MCM Smad2 fl/fl Postn MCM Smad3 fl/fl Postn MCM Smad2/3 fl/fl. Postn MCM. Tgfbr1/2 fl/fl TAC
 A Smad2 fl/fl Smad3 fl/fl Smad2/3 fl/fl Tgfbr1/2 fl/fl 1. mm B Tcf21 MCM Tcf21 MCM Smad3 fl/fl Tcf21 MCM Smad2/3 fl/fl Tcf21 MCM Tgfbr1/2 fl/fl αmhc MCM C 1. mm 1. mm D Smad2 fl/fl Smad3 fl/fl Smad2/3
Supplementary Materials for
 www.sciencesignaling.org/cgi/content/full/8/385/ra70/dc1 Supplementary Materials for The interaction of heparan sulfate proteoglycans with endothelial transglutaminase-2 limits VEGF 165 -induced angiogenesis
Nature Neuroscience: doi: /nn Supplementary Figure 1. Neuron class-specific arrangements of Khc::nod::lacZ label in dendrites.
 Supplementary Figure 1 Neuron class-specific arrangements of Khc::nod::lacZ label in dendrites. Staining with fluorescence antibodies to detect GFP (Green), β-galactosidase (magenta/white). (a, b) Class
Supplementary Figure 1: Kv7 currents in neonatal CA1 neurons measured with the classic M- current voltage-clamp protocol.
 Supplementary Figures 1-11 Supplementary Figure 1: Kv7 currents in neonatal CA1 neurons measured with the classic M- current voltage-clamp protocol. (a), Voltage-clamp recordings from CA1 pyramidal neurons
Supplementary information: Binding of N-methylscopolamine to the extracellular domain of muscarinic acetylcholine receptors
 Supplementary information: Binding of N-methylscopolamine to the extracellular domain of muscarinic acetylcholine receptors Jan Jakubík, Alena Randáková, Pavel Zimčík, Esam E. El-Fakahany, and Vladimír
Glucose Homeostasis. Liver. Glucose. Muscle, Fat. Pancreatic Islet. Glucose utilization. Glucose production, storage Insulin Glucagon
 Glucose Homeostasis Liver Glucose Glucose utilization Glucose production, storage Insulin Glucagon Muscle, Fat Pancreatic Islet Classification of Diabetes Type 1 diabetes Type 2 diabetes Other types of
Supplemental Figure 1. Quantification of proliferation in thyroid of WT, Ctns -/- and grafted
 Supplemental Figure 1. Quantification of proliferation in thyroid of WT, Ctns -/- and grafted Ctns -/- mice. Cells immunolabeled for the proliferation marker (Ki-67) were counted in sections (n=3 WT, n=4
SUPPLEMENTARY LEGENDS...
 TABLE OF CONTENTS SUPPLEMENTARY LEGENDS... 2 11 MOVIE S1... 2 FIGURE S1 LEGEND... 3 FIGURE S2 LEGEND... 4 FIGURE S3 LEGEND... 5 FIGURE S4 LEGEND... 6 FIGURE S5 LEGEND... 7 FIGURE S6 LEGEND... 8 FIGURE
Supplementary Materials for
 www.sciencetranslationalmedicine.org/cgi/content/full/4/117/117ra8/dc1 Supplementary Materials for Notch4 Normalization Reduces Blood Vessel Size in Arteriovenous Malformations Patrick A. Murphy, Tyson
Supplementary Figure 1. Baf60c and baf180 are induced during cardiac regeneration in zebrafish. RNA in situ hybridization was performed on paraffin
 Supplementary Figure 1. Baf60c and baf180 are induced during cardiac regeneration in zebrafish. RNA in situ hybridization was performed on paraffin sections from sham-operated adult hearts (a and i) and
Macrophages form functional vascular mimicry channels in vivo. SI Figures and Legend
 Macrophages form functional vascular mimicry channels in vivo Authors: *Faith H. Barnett, *Mauricio Rosenfeld, Malcolm Wood, William Kiosses, Yoshihiko Usui, Valentina Marchetti, Edith Aguilar, and Martin
ns ns hp761(lf); daf-28(lf) daf-28(gf) Figure S1
; daf-28(lf) daf-28(gf) Figure S1") A ns ns B 100 100 80 80 60 60 40 40 20 20 0 0% 0 0% hp761(lf); daf-28(lf) daf-28(gf) Figure S1 A 100 80 15 o C 22 o C 25 o C % Dauers 60 40 20 0 0% 0% * 0% 0% 0% Class I alleles Class II alleles daf-2(lf;ts)
A ns ns B 100 100 80 80 60 60 40 40 20 20 0 0% 0 0% hp761(lf); daf-28(lf) daf-28(gf) Figure S1 A 100 80 15 o C 22 o C 25 o C % Dauers 60 40 20 0 0% 0% * 0% 0% 0% Class I alleles Class II alleles daf-2(lf;ts)
Nature Immunology: doi: /ni Supplementary Figure 1
 Supplementary Figure 1 NLRP12 is downregulated in biopsy samples from patients with active ulcerative colitis (UC). (a-g) NLRP12 expression in 7 UC mrna profiling studies deposited in NCBI GEO database.
Nature Neuroscience: doi: /nn Supplementary Figure 1. Large-scale calcium imaging in vivo.
 Supplementary Figure 1 Large-scale calcium imaging in vivo. (a) Schematic illustration of the in vivo camera imaging set-up for large-scale calcium imaging. (b) High-magnification two-photon image from
Inhibition of DYRK1A stimulates human beta-cell proliferation
 Inhibition of DYRK1A stimulates human beta-cell proliferation Ercument Dirice 1,, Deepika Walpita 2,, Amedeo Vetere 2, Bennett C. Meier 2,5, Sevim Kahraman 1, Jiang Hu 1, Vlado Dančík 2, Sean M. Burns
hexahistidine tagged GRP78 devoid of the KDEL motif (GRP78-His) on SDS-PAGE. This
 on SDS-PAGE. This") SUPPLEMENTAL FIGURE LEGEND Fig. S1. Generation and characterization of. (A) Coomassie staining of soluble hexahistidine tagged GRP78 devoid of the KDEL motif (GRP78-His) on SDS-PAGE. This protein was expressed
SUPPLEMENTAL FIGURE LEGEND Fig. S1. Generation and characterization of. (A) Coomassie staining of soluble hexahistidine tagged GRP78 devoid of the KDEL motif (GRP78-His) on SDS-PAGE. This protein was expressed
Supplementary Figure 1. Properties of various IZUMO1 monoclonal antibodies and behavior of SPACA6. (a) (b) (c) (d) (e) (f) (g) .
 (b) (c) (d) (e) (f) (g) .") Supplementary Figure 1. Properties of various IZUMO1 monoclonal antibodies and behavior of SPACA6. (a) The inhibitory effects of new antibodies (Mab17 and Mab18). They were investigated in in vitro fertilization
Supplementary Figure 1. Properties of various IZUMO1 monoclonal antibodies and behavior of SPACA6. (a) The inhibitory effects of new antibodies (Mab17 and Mab18). They were investigated in in vitro fertilization
Downregulation of the small GTPase SAR1A: a key event underlying alcohol-induced Golgi fragmentation in hepatocytes
 Downregulation of the small GTPase SAR1A: a key event underlying alcohol-induced Golgi fragmentation in hepatocytes Armen Petrosyan 1*, Pi-Wan Cheng 1,3, Dahn L. Clemens 2,3 & Carol A. Casey 2,3 1 Department
50mM D-Glucose. Percentage PI. L-Glucose
 Monica Dus, Minrong Ai, Greg S.B Suh. Taste-independent nutrient selection is mediated by a brain-specific Na+/solute cotransporter in Drosophila. Control + Phlorizin mm D-Glucose 1 2mM 1 L-Glucose Gr5a;Gr64a
Supplementary Figure 1 Madm is not required in GSCs and hub cells. (a,b) Act-Gal4-UAS-GFP (a), Act-Gal4-UAS- GFP.nls (b,c) is ubiquitously expressed
 Act-Gal4-UAS-GFP (a), Act-Gal4-UAS- GFP.nls (b,c) is ubiquitously expressed") Supplementary Figure 1 Madm is not required in GSCs and hub cells. (a,b) Act-Gal4-UAS-GFP (a), Act-Gal4-UAS- GFP.nls (b,c) is ubiquitously expressed in the testes. The testes were immunostained with GFP
Supplementary Figure 1 Madm is not required in GSCs and hub cells. (a,b) Act-Gal4-UAS-GFP (a), Act-Gal4-UAS- GFP.nls (b,c) is ubiquitously expressed in the testes. The testes were immunostained with GFP
c Ischemia (30 min) Reperfusion (8 w) Supplementary Figure bp 300 bp Ischemia (30 min) Reperfusion (4 h) Dox 20 mg/kg i.p.
 Reperfusion (8 w) Supplementary Figure bp 300 bp Ischemia (30 min) Reperfusion (4 h) Dox 20 mg/kg i.p.") a Marker Ripk3 +/ 5 bp 3 bp b Ischemia (3 min) Reperfusion (4 h) d 2 mg/kg i.p. 1 w 5 w Sacrifice for IF size A subset for echocardiography and morphological analysis c Ischemia (3 min) Reperfusion (8
a Marker Ripk3 +/ 5 bp 3 bp b Ischemia (3 min) Reperfusion (4 h) d 2 mg/kg i.p. 1 w 5 w Sacrifice for IF size A subset for echocardiography and morphological analysis c Ischemia (3 min) Reperfusion (8
Supplemental Information. Figures. Figure S1
 Supplemental Information Figures Figure S1 Identification of JAGGER T-DNA insertions. A. Positions of T-DNA and Ds insertions in JAGGER are indicated by inverted triangles, the grey box represents the
Supplemental Information. Otic Mesenchyme Cells Regulate. Spiral Ganglion Axon Fasciculation. through a Pou3f4/EphA4 Signaling Pathway
 Neuron, Volume 73 Supplemental Information Otic Mesenchyme Cells Regulate Spiral Ganglion Axon Fasciculation through a Pou3f4/EphA4 Signaling Pathway Thomas M. Coate, Steven Raft, Xiumei Zhao, Aimee K.
SUPPLEMENTARY INFORMATION
 Supplementary Figure 1. Formation of the AA5x. a, Camera lucida drawing of embryo at 48 hours post fertilization (hpf, modified from Kimmel et al. Dev Dyn. 1995 203:253-310). b, Confocal microangiogram
Supplementary Figure 1 (previous page). EM analysis of full-length GCGR. (a) Exemplary tilt pair images of the GCGR mab23 complex acquired for Random
. EM analysis of full-length GCGR. (a) Exemplary tilt pair images of the GCGR mab23 complex acquired for Random") S1 Supplementary Figure 1 (previous page). EM analysis of full-length GCGR. (a) Exemplary tilt pair images of the GCGR mab23 complex acquired for Random Conical Tilt (RCT) reconstruction (left: -50,right:
S1 Supplementary Figure 1 (previous page). EM analysis of full-length GCGR. (a) Exemplary tilt pair images of the GCGR mab23 complex acquired for Random Conical Tilt (RCT) reconstruction (left: -50,right:
Figure S1. (A) Schematic diagram of dnrar transgene allele. (B) X-Gal staining of testis from
 Schematic diagram of dnrar transgene allele. (B) X-Gal staining of testis from") Figure S1. (A) Schematic diagram of dnrar transgene allele. (B) X-Gal staining of testis from germ cell mutants (dnrar flox/flox, Stra8-Cre +, RARElacZ) (A ), controls (dnrar flox/flox, RARElacZ) (B ),
Figure S1. (A) Schematic diagram of dnrar transgene allele. (B) X-Gal staining of testis from germ cell mutants (dnrar flox/flox, Stra8-Cre +, RARElacZ) (A ), controls (dnrar flox/flox, RARElacZ) (B ),
Supplementary Figure 1. Characterization of human carotid plaques. (a) Flash-frozen human plaques were separated into vulnerable (V) and stable (S),
 Flash-frozen human plaques were separated into vulnerable (V) and stable (S),") Supplementary Figure 1. Characterization of human carotid plaques. (a) Flash-frozen human plaques were separated into vulnerable (V) and stable (S), regions which were then quantified for mean fluorescence
Supplementary Figure 1. Characterization of human carotid plaques. (a) Flash-frozen human plaques were separated into vulnerable (V) and stable (S), regions which were then quantified for mean fluorescence
Songbirds possess a spontaneous ability to discriminate syntactic rules
 Songbirds possess a spontaneous ability to discriminate syntactic rules Kentaro Abe and Dai Watanabe Supplementary Figures 1 4 and Legends 1 Supplementary Fig. 1. (a) SMSD-test on a single bird (S24).
COPD lungs show an attached stratified mucus layer that separate. bacteria from the epithelial cells resembling the protective colonic
 COPD lungs show an attached stratified mucus layer that separate bacteria from the epithelial cells resembling the protective colonic mucus SUPPLEMENTARY TABLES AND FIGURES Tables S1 S8, page 1 and separate
GPR120 *** * * Liver BAT iwat ewat mwat Ileum Colon. UCP1 mrna ***
 a GPR120 GPR120 mrna/ppia mrna Arbitrary Units 150 100 50 Liver BAT iwat ewat mwat Ileum Colon b UCP1 mrna Fold induction 20 15 10 5 - camp camp SB202190 - - - H89 - - - - - GW7647 Supplementary Figure
Reward prediction based on stimulus categorization in. primate lateral prefrontal cortex
 Reward prediction based on stimulus categorization in primate lateral prefrontal cortex Xiaochuan Pan, Kosuke Sawa, Ichiro Tsuda, Minoro Tsukada, Masamichi Sakagami Supplementary Information This PDF file
Pancreas Quizzes c. Both A and B a. Directly into the blood stream (not using ducts)
") Pancreas Quizzes Quiz 1 1. The pancreas produces hormones. Which type of hormone producing organ is the pancreas? a. Endocrine b. Exocrine c. Both A and B d. Neither A or B 2. Endocrine indicates hormones
Pancreas Quizzes Quiz 1 1. The pancreas produces hormones. Which type of hormone producing organ is the pancreas? a. Endocrine b. Exocrine c. Both A and B d. Neither A or B 2. Endocrine indicates hormones
Quantification of early stage lesions for loss of p53 should be shown in the main figures.
 Reviewer #1 (Remarks to the Author): Expert in prostate cancer The manuscript "Clonal dynamics following p53 loss of heterozygosity in Kras-driven cancers" uses a number of novel genetically engineered
Autonomic regulation of islet hormone secretion
 Autonomic regulation of islet hormone secretion Implications for health and disease Billy & Bree Paper 1: Autonomic regulation of islet hormone secretion : Implications for health and disease By Team BBB
(a) Schematic diagram of the FS mutation of UVRAG in exon 8 containing the highly instable
 Schematic diagram of the FS mutation of UVRAG in exon 8 containing the highly instable") Supplementary Figure 1. Frameshift (FS) mutation in UVRAG. (a) Schematic diagram of the FS mutation of UVRAG in exon 8 containing the highly instable A 10 DNA repeat, generating a premature stop codon
Supplementary Figure 1. Frameshift (FS) mutation in UVRAG. (a) Schematic diagram of the FS mutation of UVRAG in exon 8 containing the highly instable A 10 DNA repeat, generating a premature stop codon
Supplementary Figure 1. Characterization of NMuMG-ErbB2 and NIC breast cancer cells expressing shrnas targeting LPP. NMuMG-ErbB2 cells (a) and NIC
 and NIC") Supplementary Figure 1. Characterization of NMuMG-ErbB2 and NIC breast cancer cells expressing shrnas targeting LPP. NMuMG-ErbB2 cells (a) and NIC cells (b) were engineered to stably express either a LucA-shRNA
Supplementary Figure 1. Characterization of NMuMG-ErbB2 and NIC breast cancer cells expressing shrnas targeting LPP. NMuMG-ErbB2 cells (a) and NIC cells (b) were engineered to stably express either a LucA-shRNA
Supplementary Figure 1: si-craf but not si-braf sensitizes tumor cells to radiation.
 Supplementary Figure 1: si-craf but not si-braf sensitizes tumor cells to radiation. (a) Embryonic fibroblasts isolated from wildtype (WT), BRAF -/-, or CRAF -/- mice were irradiated (6 Gy) and DNA damage
Supplemental Table 1: Demographics and characteristics of study participants. Male, n (%) 3 (20%) 6 (50%) Age, years [mean ± SD] 33.3 ± ± 9.
![Supplemental Table 1: Demographics and characteristics of study participants. Male, n (%) 3 (20%) 6 (50%) Age, years [mean ± SD] 33.3 ± ± 9.](/thumbs/90/103696086.jpg "Supplemental Table 1: Demographics and characteristics of study participants. Male, n (%) 3 (20%) 6 (50%) Age, years [mean ± SD] 33.3 ± ± 9.") SUPPLEMENTAL DATA Supplemental Table 1: Demographics and characteristics of study participants Lean (n=15) Obese (n=12) Male, n (%) 3 (20%) 6 (50%) Age, years [mean ± SD] 33.3 ± 9.5 44.8 ± 9.1 White, n
SUPPLEMENTAL DATA Supplemental Table 1: Demographics and characteristics of study participants Lean (n=15) Obese (n=12) Male, n (%) 3 (20%) 6 (50%) Age, years [mean ± SD] 33.3 ± 9.5 44.8 ± 9.1 White, n
glucagon receptor AgRP merged color map I corr = 0.76±0.024 glucagon receptor DAPI merged
 Hypothalamic glucagon signaling inhibits glucose production Patricia I. Mighiu*, Jessica T.Y. Yue*, Beatrice M. Filippi, Mona A. Abraham, Madhu Chari, Carol K.L. Lam, Clair S. Yang, Nikita R. Christian,
Supplemental Information. Increased 4E-BP1 Expression Protects. against Diet-Induced Obesity and Insulin. Resistance in Male Mice
 Cell Reports, Volume 16 Supplemental Information Increased 4E-BP1 Expression Protects against Diet-Induced Obesity and Insulin Resistance in Male Mice Shih-Yin Tsai, Ariana A. Rodriguez, Somasish G. Dastidar,
Supplementary Materials for
 www.sciencesignaling.org/cgi/content/full/8/407/ra127/dc1 Supplementary Materials for Loss of FTO in adipose tissue decreases Angptl4 translation and alters triglyceride metabolism Chao-Yung Wang,* Shian-Sen
SUPPLEMENTARY FIGURES
 SUPPLEMENTARY FIGURES Supplementary Figure 1. (A) Left, western blot analysis of ISGylated proteins in Jurkat T cells treated with 1000U ml -1 IFN for 16h (IFN) or left untreated (CONT); right, western
Disease Models & Mechanisms DMM RESEARCH ARTICLE. Nelson S. Yee 1,2, *, Weiqiang Zhou 1,2,, and I-Chau Liang 1,2,,
 Disease Models & Mechanisms 4, 240-254 (2011) doi:10.1242/dmm.004564 Transient receptor potential ion channel Trpm7 regulates exocrine pancreatic epithelial proliferation by Mg 2+ -sensitive Socs3a signaling