Grade of steatosis. group Case No. Supplementary Figure 1:
|
|
|
- Paulina Harvey
- 5 years ago
- Views:
Transcription
1 a Supplementary Figure 1: b group Case No Grade of steatosis 15m AL 2746 NN 1 15m AL 2746 BN 1 15m AL LN 3 15m AL RN 3 12m AL 2640 RN 0 12m AL 2640 BN 1 12m AL 2640 LN 2 12m AL 2635 NN 2 12m DR 2629 RN 0 12m DR RN 0 12m DR 2629 BN 0 12m DR 2629 LN 0 15m DR 2633 BN 0 15m DR LN 1 15m DR 2633 LN 0 15m DR W 0 a) Body weights of mice in all experimental groups. b) Steatosis scoring on H&E stained mouse liver sections at 12m and 15m of age (scores: 0 <5%, 1 = 5-33%, 2 = 34-66%, 3 = %). Data per animal (dots) and means ± SD are shown. Mouse numbers for body weights are AL3m: n=5; AL/DR12m: n=7; AL/DR15m: n=10, crossover: n=7. Significant differences (ONE WAY ANOVA) are indicated with * P 0.05 and ** P
2 Supplementary Figure 2: Further markers of cell senescence in mouse livers a) Average numbers of -H2A.X foci per hepatocyte (n=5). b) Average numbers of TAF per hepatocyte (n=5). c) Average numbers of SADS per hepatocyte (n=4). d) Plots of multiple senescence markers (percentage of karyomegalic hepatocytes, hepatocytes with 2 and 3 TAF or with 4 SADS) over all experimental groups show similar patterns. e) - h) Hepatocytes were separated into normal (nuclear cross-sectional area <127 m 2 ) and karyomegalic (nuclear crosssectional area 127 m 2 ) e) frequencies of p38-positive cells in both groups (n=3), f) frequencies of 4-HNE positive hepatocytes (n=3), g) average numbers of TAF per hepatocyte nucleus (n=3), h) average numbers of SADS per hepatocyte nucleus (n=3), i) frequency of CD3+ cells per hepatocyte (n=5), j) frequency of CD68+ cells per hepatocyte (n=5). Data per animal (dots) and means ± SD are shown. Significant differences (ONE WAY ANOVA, ttest) are indicated with * P 0.05 and ** P
3 Supplementary Figure 3: Senescence marker after AP and senolytic treatment in old, high fat fed and db/db mice a)-d) 27 months old INK-ATTAK mice show no differences in a) body weight (n=6-8) and b) liver/body weight ratio (n=6-8). c) Percentages of -H2A.X positive hepatocytes (n=6) and d) average numbers of TAF per hepatocyte decrease significantly after treatment with AP and senolytic drugs (n=6). e)-i) 15 months old INK-ATTAK mice under standard chow or high fat diet. e) Average number of TAF per hepatocyte (n=6) and f) number of SA- -Gal positive hepatocytes increase in animals on high fat feeding and decrease significantly after treatment with AP (n=5-10). g), h) Showing correlations positive between the average number of TAF per hepatocyte with senescent markers p16/egfp and karyomegaly. i) Representative images of RNA-ISH staining for p16 and egfp on adjacent sections shows positive cells in the same area (red/pink = p16/egfp, blue = haematoxylin, scale bar 50 m). k)-m) db/db mice k) Average number of TAF per hepatocyte (n=6), l) % of TAF + hepatocytes (n=6) and m) % of Oil Red O positive area are significantly increased in db/db animals and decreased significantly after treatment with senolytic drugs (n=6). Data per animal (dots) and means ± SD are shown. Significant differences (ONE WAY ANOVA) are indicated with * P 0.05 and ** P
4 Supplementary Figure 4: Hepatocyte specific senescence leads to fat accumulation in liver a) 6 (n=3) and 12 (n=5) months old Alb-Xpg mice show a significant increase in the average number of telomere associated foci (TAF) per hepatocyte. All data are mean ± SD 3-5 animals per group. Significant differences (ONE WAY ANOVA) are indicated with * P 0.05 and ** P
5
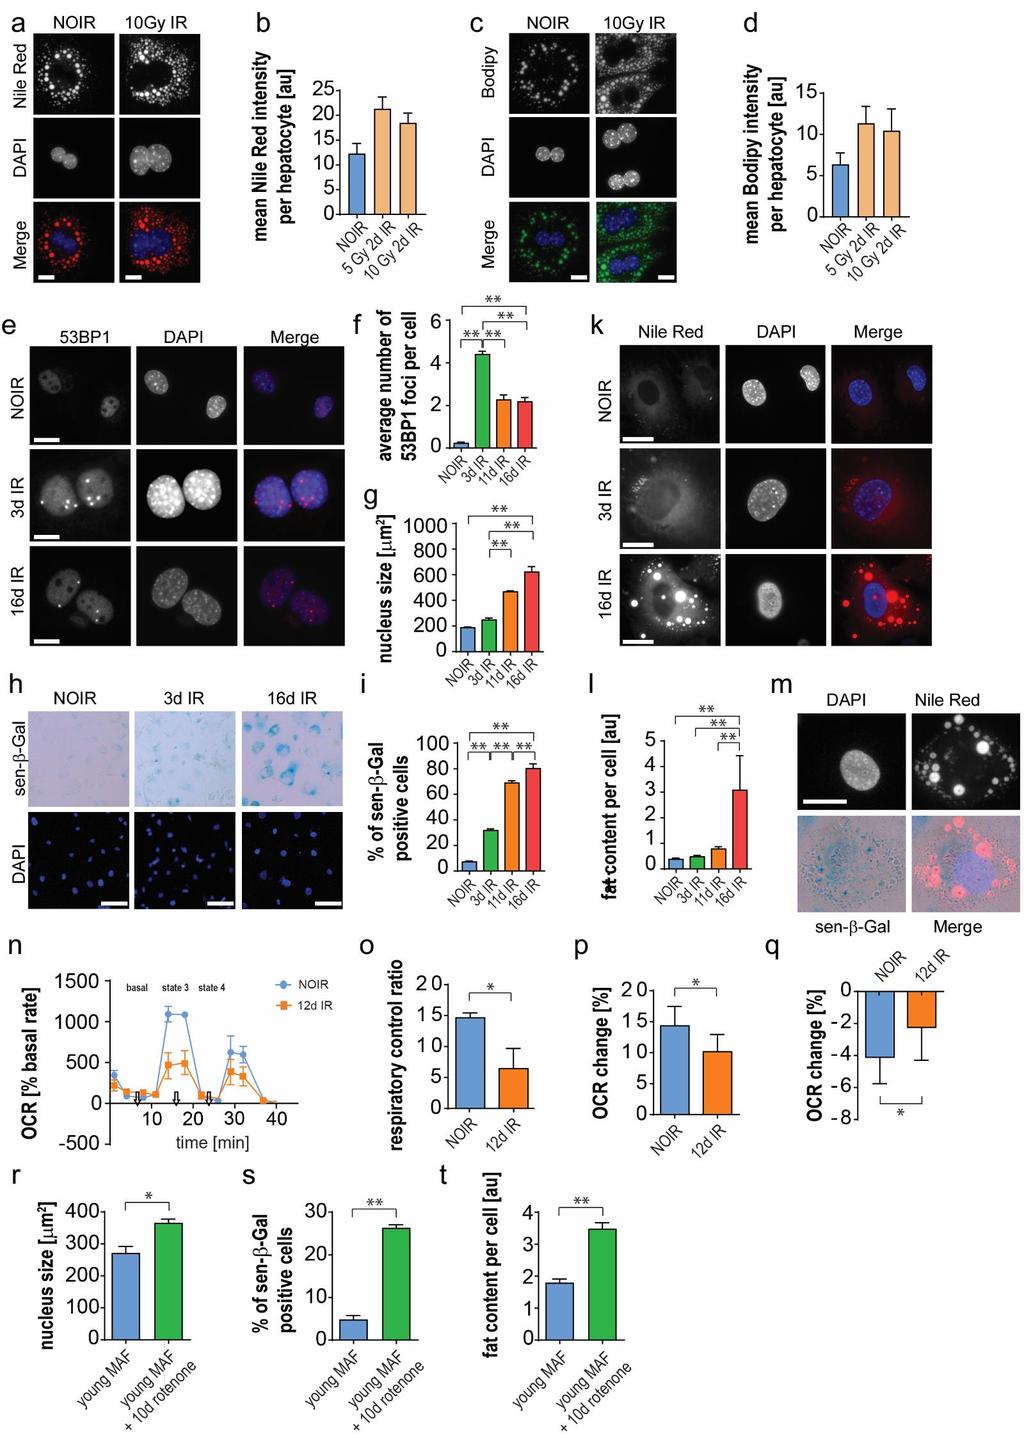
6 Supplementary Figure 5: Induction of senescence causes mitochondrial dysfunction and reduces fatty acid oxidation capacity, resulting in fat accumulation in senescent cells Fluorescent staining for Nile Red and BODIPY 493/503 show similar staining patterns as well as a similar increase in staining after IR. a, c) Representative images showing Nile Red and BODIPY 493/503 staining in hepatocytes after NOIR or 2 days after 5/10 Gy IR. (Merge: blue=dapi, red=nile Red (scale bar 20 m), green= BODIPY 493/503 (scale bar 10 m), b, d) mean Nile red and BODIPY 493/503 intensity show a similar increase in fat content per hepatocyte after IR. Mouse adult ear fibroblasts (MAF) acquire a senescent phenotype over one to two weeks after 10Gy IR: e) representative images showing 53BP1 DNA damage foci in non-irradiated MAFs (NOIR) and at 3 and 16 days after IR, Merge: blue=dapi, red =53BP1 (scale bar=10 m), f) frequencies of 53BP1 foci, g) nuclear size, h) representative images showing Sen- -Gal staining in NOIR, 3 and 16 days after IR (scale bar=50 m), i) frequencies of Sen- -Gal positive cells, k) Representative images showing Nile Red staining in NOIR, 3 and 16 days after IR. Merge: blue=dapi, red =Nile Red, scale bar=20 m, l) Average fluorescent intensity of Nile Red staining in MAFs before and after irradiation. m) Sen- -Gal positive MAF show accumulation of lipids (Merge: blue=dapi, red=nile Red, light blue=sen- -Gal, scale bar=10 m), n) A representative experiment showing oxygen consumption rates (OCR) from permeabilised MAFs without irradiation or at 12 days after IR, o) Respiratory control ratios were calculated as OCR at state 3 (in the presence of ADP) divided by state 4 (in the presence of oligomycin). p) Change in OCR after addition of the fatty acid palmitate as substrate, q) Change in OCR after inhibition of fatty acid oxidation by etomoxir. MAF were treated with rotenone (100nM) for 10days and showed an increase r) in nucleus size, s) the percentage of Sen- -Gal positive cells and t) in the average fluorescence intensity of Nile Red staining. Data b, d, i, r-t are mean ± SEM and f-l, n-q are SD with 3-4 animals per group. Significant differences (ONE WAY ANOVA) are indicated with * P 0.05 and ** P
7 Supplementary Figure 6: Correlations between additional senescence markers and NAFLD scores in patients. Markers of senescence increase with NAFLD score. a) Correlation between the average number of TAF per hepatocyte and fat content (R 2 =0.5805) b) Correlation between the average number of TAF per hepatocyte and NAS score (R 2 =0.6778), c) Correlation between the average number of TAF per hepatocyte and steatosis score of NAFLD patients (R 2 =0.5938), d) weak correlation between frequency of p21 positive hepatocytes and steatosis score of NAFLD patients (R 2 =0.4218). e) Weak correlation between the average number of TAF per hepatocyte and frequency of p21 positive hepatocytes per patient (R 2 =0.4287). All data are means (frequencies of TAF per hepatocyte, p21+ cells) or scores per patient, n=9.
SUPPLEMENTARY INFORMATION
 DOI: 10.1038/ncb3461 In the format provided by the authors and unedited. Supplementary Figure 1 (associated to Figure 1). Cpeb4 gene-targeted mice develop liver steatosis. a, Immunoblot displaying CPEB4
Supplementary Figure 1: Additional metabolic parameters of obesity mouse models and controls. (a) Body weight, (b) blood glucose and (c) insulin
 Body weight, (b) blood glucose and (c) insulin") Supplementary Figure 1: Additional metabolic parameters of obesity mouse models and controls. (a) Body weight, (b) blood glucose and (c) insulin resistance index of homeostatic model assessment (HOMA IR)
Supplementary Figure 1: Additional metabolic parameters of obesity mouse models and controls. (a) Body weight, (b) blood glucose and (c) insulin resistance index of homeostatic model assessment (HOMA IR)
Nature Immunology: doi: /ni Supplementary Figure 1
 Supplementary Figure 1 Fatty acid oxidation is emphasized in 1 macrophages compared with that in macrophages. Gene expression of mitochondrial OXPHOS (Atp5j, Cox4i1, Uqcrc1/2, Ndufs1, Sdhb) and β-oxidation
Supplementary Figure 1: si-craf but not si-braf sensitizes tumor cells to radiation.
 Supplementary Figure 1: si-craf but not si-braf sensitizes tumor cells to radiation. (a) Embryonic fibroblasts isolated from wildtype (WT), BRAF -/-, or CRAF -/- mice were irradiated (6 Gy) and DNA damage
NASH Bench to Bedside
 NASH Bench to Bedside October 2006 Anna Mae Diehl, M.D. Gastroenterology Division Duke University NonAlcoholic Fatty Liver Disease Common ~1/4-1/3 1/3 US adults Outcome highly variable Course indolent
SUPPLEMENTARY INFORMATION
 doi:10.1038/nature12652 Supplementary Figure 1. PRDM16 interacts with endogenous EHMT1 in brown adipocytes. Immunoprecipitation of PRDM16 complex by flag antibody (M2) followed by Western blot analysis
Supplementary Table 1 Gene clone ID for ShRNA-mediated gene silencing TNFα downstream signals in in vitro Symbol Gene ID RefSeqID Clone ID
 1 2 3 4 5 6 7 8 9 10 11 12 13 14 15 16 17 18 19 20 21 22 23 24 25 26 27 28 29 30 31 32 33 34 35 36 37 38 39 40 41 42 43 44 Supplementary Table 1 Gene clone ID for ShRNA-mediated gene silencing TNFα downstream
Prolonged mitotic arrest induces a caspase-dependent DNA damage
 SUPPLEMENTARY INFORMATION Prolonged mitotic arrest induces a caspase-dependent DNA damage response at telomeres that determines cell survival Karolina O. Hain, Didier J. Colin, Shubhra Rastogi, Lindsey
SUPPLEMENTARY INFORMATION
 DOI: 10.1038/ncb2211 a! mir-143! b! mir-103/107! let-7a! mir-144! mir-122a! mir-126-3p! mir-194! mir-27a! mir-30c! Figure S1 Northern blot analysis of mir-143 expression dependent on feeding conditions.
Supplementary Figure S1. Effect of Glucose on Energy Balance in WT and KHK A/C KO
 Supplementary Figure S1. Effect of Glucose on Energy Balance in WT and KHK A/C KO Mice. WT mice and KHK-A/C KO mice were provided drinking water containing 10% glucose or tap water with normal chow ad
Supplementary Figure 1 IMQ-Induced Mouse Model of Psoriasis. IMQ cream was
 Supplementary Figure 1 IMQ-Induced Mouse Model of Psoriasis. IMQ cream was painted on the shaved back skin of CBL/J and BALB/c mice for consecutive days. (a, b) Phenotypic presentation of mouse back skin
Supplementary Figure S1: Defective heterochromatin repair in HGPS progeroid cells
 Supplementary Figure S1: Defective heterochromatin repair in HGPS progeroid cells Immunofluorescence staining of H3K9me3 and 53BP1 in PH and HGADFN003 (HG003) cells at 24 h after γ-irradiation. Scale bar,
Supplementary figure 1 (related to fig 1)
") Histological score linical Score Weight loss (%) olon length (cm) Supplementary figure (related to fig ) N ### ## ays on % E ### - - - - N ays on % $$ $$ # ## N. N N Supplementary figure : Lack of fibre
Histological score linical Score Weight loss (%) olon length (cm) Supplementary figure (related to fig ) N ### ## ays on % E ### - - - - N ays on % $$ $$ # ## N. N N Supplementary figure : Lack of fibre
18s AAACGGCTACCACATCCAAG CCTCCAATGGATCCTCGTTA. 36b4 GTTCTTGCCCATCAGCACC AGATGCAGCAGATCCGCAT. Acc1 AGCAGATCCGCAGCTTG ACCTCTGCTCGCTGAGTGC
 Supplementary Table 1. Quantitative PCR primer sequences Gene symbol Sequences (5 to 3 ) Forward Reverse 18s AAACGGCTACCACATCCAAG CCTCCAATGGATCCTCGTTA 36b4 GTTCTTGCCCATCAGCACC AGATGCAGCAGATCCGCAT Acc1
Supplementary Figure 1
 Supplementary Figure 1 A B mir-141, human cell lines mir-2c, human cell lines mir-141, hepatocytes mir-2c, hepatocytes Relative RNA.1.8.6.4.2 Relative RNA.3.2.1 Relative RNA 1.5 1..5 Relative RNA 2. 1.5
Application Note. Introduction
 Simultaneously Measuring Oxidation of Exogenous and Endogenous Fatty Acids Using the XF Palmitate-BSA FAO Substrate with the Agilent Seahorse XF Cell Mito Stress Test Application Note Introduction The
McWilliams et al., http :// /cgi /content /full /jcb /DC1
 Supplemental material JCB McWilliams et al., http ://www.jcb.org /cgi /content /full /jcb.201603039 /DC1 THE JOURNAL OF CELL BIOLOGY Figure S1. In vitro characterization of mito-qc. (A and B) Analysis
Supplementary Figure 1) GABAergic enhancement by leptin hyperpolarizes POMC neurons A) Representative recording samples showing the membrane
 GABAergic enhancement by leptin hyperpolarizes POMC neurons A) Representative recording samples showing the membrane") Supplementary Figure 1) GABAergic enhancement by leptin hyperpolarizes POMC neurons A) Representative recording samples showing the membrane potential recorded from POMC neurons following treatment with
Supplementary Figure 1) GABAergic enhancement by leptin hyperpolarizes POMC neurons A) Representative recording samples showing the membrane potential recorded from POMC neurons following treatment with
Supplementary Figures
 Supplementary Figures Supplementary Figure 1 Characterization of stable expression of GlucB and sshbira in the CT26 cell line (a) Live cell imaging of stable CT26 cells expressing green fluorescent protein
Males- Western Diet WT KO Age (wks) Females- Western Diet WT KO Age (wks)
 Females- Western Diet WT KO Age (wks)") Relative Arv1 mrna Adrenal 33.48 +/- 6.2 Skeletal Muscle 22.4 +/- 4.93 Liver 6.41 +/- 1.48 Heart 5.1 +/- 2.3 Brain 4.98 +/- 2.11 Ovary 4.68 +/- 2.21 Kidney 3.98 +/-.39 Lung 2.15 +/-.6 Inguinal Subcutaneous
Relative Arv1 mrna Adrenal 33.48 +/- 6.2 Skeletal Muscle 22.4 +/- 4.93 Liver 6.41 +/- 1.48 Heart 5.1 +/- 2.3 Brain 4.98 +/- 2.11 Ovary 4.68 +/- 2.21 Kidney 3.98 +/-.39 Lung 2.15 +/-.6 Inguinal Subcutaneous
Supplementary material. Supplementary Figure legends
 Supplementary material Supplementary Figure legends Supplementary Figure 1: Senescence-associated proliferation stop in response to oncogenic N-RAS expression Proliferation of NHEM cells without (ctrl.)
Supplementary Fig. 1. GPRC5A post-transcriptionally down-regulates EGFR expression. (a) Plot of the changes in steady state mrna levels versus
 Plot of the changes in steady state mrna levels versus") Supplementary Fig. 1. GPRC5A post-transcriptionally down-regulates EGFR expression. (a) Plot of the changes in steady state mrna levels versus changes in corresponding proteins between wild type and Gprc5a-/-
Supplementary Fig. 1. GPRC5A post-transcriptionally down-regulates EGFR expression. (a) Plot of the changes in steady state mrna levels versus changes in corresponding proteins between wild type and Gprc5a-/-
SUPPLEMENTARY INFORMATION
 SUPPLEMENTARY INFORMATION doi:10.1038/nature11464 Supplemental Figure S1. The expression of Vegfb is increased in obese and diabetic mice as compared to lean mice. a-b, Body weight and postprandial blood
Supplementary Figure S I: Effects of D4F on body weight and serum lipids in apoe -/- mice.
 Supplementary Figures: Supplementary Figure S I: Effects of D4F on body weight and serum lipids in apoe -/- mice. Male apoe -/- mice were fed a high-fat diet for 8 weeks, and given PBS (model group) or
Expanded View Figures
 PEX13 functions in selective autophagy Ming Y Lee et al Expanded View Figures Figure EV1. PEX13 is required for Sindbis virophagy. A, B Quantification of mcherry-capsid puncta per cell (A) and GFP-LC3
Supplementary Figure 1 Induction of cellular senescence and isolation of exosome. a to c, Pre-senescent primary normal human diploid fibroblasts
 Supplementary Figure 1 Induction of cellular senescence and isolation of exosome. a to c, Pre-senescent primary normal human diploid fibroblasts (TIG-3 cells) were rendered senescent by either serial passage
Supplemental Information. Increased 4E-BP1 Expression Protects. against Diet-Induced Obesity and Insulin. Resistance in Male Mice
 Cell Reports, Volume 16 Supplemental Information Increased 4E-BP1 Expression Protects against Diet-Induced Obesity and Insulin Resistance in Male Mice Shih-Yin Tsai, Ariana A. Rodriguez, Somasish G. Dastidar,
Supplementary Figure 1. DJ-1 modulates ROS concentration in mouse skeletal muscle.
 Supplementary Figure 1. DJ-1 modulates ROS concentration in mouse skeletal muscle. (a) mrna levels of Dj1 measured by quantitative RT-PCR in soleus, gastrocnemius (Gastroc.) and extensor digitorum longus
ERK1/2/MAPK pathway-dependent regulation of the telomeric factor TRF2
 ERK1/2/MAPK pathway-dependent regulation of the telomeric factor TRF2 SUPPLEMENTARY FIGURES AND TABLE Supplementary Figure S1: Conservation of the D domain throughout evolution. Alignment of TRF2 sequences
High Fat Diets Induce Colonic Epithelial Cell Stress and Inflammation that is Reversed by IL-22
 Supplementary Information High Fat Diets Induce Colonic Epithelial Cell Stress and Inflammation that is Reversed by IL-22 Max Gulhane 1, Lydia Murray 1, Rohan Lourie 1, Hui Tong 1, Yong H. Sheng 1, Ran
MII. Supplement Figure 1. CapZ β2. Merge. 250ng. 500ng DIC. Merge. Journal of Cell Science Supplementary Material. GFP-CapZ β2 DNA
 A GV GVBD MI DNA CapZ β2 CapZ β2 Merge B DIC GFP-CapZ β2 Merge CapZ β2-gfp 250ng 500ng Supplement Figure 1. MII A early MI late MI Control RNAi CapZαβ DNA Actin Tubulin B Phalloidin Intensity(A.U.) n=10
Supplementary Figure 1 The ability to regenerate an ear hole is discontinuous with wound healing. Ear-hole closure at D85 for each sex within each
 Supplementary Figure 1 The ability to regenerate an ear hole is discontinuous with wound healing. Ear-hole closure at D85 for each sex within each species observed. Data show a binary response to a 4 mm
Reason for Dissection. Pleomorphic adenoma. Tongue base adenocarcinoma
 Supplementary Table S1 Human Patients Patient Sample No. Gender Age Additional Medication Treatment 1 Reason for Dissection Total Irradiation Dose Estimated Irradiation Dose to SG Gland Time of Resection
1.5 ASK1KO fed. fasted 16 hrs w/o water. Fed. 4th. 4th WT ASK1KO N=29, 11(WT), ,5(ASK1KO) ASK1KO ASK1KO **** Time [h]
![1.5 ASK1KO fed. fasted 16 hrs w/o water. Fed. 4th. 4th WT ASK1KO N=29, 11(WT), ,5(ASK1KO) ASK1KO ASK1KO **** Time [h]](/thumbs/87/97258189.jpg "1.5 ASK1KO fed. fasted 16 hrs w/o water. Fed. 4th. 4th WT ASK1KO N=29, 11(WT), ,5(ASK1KO) ASK1KO ASK1KO **** Time [h]") 7: 13: 19: 1: 7: 151117 a 151117 4th 4th b c RQ.95 KO.9.85.8.75.7 light dark light dark.65 7: 19: 7: 19: 7: Means ± SEM, N=6 RQ 1..9.8.7.6.6 KO CL (-) CL (+) ibat weight ratio (/body weight) [%].5.4.3.2.1
7: 13: 19: 1: 7: 151117 a 151117 4th 4th b c RQ.95 KO.9.85.8.75.7 light dark light dark.65 7: 19: 7: 19: 7: Means ± SEM, N=6 RQ 1..9.8.7.6.6 KO CL (-) CL (+) ibat weight ratio (/body weight) [%].5.4.3.2.1
Supplementary Table 1. Characterization of HNSCC PDX models established at MSKCC
 Supplementary Table 1. Characterization of HNSCC PDX models established at MSKCC Supplementary Table 2. Drug content and loading efficiency estimated with F-NMR and UV- Vis Supplementary Table 3. Complete
Nature Biotechnology: doi: /nbt Supplementary Figure 1. Analysis of hair bundle morphology in Ush1c c.216g>a mice at P18 by SEM.
 Supplementary Figure 1 Analysis of hair bundle morphology in Ush1c c.216g>a mice at P18 by SEM. (a-c) Heterozygous c.216ga mice displayed normal hair bundle morphology at P18. (d-i) Disorganized hair bundles
Supplementary Table 1. Primer Sequences Used for Quantitative Real-Time PCR
 Supplementary Table 1. Primer Sequences Used for Quantitative Real-Time PCR Gene Forward Primer (5-3 ) Reverse Primer (5-3 ) cadl CTTGGGGGCGCGTCT CTGTTCTTTTGTGCCGTTTCG cyl-coenzyme Dehydrogenase, very
Supplemental Table 1. Primers used for RT-PCR analysis of inflammatory cytokines Gene Primer Sequence
 Supplemental Table 1. Primers used for RT-PCR analysis of inflammatory cytokines Gene Primer Sequence IL-1α Forward primer 5 -CAAGATGGCCAAAGTTCGTGAC-3' Reverse primer 5 -GTCTCATGAAGTGAGCCATAGC-3 IL-1β
c Ischemia (30 min) Reperfusion (8 w) Supplementary Figure bp 300 bp Ischemia (30 min) Reperfusion (4 h) Dox 20 mg/kg i.p.
 Reperfusion (8 w) Supplementary Figure bp 300 bp Ischemia (30 min) Reperfusion (4 h) Dox 20 mg/kg i.p.") a Marker Ripk3 +/ 5 bp 3 bp b Ischemia (3 min) Reperfusion (4 h) d 2 mg/kg i.p. 1 w 5 w Sacrifice for IF size A subset for echocardiography and morphological analysis c Ischemia (3 min) Reperfusion (8
a Marker Ripk3 +/ 5 bp 3 bp b Ischemia (3 min) Reperfusion (4 h) d 2 mg/kg i.p. 1 w 5 w Sacrifice for IF size A subset for echocardiography and morphological analysis c Ischemia (3 min) Reperfusion (8
Spleen. mlns. E Spleen 4.1. mlns. Spleen. mlns. Mock 17. Mock CD8 HIV-1 CD38 HLA-DR. Ki67. Spleen. Spleen. mlns. Cheng et al. Fig.
 C D E F Mock 17 Mock 4.1 CD38 57 CD8 23.7 HLA-DR Ki67 G H I Cheng et al. Fig.S1 Supplementary Figure 1. persistent infection leads to human T cell depletion and hyper-immune activation. Humanized mice
Supplementary Table 1. Metabolic parameters in GFP and OGT-treated mice
 Supplementary Table 1. Metabolic parameters in GFP and OGT-treated mice Fasted Refed GFP OGT GFP OGT Liver G6P (mmol/g) 0.03±0.01 0.04±0.02 0.60±0.04 0.42±0.10 A TGs (mg/g of liver) 20.08±5.17 16.29±0.8
3-Thia Fatty Acids A New Generation of Functional Lipids?
 Conference on Food Structure and Food Quality 3-Thia Fatty Acids A New Generation of Functional Lipids? Rolf K. Berge rolf.berge@med.uib.no Fatty acids- Essential cellular metabolites Concentrations must
SUPPLEMENTARY INFORMATION
 b 350 300 250 200 150 100 50 0 E0 E10 E50 E0 E10 E50 E0 E10 E50 E0 E10 E50 Number of organoids per well 350 300 250 200 150 100 50 0 R0 R50 R100 R500 1st 2nd 3rd Noggin 100 ng/ml Noggin 10 ng/ml Noggin
Supplementary Information
 Supplementary Information Notch deficiency decreases hepatic lipid accumulation by induction of fatty acid oxidation No-Joon Song,#, Ui Jeong Yun,#, Sunghee Yang, Chunyan Wu, Cho-Rong Seo, A-Ryeong Gwon,,
Supplementary Information. Tissue-wide immunity against Leishmania. through collective production of nitric oxide
 Supplementary Information Tissue-wide immunity against Leishmania through collective production of nitric oxide Romain Olekhnovitch, Bernhard Ryffel, Andreas J. Müller and Philippe Bousso Supplementary
ab Hepatic Lipid Accumulation/ Steatosis Assay Kit
 ab133131 Hepatic Lipid Accumulation/ Steatosis Assay Kit Instructions for Use For evaluating steatosis risk of drug candidates using Oil Red O to stain neutral lipids in hepatocytes. This product is for
SOD1 inhibition reduces non-small cell lung cancer by inducing cell death
 SUPPLEMENTAL INFORMATION SOD1 inhibition reduces non-small cell lung cancer by inducing cell death Andrea Glasauer, Laura A. Sena, Lauren P. Diebold, Andrew P. Mazar & Navdeep S. Chandel Inventory of Supplemental
Expanded View Figures
 Expanded View Figures A B C D E F G H I J K L Figure EV1. The dysregulated lipid metabolic phenotype of mouse models of metabolic dysfunction is most pronounced in the fasted state. A L Male 12-weeks-old
Special Staining (I)
") Special Staining (I) Carbohydrates 1- PERIODIC ACID SCHIFF'S (PAS ) Purpose: Glycogen is present in liver, kidney, skeletal and cardiac muscle. The PAS stain is used to demonstrate neutral polysaccharides
Special Staining (I) Carbohydrates 1- PERIODIC ACID SCHIFF'S (PAS ) Purpose: Glycogen is present in liver, kidney, skeletal and cardiac muscle. The PAS stain is used to demonstrate neutral polysaccharides
control kda ATGL ATGLi HSL 82 GAPDH * ** *** WT/cTg WT/cTg ATGLi AKO/cTg AKO/cTg ATGLi WT/cTg WT/cTg ATGLi AKO/cTg AKO/cTg ATGLi iwat gwat ibat
 body weight (g) tissue weights (mg) ATGL protein expression (relative to GAPDH) HSL protein expression (relative to GAPDH) ### # # kda ATGL 55 HSL 82 GAPDH 37 2.5 2. 1.5 1..5 2. 1.5 1..5.. Supplementary
Agilent Technologies: Seahorse XF Introduction
 Agilent Technologies: Seahorse XF Introduction Tools for investigating cell metabolism diagnostic procedures. 1 The Engines Cells Generate Energy via Two Metabolic Pathways Glycolysis [ H + ] Respiration
Mfn2 deletion in brown adipose tissue protects from insulin resistance and impairs thermogenesis
 Article Mfn2 deletion in brown adipose tissue protects from insulin resistance and impairs thermogenesis Kiana Mahdaviani 1,2, Ilan Y Benador 1,2, Shi Su 1, Raffi A Gharakhanian 1, Linsey Stiles 1,2, Kyle
Liver Disease NASH/Fibrosis Model
 Liver Disease NASH/Fibrosis Model Please contact: Dipti Deshpande PhD ddeshpande@woodlandpharma.com or Carol Gebert PhD cgebert@woodlandbiosciences.com 617-513-5280 Liver Diseases Comprise a Growing Market
Zhu et al, page 1. Supplementary Figures
 Zhu et al, page 1 Supplementary Figures Supplementary Figure 1: Visual behavior and avoidance behavioral response in EPM trials. (a) Measures of visual behavior that performed the light avoidance behavior
Supplementary Figure 1. SA-β-Gal positive senescent cells in various cancer tissues. Representative frozen sections of breast, thyroid, colon and
 Supplementary Figure 1. SA-β-Gal positive senescent cells in various cancer tissues. Representative frozen sections of breast, thyroid, colon and stomach cancer were stained with SA-β-Gal and nuclear fast
Supplementary Information
 Supplementary Information GADD34-deficient mice develop obesity, nonalcoholic fatty liver disease, hepatic carcinoma and insulin resistance Naomi Nishio and Ken-ichi Isobe Department of Immunology, Nagoya
Supplementary Figure 1. DNA methylation of the adiponectin promoter R1, Pparg2, and Tnfa promoter in adipocytes is not affected by obesity.
 Supplementary Figure 1. DNA methylation of the adiponectin promoter R1, Pparg2, and Tnfa promoter in adipocytes is not affected by obesity. (a) Relative amounts of adiponectin, Ppar 2, C/ebp, and Tnf mrna
University of Groningen. Non-alcoholic fatty liver disease Sheedfar, Fareeba
 University of Groningen Non-alcoholic fatty liver disease Sheedfar, Fareeba IMPORTANT NOTE: You are advised to consult the publisher's version (publisher's PDF) if you wish to cite from it. Please check
Supplemental Materials
 Supplemental Materials Programmed death one homolog maintains the pool size of regulatory T cells by promoting their differentiation and stability Qi Wang 1, Jianwei He 1, Dallas B. Flies 2, Liqun Luo
Supplementary Figure 1
 Supplementary Figure 1 how HFD how HFD Epi WT p p Hypothalamus p p Inguinal WT T Liver Lean mouse adipocytes p p p p p p Obese mouse adipocytes Kidney Muscle Spleen Heart p p p p p p p p Extracellular
Supplementary Figure S1
 Supplementary Figure S1 Supplementary Figure S1. PARP localization patterns using GFP-PARP and PARP-specific antibody libraries GFP-PARP localization in non-fixed (A) and formaldehyde fixed (B) GFP-PARPx
Targeting of the circadian clock via CK1δ/ε to improve glucose homeostasis in obesity
 Targeting of the circadian clock via CK1δ/ε to improve glucose homeostasis in obesity Peter S. Cunningham, Siobhán A. Ahern, Laura C. Smith, Carla S. da Silva Santos, Travis T. Wager and David A. Bechtold
fl/+ KRas;Atg5 fl/+ KRas;Atg5 fl/fl KRas;Atg5 fl/fl KRas;Atg5 Supplementary Figure 1. Gene set enrichment analyses. (a) (b)
 (b)") KRas;At KRas;At KRas;At KRas;At a b Supplementary Figure 1. Gene set enrichment analyses. (a) GO gene sets (MSigDB v3. c5) enriched in KRas;Atg5 fl/+ as compared to KRas;Atg5 fl/fl tumors using gene set
KRas;At KRas;At KRas;At KRas;At a b Supplementary Figure 1. Gene set enrichment analyses. (a) GO gene sets (MSigDB v3. c5) enriched in KRas;Atg5 fl/+ as compared to KRas;Atg5 fl/fl tumors using gene set
Hormonal gain control of a medial preoptic area social reward circuit
 CORRECTION NOTICE Nat. Neurosci. 20, 449 458 (2017) Hormonal gain control of a medial preoptic area social reward circuit Jenna A McHenry, James M Otis, Mark A Rossi, J Elliott Robinson, Oksana Kosyk,
LPS LPS P6 - + Supplementary Fig. 1.
 P6 LPS - - - + + + - LPS + + - - P6 + Supplementary Fig. 1. Pharmacological inhibition of the JAK/STAT blocks LPS-induced HMGB1 nuclear translocation. RAW 267.4 cells were stimulated with LPS in the absence
Supplemental Fig. 1. Changes in fat and lean mass determined by DEXA. Fat mass in high fat-fed
 Supplemental Fig. 1. hanges in fat and lean mass determined by EXA. Fat mass in high fat-fed mice (A) and chow-fed controls (). Lean mass in high fat-fed mice () and chow-fed controls (). ata represent
CHAPTER V LOSS OF HISTONE DEACETYLASE 3 INCREASES SUSCEPTIBILITY FOR GENOMIC DAMAGE AND DISEASE DEVELOPMENT. Background and Significance
 CHAPTER V LOSS OF HISTONE DEACETYLASE 3 INCREASES SUSCEPTIBILITY FOR GENOMIC DAMAGE AND DISEASE DEVELOPMENT Background and Significance The metabolic syndrome (MetS) is defined in an individual who has
activation with anti-cd3/cd28 beads and 3d following transduction. Supplemental Figure 2 shows
 Supplemental Data Supplemental Figure 1 compares CXCR4 expression in untreated CD8 + T cells, following activation with anti-cd3/cd28 beads and 3d following transduction. Supplemental Figure 2 shows the
Supplementary Fig. 1: TBR2+ cells in different brain regions.
 Hip SVZ OB Cere Hypo Supplementary Fig. 1: TBR2 + cells in different brain regions. Three weeks after the last tamoxifen injection, TBR2 immunostaining images reveal a large reduction of TBR2 + cells in
DM, NAFLD, and conjugated linoleic acid (omega 6); what is the link
; what is the link") DM, NAFLD, and conjugated linoleic acid (omega 6); what is the link Mona Hegazy Professor of Internal Medicine Hepatology Department Cairo University Egypt Agenda Congugated lionleic fatty acid NAFLD
DM, NAFLD, and conjugated linoleic acid (omega 6); what is the link Mona Hegazy Professor of Internal Medicine Hepatology Department Cairo University Egypt Agenda Congugated lionleic fatty acid NAFLD
Supplementary Figure 1. Characterization of human carotid plaques. (a) Flash-frozen human plaques were separated into vulnerable (V) and stable (S),
 Flash-frozen human plaques were separated into vulnerable (V) and stable (S),") Supplementary Figure 1. Characterization of human carotid plaques. (a) Flash-frozen human plaques were separated into vulnerable (V) and stable (S), regions which were then quantified for mean fluorescence
Supplementary Figure 1. Characterization of human carotid plaques. (a) Flash-frozen human plaques were separated into vulnerable (V) and stable (S), regions which were then quantified for mean fluorescence
SUPPLEMENTARY INFORMATION
 doi: 1.138/nature7221 Brown fat selective genes 12 1 Control Q-RT-PCR (% of Control) 8 6 4 2 Ntrk3 Cox7a1 Cox8b Cox5b ATPase b2 ATPase f1a1 Sirt3 ERRα Elovl3/Cig3 PPARα Zic1 Supplementary Figure S1. stimulates
Supplementary Figure 1 Validation of Per2 deletion in neuronal cells in N Per2 -/- mice. (a) Western blot from liver extracts of mice held under ad
 Western blot from liver extracts of mice held under ad") Supplementary Figure 1 Validation of Per2 deletion in neuronal cells in N Per2 -/- mice. (a) Western blot from liver extracts of mice held under ad libitum conditions detecting PER2 protein in brain and
Supplementary Figure 1 Validation of Per2 deletion in neuronal cells in N Per2 -/- mice. (a) Western blot from liver extracts of mice held under ad libitum conditions detecting PER2 protein in brain and
Supplementary Materials for
 www.sciencetranslationalmedicine.org/cgi/content/full/4/117/117ra8/dc1 Supplementary Materials for Notch4 Normalization Reduces Blood Vessel Size in Arteriovenous Malformations Patrick A. Murphy, Tyson
doi: /nature14508 Rappsilber et al.
 SUPPLEMENTARY INFORMATION doi:1.138/nature1458 Grosso et al. Barbosa et al. 74 72 45 33 47 7 51 Rappsilber et al. Supplementary Figure 1 a, Venn-Diagram of identified splice factors in the work of Barbossa
and follicular helper T cells is Egr2-dependent. (a) Diagrammatic representation of the
 Diagrammatic representation of the") Supplementary Figure 1. LAG3 + Treg-mediated regulation of germinal center B cells and follicular helper T cells is Egr2-dependent. (a) Diagrammatic representation of the experimental protocol for the
Supplementary Figure 1. LAG3 + Treg-mediated regulation of germinal center B cells and follicular helper T cells is Egr2-dependent. (a) Diagrammatic representation of the experimental protocol for the
Main physiological functions of mitochondria
 Main physiological functions of mitochondria Energy conservation =ATP production Thermoregulatory = energy dissipation as heat Substrate production & decomposition Reactive oxygen species (ROS) Skulachev(1998)
Supplementary Figure 1
 Supplementary Figure 1 Miniature microdrive, spike sorting and sleep stage detection. a, A movable recording probe with 8-tetrodes (32-channels). It weighs ~1g. b, A mouse implanted with 8 tetrodes in
GCSE (9 1) Biology A (Gateway Science) J247/01 Paper 1 (Foundation Tier) Sample Question Paper SPECIMEN
 Biology A (Gateway Science) J247/01 Paper 1 (Foundation Tier) Sample Question Paper SPECIMEN") GCSE (9 1) Biology A (Gateway Science) J247/01 Paper 1 (Foundation Tier) Sample Question Paper F Date Morning/Afternoon Time allowed: 1 hour 45 minutes You may use: a scientific or graphical calculator
GCSE (9 1) Biology A (Gateway Science) J247/01 Paper 1 (Foundation Tier) Sample Question Paper F Date Morning/Afternoon Time allowed: 1 hour 45 minutes You may use: a scientific or graphical calculator
Time after injection (hours) ns ns
 ns ns") Platelet life span (% iotinylated platelets) 1 8 6 4 2 4 24 48 72 96 Time after injection (hours) 6 4 2 IgG GPIα GPIβ GPII GPVI Receptor expression (GeoMean, fluorescence inteity) Supplementary figure
Platelet life span (% iotinylated platelets) 1 8 6 4 2 4 24 48 72 96 Time after injection (hours) 6 4 2 IgG GPIα GPIβ GPII GPVI Receptor expression (GeoMean, fluorescence inteity) Supplementary figure
Supplementary Material
 Supplementary Material Summary: The supplementary information includes 1 table (Table S1) and 4 figures (Figure S1 to S4). Supplementary Figure Legends Figure S1 RTL-bearing nude mouse model. (A) Tumor
Suppl Video: Tumor cells (green) and monocytes (white) are seeded on a confluent endothelial
 and monocytes (white) are seeded on a confluent endothelial") Supplementary Information Häuselmann et al. Monocyte induction of E-selectin-mediated endothelial activation releases VE-cadherin junctions to promote tumor cell extravasation in the metastasis cascade
Supplementary Information Häuselmann et al. Monocyte induction of E-selectin-mediated endothelial activation releases VE-cadherin junctions to promote tumor cell extravasation in the metastasis cascade
Effect of BI-1 on insulin resistance through regulation of CYP2E1
 Effect of BI-1 on insulin resistance through regulation of CYP2E1 Geum-Hwa Lee 1, Kyoung-Jin Oh 2, 3, Hyung-Ryong Kim 4, Hye-Sook Han 2, Hwa-Young Lee 1, Keun-Gyu Park 5, Ki-Hoan Nam 6, Seung-Hoi Koo 2
Rescue of mutant rhodopsin traffic by metformin-induced AMPK activation accelerates photoreceptor degeneration Athanasiou et al
 Supplementary Material Rescue of mutant rhodopsin traffic by metformin-induced AMPK activation accelerates photoreceptor degeneration Athanasiou et al Supplementary Figure 1. AICAR improves P23H rod opsin
Supplementary Figure 1: Expression of Gli1-lacZ in E17.5 ovary and mesonephros. a,
 Supplementary Figure 1: Expression of Gli1-lacZ in E17.5 ovary and mesonephros. a, Transverse sections of E17.5 ovary and mesonephros from Gli1-LacZ reporter embryos (n=3) after LacZ staining (blue). The
Nature Medicine: doi: /nm.3891
 Supplementary Figure 1. Subjective responses. Thermal sensation, thermal comfort and self-reported shivering, determined at several time points (from t = min until t = 36 min) after entering the cold room,
6. TNF-α regulates oxidative stress, mitochondrial function and autophagy in neuronal cells
 6. TNF-α regulates oxidative stress, mitochondrial function and autophagy in neuronal cells 6.1 TNF-α induces mitochondrial oxidative stress in SH-SY5Y cells. The dysregulation of mitochondria and oxidative
Central injection of fibroblast growth factor 1 induces sustained remission of diabetic hyperglycemia in rodents
 Central injection of fibroblast growth factor 1 induces sustained remission of diabetic hyperglycemia in rodents Jarrad M Scarlett 1,,1, Jennifer M Rojas 1,1, Miles E Matsen 1, Karl J Kaiyala 3, Darko
Supplementary Table 1.
 Supplementary Table 1. Expression of genes involved in brown fat differentiation in WAT of db/db mice treated with HDAC inhibitors. Data are expressed as fold change (FC) versus control. symbol FC SAHA
Supplementary Fig. 1 eif6 +/- mice show a reduction in white adipose tissue, blood lipids and normal glycogen synthesis. The cohort of the original
 Supplementary Fig. 1 eif6 +/- mice show a reduction in white adipose tissue, blood lipids and normal glycogen synthesis. The cohort of the original phenotypic screening was n=40. For specific tests, the
Supplementary Figure 1
 Supplementary Figure 1. (A) Representative confocal analysis of cardiac mesenchymal cells from nondiabetic (ND-CMSC) and diabetic (D-CMSC) immunostained with anti-h3k9ac and anti-h3k27me3 antibodies. Analysis
Ophthalmology, Radiation Oncology,
 Supporting Online Material Journal: Nature Neuroscience Article Title: Corresponding Author: All Authors: Affiliations: Tanycytes of the Hypothalamic Median Eminence Form a Diet- Responsive Neurogenic
Additional methods appearing in the supplement are described in the Experimental Procedures section of the manuscript.
 Supplemental Materials: I. Supplemental Methods II. Supplemental Figure Legends III. Supplemental Figures Supplemental Methods Cell Culture and Transfections for Wild Type and JNK1-/-,JNK2-/- MEFs: The
Prediction of invasiveness of hepatic tumor cells
 Prediction of invasiveness of hepatic tumor cells (Overexpression of Romo1 Promotes Production of Reactive Oxygen Species and Invasiveness of Hepatic Tumor Cells) (Romo1 : Reactive Oxygen Species Modulator
Supplementary Figure 1. Double-staining immunofluorescence analysis of invasive colon and breast cancers. Specimens from invasive ductal breast
 Supplementary Figure 1. Double-staining immunofluorescence analysis of invasive colon and breast cancers. Specimens from invasive ductal breast carcinoma (a) and colon adenocarcinoma (b) were staining
Supplementary Figure 1. Characterization of basophils after reconstitution of SCID mice
 Supplementary figure legends Supplementary Figure 1. Characterization of after reconstitution of SCID mice with CD4 + CD62L + T cells. (A-C) SCID mice (n = 6 / group) were reconstituted with 2 x 1 6 CD4
Yun-Jung Choi, Jiangao Song, Jeff D. Johnson, Charles McWherter. NASH-TAG Conference Park City, Utah January 4, 2019
 Combination Therapy of Seladelpar and Liraglutide Attenuates Obesity, Hepatic Steatosis and Fibrosis in a Diet-induced and Biopsy-confirmed Mouse Model of NASH Yun-Jung Choi, Jiangao Song, Jeff D. Johnson,
GFP/Iba1/GFAP. Brain. Liver. Kidney. Lung. Hoechst/Iba1/TLR9!
 Supplementary information a +KA Relative expression d! Tlr9 5!! 5! NSC Neuron Astrocyte Microglia! 5! Tlr7!!!! NSC Neuron Astrocyte! GFP/Sβ/! Iba/Hoechst Microglia e Hoechst/Iba/TLR9! GFP/Iba/GFAP f Brain
Supplementary Figure 1 Expression of Crb3 in mouse sciatic nerve: biochemical analysis (a) Schematic of Crb3 isoforms, ERLI and CLPI, indicating the
 Schematic of Crb3 isoforms, ERLI and CLPI, indicating the") Supplementary Figure 1 Expression of Crb3 in mouse sciatic nerve: biochemical analysis (a) Schematic of Crb3 isoforms, ERLI and CLPI, indicating the location of the transmembrane (TM), FRM binding (FB)
Supplementary Figure 1 Expression of Crb3 in mouse sciatic nerve: biochemical analysis (a) Schematic of Crb3 isoforms, ERLI and CLPI, indicating the location of the transmembrane (TM), FRM binding (FB)
Defective Hepatic Autophagy in Obesity Promotes ER Stress and Causes Insulin Resistance
 Cell Metabolism, Volume 11 Supplemental Information Defective Hepatic Autophagy in Obesity Promotes ER Stress and Causes Insulin Resistance Ling Yang, Ping Li, Suneng Fu, Ediz S. Calay, and Gökhan S. Hotamisligil