1,8 1,6 1,4 1,2 1. EE/g lean mass 0,8 0,6 0,4 0,2. Ambulatory locomotor activity. (beam brakes/48h) V MCH MCHpf 0,86 0,85 0,84 0,83 0,82 0,81 0,8
|
|
|
- Jemimah Montgomery
- 5 years ago
- Views:
Transcription
1 Supplementary figure 1 vehicle A -pf Energy expenditure (kcal/kg/48h) V pf EE/g lean mass 1,8 1,6 1,4 1,2 1,8,6,4,2 Total locomotor activity (beam brakes/48h) C D E V pf Ambulatory locomotor activity (beam brakes/48h) V pf Fine locomotor activity (beam brakes/48h) V pf F RQ (vco 2 /vo 2 light phase),82,81,8,79,78,77,76,75,74,73,72 G RQ (vco 2 /vo 2 dark phase),86,85,84,83,82,81,8,79,78,77,76
2 Supplementary figure 2 vehicle A -pf V pf 12 3,5 UCP-1 AT protein levels (arbitrary units) AT mrna levels (arbitrary units) 3 2,5 2 1,5 1,5 UCP-1 PGC1α PPARα
3 Supplementary figure 3 vehicle WAT mrna levels (arbitrary units) 3,5 3 2,5 2 1,5 1,5 SCD-1 LPL CPT-1 PLIN LIPIN SREP1 1,6 1,4 1,2 1,8,6,4,2 -pf
4 Supplementary figure 4 vehicle Serum FFA (mg/dl) pf
5 Supplementary figure 5 vehicle A Fecal output (g) Faecal TG content (µg/g feces) ad lib -pf
6 Supplementary figure 6 vehicle A Cumulative food intake (g) ody weight gain (g) C WAT mrna levels (arbitrary units) 1,4 1,2 1,8,6,4,2 LPL D V pjnk1 E WAT protein levels (arbitrary units) pjnk1 F V pampk pacc G Liver protein levels (arbitrary units) pampk pacc
7 Supplementary figure 7 vehicle A ad lib -pf Cumulative food intake (g) ody weight gain (g) C 14 V pf WAT protein levels (arbitrary units) D V pf pampk Liver protein levels (arbitrary units) pampk
8 A 2 Supplementary figure 8 aseline 4 th hr (ug) V 5 1 WAT SNA (volts) sec WAT SNA (%) C WAT SNA (%) Time (min) Afferent Efferent
 1 9 8 7 6 5 4 3 2")
 3 25 2 15 1 5 VGX/Vehicle VGX/ phsl")
9 Supplementary figure 9 A Sham VGX Cumulative food intake (g) SHAM VGX C ody weight gain (g) SHAM VGX Sham/Vehicle Sham/ VGX/Vehicle VGX/ D V VGX phsl pjnk WAT protein levels (arbitrary units) VGX/Vehicle VGX/ phsl pjnk
10 Supplementary figure 1 A V JNK1 -/- WAT protein levels (arbitrary units) JNK KO veh JNK KO 2 C D 15 2,5 Cumulative food intake (g) ody weight gain 6 days (% to vehicle) 2 1,5 1,5 -,5-1 -1,5 WAT protein levels (arbitrary units) V vehicle + SP6125 +SP


11 Supplementary figure 11 A Daily ody weight gain (g) (days) GFP -R Daily food intake (g) (days) C Daily ody weight gain (g) (days) D Daily food intake (g) (days)


 4 35 3 25 18 16 14 12 1 8 6")

 16 14 12 1 8 6 4 2 Ad -R Ad")
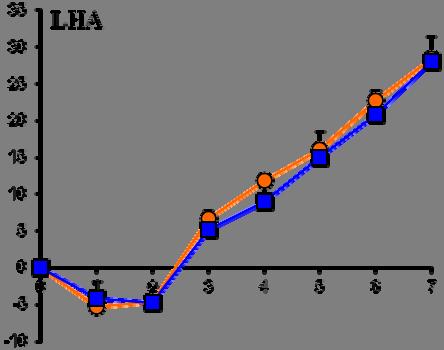
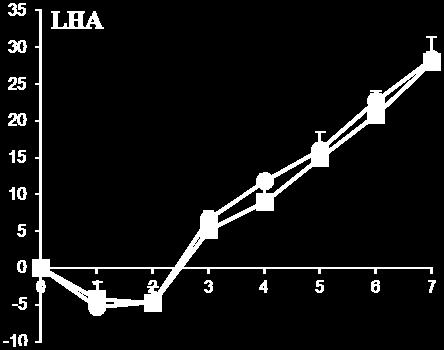
12 Supplementary figure 12 A ARC LHA % Success 62,5% 87,5% GFP Immuno/GFP- Virus GFP Immuno/GFP- Virus GFP Inmuno/GFP-Virus GFP Inmuno/GFP-Virus ARC ARC LHA LHA SAL ARC Ad -R GFP -R phsl pjnk JNK1 WAT protein levels (arbitrary units) SAL GFP -R 4 2 Ad -R Ad -R Ad -R Ad -R ACC pjnk/jnk phsl Ad -R C LHA 18 SAL GFP SAL Ad -R GFP -R ACC phsl WAT protein levels (arbitrary units) Ad -R Ad -R Ad -R Ad -R -R ACC phsl

 16 14")
 Ad GFP")

 5 (days) C")
 (g) intake")
13 Supplementary figure 13 A Cumulative food intake (g) Cumulative food intake (g) Ad GFP Ad -R 4 (days) 35 ody weight gain (g) ody weight gain (g) 5 (days) C Cumulative food intake (g) (days) ody weight gain (g) ody weight gain (g) Cumulative food intake (g) D (days)


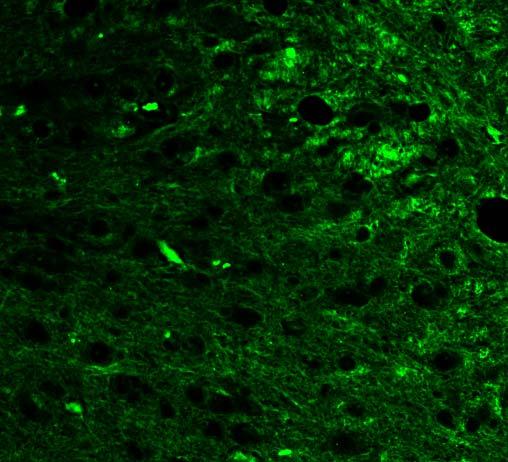

14 A Supplementary figure 14 ARC -R perk -R/pERK 1 μm 1 μm 1 μm LHA -R perk -R/pERK 5 μm 5 μm 5 μm C C-FOS (Ad GFP) C-FOS (Ad -R) ARC C-FOS(Ad GFP) 1 μm ARC 1 μm C-FOS(Ad -R) LHA 1 mm LHA 1 mm
 12 1 8 6 4 2 Ad GFP Ad -R D Ad GFP Ad -R pampk pacc")
 12 1 8 6 4 2 ACC")
15 Supplementary figure 15 A C VMH Ad GFP VMH ody weight gain (g) Cumulative food intake (g) Ad GFP Ad -R D Ad GFP Ad -R pampk pacc ACC LPL Liver protein levels (arbitrary units) pampk pacc ACC LPL E 14 GFP -R ACC phsl WAT protein levels (arbitrary units) ACC phsl


16 Supplementary figure 16 -ARC-WAT -LH-LIVER LHA PVH PVH LHA LHA PVH PVH LHA DMH DMH DMH DMH VMH VMH VMH VMH SNS PSNS TG synthesis Lipid oxidation TG synthesis TG uptake Lipid oxidation pjnk1 pampk pacc pjnk1 LPL LIPID STORAGE LIPOLYSIS LIPID STORAGE LIPID UPTAKE Adipocyte Hepatocyte ALTERATION IN NUTRIENT PARTITIONING FAT STORAGE Changes dependent of food intake ODY WEIGHT
17 Supplementary Figure 1. Effect of a 7-day ICV (1 µg/day) infusion on (A) energy expenditure, () energy expenditure corrected by grams of lean mass, (C) total locomotor activity, (D) ambulatory locomotor activity, and (E) fine locomotor activity and RQ during (F) light and (G) dark phases. Energy expenditure, locomotor activity, and RQ were measured over the last 2 days of the experiment during the light (white bars) and dark (grey bars) phase. Values are mean ± standard error of the mean of 7 8 animals per group. Supplementary Figure 2. Effect of a 7-day ICV (1 µg/day) infusion on (A) brown adipose tissue (AT) protein levels of uncoupling protein-1 (UCP-1) and () AT messenger RNA (mrna) expression of peroxisome proliferator-activated receptor γ co-activator-1-α (PGC1α) and peroxisome proliferator-activated α receptor (PPARα). Data are presented as values normalized to 18S, which was used as a housekeeping gene. was used to normalize protein levels. Values are mean ± standard error of the mean of 7 8 animals per group. Supplementary Figure 3. Effect of a 7-day ICV (1 µg/day) infusion on epididymal WAT messenger RNA (mrna) expression of,, SCD-1, LPL, CPT-1, PLIN, lipin, and SREP1. Data are presented as values normalized to 18S, which was used as a housekeeping gene. Values are mean ± standard error of the mean of 7 8 animals per group. P <.5, P <.1, and P <.1 vs controls. Supplementary Figure 4. Effect of a 7-day ICV (1 µg/day) infusion on serum FFA. Values are mean ± standard error of the mean of 7 8 animals per group. P <.1 vs controls.
18 Supplementary Figure 5. Effect of a 7-day ICV (1 µg/day) infusion on (A) fecal output and () fecal TG content. Values are mean ± standard error of the mean of 7 8 animals per group. P <.1 and P <.1 vs controls. Supplementary Figure 6. Effect of a 7-day subcutaneous (1 µg/day) infusion on (A) cumulative food intake and () body weight gain. (C) Effect of a 7-day subcutaneous (1 µg/day) infusion on epididymal WAT messenger RNA (mrna) expression of,, and LPL. (D and E) Effect of a 7-day subcutaneous (1 µg/day) infusion on WAT protein levels of,,, and pjnk1. (F and G) Effect of a 7-day subcutaneous (1 µg/day) infusion on liver protein levels of pampk, pacc, and. Data are presented as values normalized to 18S, which was used as a housekeeping gene relative to controls and β- actin, which was used to normalize protein levels. Values are mean ± standard error of the mean of 7 8 animals per group. Supplementary Figure 7. Effect of a 7-day intravenous (1 µg/day) infusion on (A) cumulative food intake and () body weight gain. (C) Effect of a 7-day intravenous (1 µg/day) infusion on epididymal WAT protein levels of and. (D) Effect of a 7-day intravenous (1 µg/day) infusion on liver protein levels of pampk and. Data are presented as values normalized to. Values are mean ± standard error of the mean of 7 8 animals per group. P <.5 and P <.1 vs controls.
19 Supplementary Figure 8. (A and ) Effect of ICV administration of on SNA subserving epididymal WAT in anesthetized rats. (C) Effect of ICV administration on the afferent and efferent nerve activity. Supplementary Figure 9. (A) Representative picture of the stomach from sham and VGX rats. Effect of a 7-day ICV (1 µg/day) infusion on () cumulative food intake and (C) body weight gain in sham-operated rats and VGX rats. (D) Effect of a 7-day ICV (1 µg/day) infusion on epididymal WAT protein levels of, phsl,,, and pjnk in VGX rats. Values are mean ± standard error of the mean of 6 8 animals per group. P <.5 vs controls. Supplementary Figure 1. (A) Effect of a 7-day ICV (2.5 µg/day) infusion on WAT protein levels of in JNK1 KO mice. Effect of a 6-day ICV (2.5 µg/day) infusion + IP SP6125 (JNK inhibitor) treatment on () cumulative food intake, (C) body weight gain, and (D) WAT protein levels of. was used to normalize protein levels. Values are mean ± standard error of the mean of 6 8 animals per group. P <.5 and P <.1 vs controls. Supplementary Figure 11. (A) Daily body weight change and () cumulative food intake in rats treated stereotaxically with a GFP- (red) or -R expressing adenovirus (blue) in the ARC. (C) Daily body weight change and (D) cumulative food intake in rats treated stereotaxically with a GFP- (red) or -R expressing adenovirus (blue) in the LHA.
20 Supplementary Figure 12. (A) Rate of success reaching the ARC and LHA after the injection of the adenoviral vectors, and representative photographs of a correct injection vs an incorrect injection site. () Protein level profiles in WAT after a 7-day infusion of saline (white) or (6 µg/day) (black) specifically into the ARC and rats treated stereotaxically with a GFP- (red) or -R expressing adenovirus (blue) in the ARC. (C) Protein level profiles in WAT after a 7- day infusion of saline (white) or (6 µg/day) (black) specifically into the LHA and rats treated stereotaxically with a GFP- (red) or a -R expressing adenovirus (blue) in the LHA. Supplementary Figure 13. (A) Cumulative food intake and () body weight gain of rats treated stereotaxically with a GFP- (red) or a -R expressing adenovirus (blue) that failed to reach the ARC. (C) Cumulative food intake and (D) body weight gain of rats treated stereotaxically with a GFP- (red) or a -R expressing adenovirus (blue) that failed to reach the LHA. Supplementary Figure 14. (A) Double immunohistochemistry showing -R and perk coexpression in the ARC. () Double immunohistochemistry showing -R and perk coexpression in the LHA. (C) Immunofluorescence of c-fos in rats treated stereotaxically with a GFP- (left) or -R expressing adenovirus (right) in the ARC and the LHA. Supplementary Figure 15. (A) Localization studies showing the coordinates used for a unilateral stereotaxic microinjection of adenoviral expression vectors and GFP immunofluorescence in the VMH. () ody weight change, (C) cumulative food intake, and protein level profiles in (D) liver and (E) WAT of rats treated stereotaxically with a GFP- (red) or -R expressing adenovirus (blue) in the VMH. was used to normalize protein
21 levels. It is important to note that this figure oversimplifies the protocol because injections were given bilaterally. Values are mean ± standard error of the mean of 7 8 animals per group. P <.5, P <.1, and P <.1 vs controls. Supplementary Figure 16. Schematic overview summarizing the physiological effects of CNS on peripheral tissues. Activation of -R in the ARC increases TG synthesis and decreases lipid oxidation in fat tissue. Activation of -R in the LHA increases TG synthesis and uptake in liver. Combined, these parallel metabolic changes in multiple tissues represent a synergistic shift in substrate choice and nutrient partitioning, resulting in increased energy storage independent of feeding behavior and energy expenditure.
Supplementary Table 2. Plasma lipid profiles in wild type and mutant female mice submitted to a HFD for 12 weeks wt ERα -/- AF-1 0 AF-2 0
 Supplementary Table 1. List of specific primers used for gene expression analysis. Genes Primer forward Primer reverse Hprt GCAGTACAGCCCCAAAATGG AACAAAGTCTGGCCTGTATCCA Srebp-1c GGAAGCTGTCGGGGTAGCGTC CATGTCTTCAAATGTGCAATCCAT
SUPPLEMENTARY DATA. Nature Medicine: doi: /nm.4171
 SUPPLEMENTARY DATA Supplementary Figure 1 a b c PF %Change - -4-6 Body weight Lean mass Body fat Tissue weight (g).4.3.2.1. PF GC iwat awat BAT PF d e f g week 2 week 3 NEFA (mmol/l) 1..5. PF phsl (Ser565)
control kda ATGL ATGLi HSL 82 GAPDH * ** *** WT/cTg WT/cTg ATGLi AKO/cTg AKO/cTg ATGLi WT/cTg WT/cTg ATGLi AKO/cTg AKO/cTg ATGLi iwat gwat ibat
 body weight (g) tissue weights (mg) ATGL protein expression (relative to GAPDH) HSL protein expression (relative to GAPDH) ### # # kda ATGL 55 HSL 82 GAPDH 37 2.5 2. 1.5 1..5 2. 1.5 1..5.. Supplementary
Supplementary Table 1. Primer Sequences Used for Quantitative Real-Time PCR
 Supplementary Table 1. Primer Sequences Used for Quantitative Real-Time PCR Gene Forward Primer (5-3 ) Reverse Primer (5-3 ) cadl CTTGGGGGCGCGTCT CTGTTCTTTTGTGCCGTTTCG cyl-coenzyme Dehydrogenase, very
Supplemental Information Supplementary Table 1. Tph1+/+ Tph1 / Analyte Supplementary Table 2. Tissue Vehicle LP value
 Supplemental Information Supplementary Table. Urinary and adipose tissue catecholamines in Tph +/+ and Tph / mice fed a high fat diet for weeks. Tph +/+ Tph / Analyte ewat ibat ewat ibat Urine (ng/ml)
The central melanocortin system directly controls peripheral lipid metabolism
 Research article The central melanocortin system directly controls peripheral lipid metabolism Ruben Nogueiras, 1,2 Petra Wiedmer, 2 Diego Perez-Tilve, 1 Christelle Veyrat-Durebex, 3 Julia M. Keogh, 4
Supplementary Information. Glycogen shortage during fasting triggers liver-brain-adipose. neurocircuitry to facilitate fat utilization
 Supplementary Information Glycogen shortage during fasting triggers liver-brain-adipose neurocircuitry to facilitate fat utilization Supplementary Figure S1. Liver-Brain-Adipose neurocircuitry Starvation
SUPPLEMENTARY INFORMATION
 DOI: 10.1038/ncb2211 a! mir-143! b! mir-103/107! let-7a! mir-144! mir-122a! mir-126-3p! mir-194! mir-27a! mir-30c! Figure S1 Northern blot analysis of mir-143 expression dependent on feeding conditions.
A synergistic anti-obesity effect by a combination of capsinoids and cold temperature through the promotion of beige adipocyte biogenesis
 A synergistic anti-obesity effect by a combination of capsinoids and cold temperature through the promotion of beige adipocyte biogenesis Kana Ohyama, 1,2 Yoshihito Nogusa, 1 Kosaku Shinoda, 2 Katsuya
SUPPLEMENTARY INFORMATION
 doi: 1.138/nature7221 Brown fat selective genes 12 1 Control Q-RT-PCR (% of Control) 8 6 4 2 Ntrk3 Cox7a1 Cox8b Cox5b ATPase b2 ATPase f1a1 Sirt3 ERRα Elovl3/Cig3 PPARα Zic1 Supplementary Figure S1. stimulates
Supplementary Information. Protectin DX alleviates insulin resistance by activating a myokine-liver glucoregulatory axis.
 Supplementary Information Protectin DX alleviates insulin resistance by activating a myokine-liver glucoregulatory axis. Phillip J. White, Philippe St-Pierre, Alexandre Charbonneau, Patricia Mitchell,
Sex Differences in Central Expression and Effects of Brain-Derived Neurotrophic Factor
 Sex Differences in Central Expression and Effects of Brain-Derived Neurotrophic Factor Haifei Shi Department of Biology, Miami University International Conference on Endocrinology October 22, 14 Arcuate
Supplementary Figure 1.
 Supplementary Figure 1. FGF21 does not exert direct effects on hepatic glucose production. The liver explants from C57BL/6J mice (A, B) or primary rat hepatocytes (C, D) were incubated with rmfgf21 (2
HIV VPR alters fat metabolism. Dorothy E Lewis PhD/Ashok Balasubramanyam MD
 HIV VPR alters fat metabolism Dorothy E Lewis PhD/Ashok Balasubramanyam MD Old Dogma for HIV associated lipodystrophy Differentiation Block (PI) Lipoatrophy Apoptosis (NRTI) Stem cell Preadipocyte Adipocyte
Fig. S1. Dose-response effects of acute administration of the β3 adrenoceptor agonists CL316243, BRL37344, ICI215,001, ZD7114, ZD2079 and CGP12177 at
 Fig. S1. Dose-response effects of acute administration of the β3 adrenoceptor agonists CL316243, BRL37344, ICI215,001, ZD7114, ZD2079 and CGP12177 at doses of 0.1, 0.5 and 1 mg/kg on cumulative food intake
Over-expression of MKP-3 and knockdown of MKP-3 and FOXO1 in primary rat. day, cells were transduced with adenoviruses expressing GFP, MKP-3 or shgfp,
 SUPPLEMENTAL METHODS Over-expression of MKP-3 and knockdown of MKP-3 and FOXO1 in primary rat hepatocytes Primary rat hepatocytes were seeded as described in experimental procedures. The next day, cells
Table 1. Oligonucleotides and RT-PCR conditions Supplementary Material and Methods Fig. 1
 Table 1. Oligonucleotides and RT-PCR conditions. Overview of PCR templates, gene accession number of sequences used as template, product size, annealing temperatures and optimal cycles, cdna and MgCl 2
SUPPLEMENTARY INFORMATION
 doi:10.1038/nature12652 Supplementary Figure 1. PRDM16 interacts with endogenous EHMT1 in brown adipocytes. Immunoprecipitation of PRDM16 complex by flag antibody (M2) followed by Western blot analysis
Central injection of fibroblast growth factor 1 induces sustained remission of diabetic hyperglycemia in rodents
 Central injection of fibroblast growth factor 1 induces sustained remission of diabetic hyperglycemia in rodents Jarrad M Scarlett 1,,1, Jennifer M Rojas 1,1, Miles E Matsen 1, Karl J Kaiyala 3, Darko
GPR120 *** * * Liver BAT iwat ewat mwat Ileum Colon. UCP1 mrna ***
 a GPR120 GPR120 mrna/ppia mrna Arbitrary Units 150 100 50 Liver BAT iwat ewat mwat Ileum Colon b UCP1 mrna Fold induction 20 15 10 5 - camp camp SB202190 - - - H89 - - - - - GW7647 Supplementary Figure
Role of the ventromedial hypothalamic Steroidogenic Factor 1/ Adrenal 4. glucose metabolism in mice.
 Role of the ventromedial hypothalamic Steroidogenic Factor 1/ Adrenal 4 Binding Protein neurons in the regulation of whole body energy and glucose metabolism in mice. Eulalia Coutinho Department of Physiological
3-Thia Fatty Acids A New Generation of Functional Lipids?
 Conference on Food Structure and Food Quality 3-Thia Fatty Acids A New Generation of Functional Lipids? Rolf K. Berge rolf.berge@med.uib.no Fatty acids- Essential cellular metabolites Concentrations must
1.5 ASK1KO fed. fasted 16 hrs w/o water. Fed. 4th. 4th WT ASK1KO N=29, 11(WT), ,5(ASK1KO) ASK1KO ASK1KO **** Time [h]
![1.5 ASK1KO fed. fasted 16 hrs w/o water. Fed. 4th. 4th WT ASK1KO N=29, 11(WT), ,5(ASK1KO) ASK1KO ASK1KO **** Time [h]](/thumbs/87/97258189.jpg "1.5 ASK1KO fed. fasted 16 hrs w/o water. Fed. 4th. 4th WT ASK1KO N=29, 11(WT), ,5(ASK1KO) ASK1KO ASK1KO **** Time [h]") 7: 13: 19: 1: 7: 151117 a 151117 4th 4th b c RQ.95 KO.9.85.8.75.7 light dark light dark.65 7: 19: 7: 19: 7: Means ± SEM, N=6 RQ 1..9.8.7.6.6 KO CL (-) CL (+) ibat weight ratio (/body weight) [%].5.4.3.2.1
7: 13: 19: 1: 7: 151117 a 151117 4th 4th b c RQ.95 KO.9.85.8.75.7 light dark light dark.65 7: 19: 7: 19: 7: Means ± SEM, N=6 RQ 1..9.8.7.6.6 KO CL (-) CL (+) ibat weight ratio (/body weight) [%].5.4.3.2.1
Supplemental Information. Intermittent Fasting Promotes. White Adipose Browning and Decreases Obesity. by Shaping the Gut Microbiota
 Cell Metabolism, Volume 26 Supplemental Information Intermittent Fasting Promotes White Adipose Browning and Decreases Obesity by Shaping the Gut Microbiota Guolin Li, Cen Xie, Siyu Lu, Robert G. Nichols,
a Supplementary Figure 1 Celastrol Withaferin A Individual drugs
 Supplementary Figure 1 a 17 27 HSPA1A SLC7A11 HMOX1 GSTA1 DUSP4 GML CHAC1 CDKN1A GSTA4 CA6 BHLHE41 NR1D1 HSPB1 PTX3 HP NFKBIA VDR MVD HAS2 ANGPT1 WDR6 TGFB3 IDI1 VCAM1 H1F HMGCS1 CXCL5 STEAP4 NOS2 b Enrichment
Males- Western Diet WT KO Age (wks) Females- Western Diet WT KO Age (wks)
 Females- Western Diet WT KO Age (wks)") Relative Arv1 mrna Adrenal 33.48 +/- 6.2 Skeletal Muscle 22.4 +/- 4.93 Liver 6.41 +/- 1.48 Heart 5.1 +/- 2.3 Brain 4.98 +/- 2.11 Ovary 4.68 +/- 2.21 Kidney 3.98 +/-.39 Lung 2.15 +/-.6 Inguinal Subcutaneous
Relative Arv1 mrna Adrenal 33.48 +/- 6.2 Skeletal Muscle 22.4 +/- 4.93 Liver 6.41 +/- 1.48 Heart 5.1 +/- 2.3 Brain 4.98 +/- 2.11 Ovary 4.68 +/- 2.21 Kidney 3.98 +/-.39 Lung 2.15 +/-.6 Inguinal Subcutaneous
FSP27 contributes to efficient energy storage in murine white adipocytes by promoting the formation of unilocular lipid droplets
 Research article Related Commentary, page 2693 FSP27 contributes to efficient energy storage in murine white adipocytes by promoting the formation of unilocular lipid droplets Naonobu Nishino, 1 Yoshikazu
Supplementary Materials for
 www.sciencesignaling.org/cgi/content/full/8/407/ra127/dc1 Supplementary Materials for Loss of FTO in adipose tissue decreases Angptl4 translation and alters triglyceride metabolism Chao-Yung Wang,* Shian-Sen
Jaemin Lee, Ph.D. Department of New Biology Daegu Gyeongbuk Institute of Science and Technology (DGIST)
") Jaemin Lee, Ph.D. Department of New Biology Daegu Gyeongbuk Institute of Science and Technology (DGIST) No Actual or Potential Conflict of Interest https://www.flickr.com/photos/luchoedu/2453267732/ 1985
Jaemin Lee, Ph.D. Department of New Biology Daegu Gyeongbuk Institute of Science and Technology (DGIST) No Actual or Potential Conflict of Interest https://www.flickr.com/photos/luchoedu/2453267732/ 1985
Male 30. Female. Body weight (g) Age (weeks) Age (weeks) Atg7 f/f Atg7 ΔCD11c
 Age (weeks) Age (weeks) Atg7 f/f Atg7 ΔCD11c") ody weight (g) ody weight (g) 34 3 Male 3 27 Female 26 24 22 18 7 9 11 13 15 17 19 21 23 21 18 15 7 9 11 13 15 17 19 21 23 Age (weeks) Age (weeks) Supplementary Figure 1. Lean phenotypes in mice regardless
ody weight (g) ody weight (g) 34 3 Male 3 27 Female 26 24 22 18 7 9 11 13 15 17 19 21 23 21 18 15 7 9 11 13 15 17 19 21 23 Age (weeks) Age (weeks) Supplementary Figure 1. Lean phenotypes in mice regardless
Leptin Intro/Signaling. ATeamP: Angelo, Anthony, Charlie, Gabby, Joseph
 Leptin Intro/Signaling ATeamP: Angelo, Anthony, Charlie, Gabby, Joseph Overview Intro to Leptin Definition & Sources Physiology Bound vs. Free Receptors Signaling JAK/STAT MAPK PI3K ACC Experimental findings
SUPPLEMENTARY INFORMATION
 DOI: 10.1038/ncb3461 In the format provided by the authors and unedited. Supplementary Figure 1 (associated to Figure 1). Cpeb4 gene-targeted mice develop liver steatosis. a, Immunoblot displaying CPEB4
Effect of BI-1 on insulin resistance through regulation of CYP2E1
 Effect of BI-1 on insulin resistance through regulation of CYP2E1 Geum-Hwa Lee 1, Kyoung-Jin Oh 2, 3, Hyung-Ryong Kim 4, Hye-Sook Han 2, Hwa-Young Lee 1, Keun-Gyu Park 5, Ki-Hoan Nam 6, Seung-Hoi Koo 2
AAV-TBGp-Cre treatment resulted in hepatocyte-specific GH receptor gene recombination
 AAV-TBGp-Cre treatment resulted in hepatocyte-specific GH receptor gene recombination Supplementary Figure 1. Generation of the adult-onset, liver-specific GH receptor knock-down (alivghrkd, Kd) mouse
Supplementary Figure 1
 VO (ml kg - min - ) VCO (ml kg - min - ) Respiratory exchange ratio Energy expenditure (cal kg - min - ) Locomotor activity (x count) Body temperature ( C) Relative mrna expression TA Sol EDL PT Heart
Hypothalamic Autophagy and Regulation of Energy Balance
 Hypothalamic Autophagy and Regulation of Energy Balance Rajat Singh, MD Albert Einstein College of Medicine New York NuGOweek 211 Sept 6-9, 211 Autophagy Evolutionarily conserved cellular recycling program
Supplementary Figure 1. DNA methylation of the adiponectin promoter R1, Pparg2, and Tnfa promoter in adipocytes is not affected by obesity.
 Supplementary Figure 1. DNA methylation of the adiponectin promoter R1, Pparg2, and Tnfa promoter in adipocytes is not affected by obesity. (a) Relative amounts of adiponectin, Ppar 2, C/ebp, and Tnf mrna
Supplementary Figure 1
 Supplementary Figure 1 how HFD how HFD Epi WT p p Hypothalamus p p Inguinal WT T Liver Lean mouse adipocytes p p p p p p Obese mouse adipocytes Kidney Muscle Spleen Heart p p p p p p p p Extracellular
Supporting Information Table of content
 Supporting Information Table of content Supporting Information Fig. S1 Supporting Information Fig. S2 Supporting Information Fig. S3 Supporting Information Fig. S4 Supporting Information Fig. S5 Supporting
Supplementary Fig. 1 eif6 +/- mice show a reduction in white adipose tissue, blood lipids and normal glycogen synthesis. The cohort of the original
 Supplementary Fig. 1 eif6 +/- mice show a reduction in white adipose tissue, blood lipids and normal glycogen synthesis. The cohort of the original phenotypic screening was n=40. For specific tests, the
ZL ZDF ZDF + E2 *** Visceral (g) ZDF
 ZDF") Body Weight (g) 4 3 2 1 ** * ZL ZDF 6 8 1 12 14 16 Age (weeks) B * Sub-cutaneous (g) 16 12 8 4 ZL ZDF Visceral (g) 25 2 15 1 5 ZL ZDF Total fat pad weight (g) 4 3 2 1 ZDF ZL Supplemental Figure 1: Effect
Body Weight (g) 4 3 2 1 ** * ZL ZDF 6 8 1 12 14 16 Age (weeks) B * Sub-cutaneous (g) 16 12 8 4 ZL ZDF Visceral (g) 25 2 15 1 5 ZL ZDF Total fat pad weight (g) 4 3 2 1 ZDF ZL Supplemental Figure 1: Effect
BEIGE AND BROWN FAT: BASIC BIOLOGY AND NOVEL THERAPEUTICS Dr. Carl Ascoli
 BEIGE AND BROWN FAT: BASIC BIOLOGY AND NOVEL THERAPEUTICS Dr. Carl Ascoli Symposium Co-Chairs: Bruce M. Spiegelman (Harvard/Dana Farber) and Sven Enerbäck (U.Gothenburg) April 17-23, 2015 Snowbird Resort,
Glucose. Glucose. Insulin Action. Introduction to Hormonal Regulation of Fuel Metabolism
 Glucose Introduction to Hormonal Regulation of Fuel Metabolism Fasting level 3.5-5 mmol (1 mmol = 18 mg/dl) Postprandial 6-10 mmol Amount of glucose in circulation is dependent on: Absorption from the
A microrna-34a/fgf21 Regulatory Axis and Browning of White Fat
 A microrna-34a/fgf21 Regulatory Axis and Browning of White Fat Jongsook Kim Kemper, Ph.D Department of Molecular and Integrative Physiology, University of Illinois at Urbana-Champaign, USA 213 International
Supplementary Figure 1 Validation of Per2 deletion in neuronal cells in N Per2 -/- mice. (a) Western blot from liver extracts of mice held under ad
 Western blot from liver extracts of mice held under ad") Supplementary Figure 1 Validation of Per2 deletion in neuronal cells in N Per2 -/- mice. (a) Western blot from liver extracts of mice held under ad libitum conditions detecting PER2 protein in brain and
Supplementary Figure 1 Validation of Per2 deletion in neuronal cells in N Per2 -/- mice. (a) Western blot from liver extracts of mice held under ad libitum conditions detecting PER2 protein in brain and
Obesity in aging: Hormonal contribution
 Obesity in aging: Hormonal contribution Hormonal issues in obesity and aging Hormonal role in regulation of energy balance Genetic component in hormonal regulation Life style contribution to hormonal changes
For pair feeding, mice were fed 2.7g of HFD containing tofogliflozin
 Materials and Methods Pair Feeding Experiment For pair feeding, mice were fed 2.7g of HFD containing tofogliflozin (0.005%), which is average daily food intake of mice fed control HFD ad libitum at week
ALT (U/L) (Relative expression) HDL (mm) (Relative expression) ALT (U/L) (Relative expression)
 (Relative expression) HDL (mm) (Relative expression) ALT (U/L) (Relative expression)") a DMT mrna () 8 6 r =.96 P =. DMT mrna () 8 6 r =. P =.6 DMT mrna () 8 6 r =.99 P =.6 DMT mrna () 8 6 r =. P =.9 DMT mrna () BMI (kg/m ) 8 6 r =.7 P =.966 DMT mrna () 8 ALT (U/L) 8 6 r = -.66 P =.76 DMT
a DMT mrna () 8 6 r =.96 P =. DMT mrna () 8 6 r =. P =.6 DMT mrna () 8 6 r =.99 P =.6 DMT mrna () 8 6 r =. P =.9 DMT mrna () BMI (kg/m ) 8 6 r =.7 P =.966 DMT mrna () 8 ALT (U/L) 8 6 r = -.66 P =.76 DMT
University of Groningen. Non-alcoholic fatty liver disease Sheedfar, Fareeba
 University of Groningen Non-alcoholic fatty liver disease Sheedfar, Fareeba IMPORTANT NOTE: You are advised to consult the publisher's version (publisher's PDF) if you wish to cite from it. Please check
Supplemental Table 1 Primer sequences (mouse) used for real-time qrt-pcr studies
 used for real-time qrt-pcr studies") Supplemental Table 1 Primer sequences (mouse) used for real-time qrt-pcr studies Gene symbol Forward primer Reverse primer ACC1 5'-TGAGGAGGACCGCATTTATC 5'-GCATGGAATGGCAGTAAGGT ACLY 5'-GACACCATCTGTGATCTTG
Supplemental Table 1 Primer sequences (mouse) used for real-time qrt-pcr studies Gene symbol Forward primer Reverse primer ACC1 5'-TGAGGAGGACCGCATTTATC 5'-GCATGGAATGGCAGTAAGGT ACLY 5'-GACACCATCTGTGATCTTG
Supplementary Figure S1
 Lipidomic-based investigation into the regulatory effect of Schisandrin B on palmitic acid level in non-alcoholic steatotic livers Hiu Yee Kwan 1,2, Xuyan Niu 3, Wenlin Dai 4, Tiejun Tong 4, Xiaojuan Chao
Supplementary Figure 1) GABAergic enhancement by leptin hyperpolarizes POMC neurons A) Representative recording samples showing the membrane
 GABAergic enhancement by leptin hyperpolarizes POMC neurons A) Representative recording samples showing the membrane") Supplementary Figure 1) GABAergic enhancement by leptin hyperpolarizes POMC neurons A) Representative recording samples showing the membrane potential recorded from POMC neurons following treatment with
Supplementary Figure 1) GABAergic enhancement by leptin hyperpolarizes POMC neurons A) Representative recording samples showing the membrane potential recorded from POMC neurons following treatment with
Effects of growth hormone secretagogue receptor agonist and antagonist in nonobese type 2 diabetic MKR mice
 Effects of growth hormone secretagogue receptor agonist and antagonist in nonobese type 2 diabetic MKR mice Rasha Mosa (MBCHC, M.D, PhD candidate) School of Biomedical Sciences University of Queensland
SUPPLEMENTARY DATA. Supplementary Table 1. Primers used in qpcr
 Supplementary Table 1. Primers used in qpcr Gene forward primer (5'-3') reverse primer (5'-3') β-actin AGAGGGAAATCGTGCGTGAC CAATAGTGATGACCTGGCCGT Hif-p4h-2 CTGGGCAACTACAGGATAAAC GCGTCCCAGTCTTTATTTAGATA
Control 7 d cold 7 d CL
 Control 7 d cold 7 d ibat iwat gwat Supplementary Figure 1. Histology of adipose tissues after cold or 3-adrenergic receptor stimulation. C57BL/6J wild-type mice were housed at 4 C or injected daily with
SUPPLEMENTARY INFORMATION
 -. -. SUPPLEMENTARY INFORMATION DOI: 1.1/ncb86 a WAT-1 WAT- BAT-1 BAT- sk-muscle-1 sk-muscle- mir-133b mir-133a mir-6 mir-378 mir-1 mir-85 mir-378 mir-6a mir-18 mir-133a mir- mir- mir-341 mir-196a mir-17
Regulation of adipose tissue remodeling by peripheral serotonin
 Regulation of adipose tissue remodeling by peripheral serotonin Sangkyu Park Catholic Kwandong University College of Medicine Department of Biochemistry Serotonin (5-HT) is a signaling molecule Hemostasis
Supplementary Information
 Supplementary Information GADD34-deficient mice develop obesity, nonalcoholic fatty liver disease, hepatic carcinoma and insulin resistance Naomi Nishio and Ken-ichi Isobe Department of Immunology, Nagoya
Supplementary Information
 Supplementary Information Akt regulates hepatic metabolism by suppressing a Foxo1 dependent global inhibition of adaptation to nutrient intake Mingjian Lu 1, Min Wan 1, Karla F. Leavens 1, Qingwei Chu
Regulation of Lipid Homeostasis: Lipid Droplets
 Regulation of Lipid Homeostasis: Lipid Droplets Bernd Helms Article Brand Recter Hendrik Mertens 1 The Basics I: FAs The Basics II: FA Activation 2 Basics III: TG-FA Interplay. Why? Adipocytes 3 Foam cells
Bi156 lecture 2, 1/6/12. Eating and weight regulation
 Bi156 lecture 2, 1/6/12 Eating and weight regulation Introduction: weight regulation in an affluent society In our society much effort and money is expended on regulation of weight. Failure to maintain
Supplemental Information. FGF19, FGF21, and an FGFR1/b-Klotho-Activating. Antibody Act on the Nervous System. to Regulate Body Weight and Glycemia
 Cell Metabolism, Volume 26 Supplemental Information FGF19, FGF21, and an FGFR1/b-Klotho-Activating Antibody Act on the Nervous System to Regulate Body Weight and Glycemia Tian Lan, Donald A. Morgan, Kamal
Analysis of AVP functions via V1a and V1b receptors with knockout mice. Akito Tanoue
 Analysis of AVP functions via V1a and V1b receptors with knockout mice Akito Tanoue Department of Pharmacology, National Research Institute for Child Health and Development Arginine-Vasopressin (AVP) is
Supplementary Figure 1
 Supplementary Figure 1 a Percent of body weight! (%) 4! 3! 1! Epididymal fat Subcutaneous fat Liver SD Percent of body weight! (%) ** 3! 1! SD Percent of body weight! (%) 6! 4! SD ** b Blood glucose (mg/dl)!
Gene Polymorphisms and Carbohydrate Diets. James M. Ntambi Ph.D
 Gene Polymorphisms and Carbohydrate Diets James M. Ntambi Ph.D Fatty Acids that Flux into Tissue Lipids are from Dietary Sources or are Made De novo from Glucose or Fructose Glucose Fructose Acetyl-CoA
Supplementary Information
 Supplementary Information Notch deficiency decreases hepatic lipid accumulation by induction of fatty acid oxidation No-Joon Song,#, Ui Jeong Yun,#, Sunghee Yang, Chunyan Wu, Cho-Rong Seo, A-Ryeong Gwon,,
Role of oxytocin in energy metabolism
 Role of oxytocin in energy metabolism Peptides 45 (2013) 9 14. Valéria Ernestânia Chaves Federal University of São João Del Rei Brazil Oxytocin First peptide hormone whose structure was determined and
Supplementary Figure 1. DJ-1 modulates ROS concentration in mouse skeletal muscle.
 Supplementary Figure 1. DJ-1 modulates ROS concentration in mouse skeletal muscle. (a) mrna levels of Dj1 measured by quantitative RT-PCR in soleus, gastrocnemius (Gastroc.) and extensor digitorum longus
Supplemental Information. Increased 4E-BP1 Expression Protects. against Diet-Induced Obesity and Insulin. Resistance in Male Mice
 Cell Reports, Volume 16 Supplemental Information Increased 4E-BP1 Expression Protects against Diet-Induced Obesity and Insulin Resistance in Male Mice Shih-Yin Tsai, Ariana A. Rodriguez, Somasish G. Dastidar,
AMPK. Tomáš Kuc era. Ústav lékar ské chemie a klinické biochemie 2. lékar ská fakulta, Univerzita Karlova v Praze
 AMPK (AMP- ACTIVATED PROTEIN KINASE ) Tomáš Kuc era Ústav lékar ské chemie a klinické biochemie 2. lékar ská fakulta, Univerzita Karlova v Praze 2013 AMPK AMP-ACTIVATED PROTEIN KINASE present in all eukaryotic
Method of leptin dosing, strain, and group housing influence leptin sensitivity in high-fat-fed weanling mice
 Am J Physiol Regul Integr Comp Physiol 284: R87 R100, 2003; 10.1152/ajpregu.00431.2002. Method of leptin dosing, strain, and group housing influence leptin sensitivity in high-fat-fed weanling mice HEATHER
Supporting Information. Supporting Tables. S-Table 1 Primer pairs for RT-PCR. Product size. Gene Primer pairs
 Supporting Information Supporting Tables S-Table 1 Primer pairs for RT-PCR. Gene Primer pairs Product size (bp) FAS F: 5 TCTTGGAAGCGATGGGTA 3 429 R: 5 GGGATGTATCATTCTTGGAC 3 SREBP-1c F: 5 CGCTACCGTTCCTCTATCA
IL METABOLISMO EPATICO DEI CARBOIDRATI IN FISIOLOGIA E PATOLOGIA
 UNIGASTRO Il fegato come centrale metabolica e i fattori di danno oltre ai virus epatitici IL METABOLISMO EPATICO DEI CARBOIDRATI IN FISIOLOGIA E PATOLOGIA Dr Elisabetta Bugianesi Divisione di Gastro-Epatologia
Metabolism of cardiac muscle. Dr. Mamoun Ahram Cardiovascular system, 2013
 Metabolism of cardiac muscle Dr. Mamoun Ahram Cardiovascular system, 2013 References This lecture Mark s Basic Medical Biochemistry, 4 th ed., p. 890-891 Hand-out Why is this topic important? Heart failure
Pathogenesis of Diabetes Mellitus
 Pathogenesis of Diabetes Mellitus Young-Bum Kim, Ph.D. Associate Professor of Medicine Harvard Medical School Definition of Diabetes Mellitus a group of metabolic diseases characterized by hyperglycemia
Supplemental Figure 1
 Supplemental Figure 1 1a 1c PD-1 MFI fold change 6 5 4 3 2 1 IL-1α IL-2 IL-4 IL-6 IL-1 IL-12 IL-13 IL-15 IL-17 IL-18 IL-21 IL-23 IFN-α Mut Human PD-1 promoter SBE-D 5 -GTCTG- -1.2kb SBE-P -CAGAC- -1.kb
SUPPLEMENTARY INFORMATION
 SUPPLEMENTARY INFORMATION doi:10.1038/nature11464 Supplemental Figure S1. The expression of Vegfb is increased in obese and diabetic mice as compared to lean mice. a-b, Body weight and postprandial blood
Mouse Glu-OC (undercarboxylated osteocalcin) and Gla-OC (carboxylated osteocalcin) levels were
 and Gla-OC (carboxylated osteocalcin) levels were") Supplemental Data Supplemental Materials and Methods Plasma measurements Mouse Glu-OC (undercarboxylated osteocalcin) and Gla-OC (carboxylated osteocalcin) levels were determined using ELISA kits according
Supplemental Data Supplemental Materials and Methods Plasma measurements Mouse Glu-OC (undercarboxylated osteocalcin) and Gla-OC (carboxylated osteocalcin) levels were determined using ELISA kits according
Plasma exposure levels from individual mice 4 hours post IP administration at the
 Supplemental Figure Legends Figure S1. Plasma exposure levels of MKC-3946 in mice. Plasma exposure levels from individual mice 4 hours post IP administration at the indicated dose mg/kg. Data represent
Supplementary Materials
 Supplementary Materials 1 Supplementary Table 1. List of primers used for quantitative PCR analysis. Gene name Gene symbol Accession IDs Sequence range Product Primer sequences size (bp) β-actin Actb gi
Effect of Immune Challenge on Different Genotypes: How Sick Do They Get?
 Introduction Effect of Immune Challenge on Different Genotypes: How Sick Do They Get? M.T. Leininger, C.P. Portocarrero, C.A. Bidwell, M.E. Spurlock, J.N. Nielsen, and K.L. Houseknecht Department of Animal
Supplementary Information. MicroRNA-33b knock-in mice for an intron of sterol regulatory
 Supplementary Information MicroRNA-33b knock-in mice for an intron of sterol regulatory element-binding factor 1 (Srebf1) exhibit reduced HDL-C in vivo Takahiro Horie, Tomohiro Nishino, Osamu Baba, Yasuhide
Supplementary Figure 1. Blood glucose and insulin levels in mice during 4-day infusion.
 Supplementary Figure 1. Blood glucose and insulin levels in mice during 4-day infusion. (A-B) WT and HT mice infused with saline or glucose had overlapping achieved blood glucose and insulin levels, necessitating
Interplay between FGF21 and insulin action in the liver regulates metabolism
 Research article Interplay between FGF21 and insulin action in the liver regulates metabolism Brice Emanuelli, 1 Sara G. Vienberg, 1 Graham Smyth, 1 Christine Cheng, 2 Kristin I. Stanford, 1 Manimozhiyan
Part 3:Strategies for successful aging. Avoiding disease with physical activity
 Part 3:Strategies for successful aging Avoiding disease with physical activity Causes of disability and disease with aging Causes of death for old individuals Atherosclerosis (CHD) CNS-vascular accidents
Metabolic ER stress and inflammation in white adipose tissue (WAT) of mice with dietary obesity.
 of mice with dietary obesity.") Supplementary Figure 1 Metabolic ER stress and inflammation in white adipose tissue (WAT) of mice with dietary obesity. Male C57BL/6J mice were fed a normal chow (NC, 10% fat) or a high-fat diet (HFD,
Supplementary Figure 1 Metabolic ER stress and inflammation in white adipose tissue (WAT) of mice with dietary obesity. Male C57BL/6J mice were fed a normal chow (NC, 10% fat) or a high-fat diet (HFD,
SHU, L; Hoo, RLC; WU, X; PAN, Y; LEE, PC; CHEONG, LY; Bornstein, SR; Rong, X; Gua, J; Xu, A. Citation Nature Communications, 2017, v. 8, p.
 Title mediates adaptive thermogenesis by promoting intracellular activation of thyroid hormones in brown adipocytes Author(s) SHU, L; Hoo, RLC; WU, X; PAN, Y; LEE, PC; CHEONG, LY; Bornstein, SR; Rong,
Supplementary Figure 1. mtor LysM and Rictor LysM mice have normal cellularity and percentages of hematopoe>c cells. a. Cell numbers of lung, liver,
 a. b. c. Supplementary Figure 1. mtor LysM and Rictor LysM mice have normal cellularity and percentages of hematopoe>c cells. a. Cell numbers of lung, liver, and spleen. b. Cell numbers of bone marrow
Oestrogen signalling in white adipose progenitor cells inhibits differentiation into brown adipose and smooth muscle cells
 Received Feb 4 Accepted 8 Sep 4 Published Oct 4 DOI:.8/ncomms696 Oestrogen signalling in white adipose progenitor cells inhibits differentiation into brown adipose and smooth muscle cells Kfir Lapid,,
Supplementary Information
 Supplementary Information Overexpression of Fto leads to increased food intake and results in obesity Chris Church, Lee Moir, Fiona McMurray, Christophe Girard, Gareth T Banks, Lydia Teboul, Sara Wells,
SUPPLEMENTARY INFORMATION
 SUPPLEMENTARY INFORMATION Supplementary Figure 1. Long-term protection studies. 45 minutes of ischemia was induced in wild type (S1pr2 +/+ ) and S1pr2 -/- by MCAO. A) 5 days later brains were harvested
Hypothalamic AMPK-ER Stress-JNK1 Axis Mediates the Central Actions of Thyroid Hormones on Energy Balance
 University of Massachusetts Medical School escholarship@umms UMass Metabolic Network Publications UMass Metabolic Network 7-5-2017 Hypothalamic AMPK-ER Stress-JNK1 Axis Mediates the Central Actions of
Activités scientifiques
 Prof. Françoise Rohner-Jeanrenaud Activités scientifiques I. A role for adipose tissue de novo lipogenesis in glucose homeostasis during catch-up growth: A Randle cycle favoring fat storage Catch-up growth
In The Name Of God. In The Name Of. EMRI Modeling Group
 In The Name Of God In The Name Of God EMRI Modeling Group Cells work together in functionally related groups called tissues Types of tissues: Epithelial lining and covering Connective support Muscle movement
 Supplementary Figure 1 a OD c. 1. 1... Time [min] 1 p
 Implications of mitochondrial skeletal muscle metabolism on diabetes and obesity before and after weight loss
 GG2 Implications of mitochondrial skeletal muscle metabolism on diabetes and obesity before and after weight loss Dr Giacomo Gastaldi CHRU Montpellier Folie 1 GG2 19.10.2009 GG_PC; 12.10.2009 Plan Introduction
ACC ELOVL MCAD. CPT1α 1.5 *** 0.5. Reverbα *** *** 0.5. Fasted. Refed
 Supplementary Figure A 8 SREBPc 6 5 FASN ELOVL6.5.5.5 ACC.5.5 CLOCK.5.5 CRY.5.5 PPARα.5.5 ACSL CPTα.5.5.5.5 MCAD.5.5 PEPCK.5.5 G6Pase 5.5.5.5 BMAL.5.5 Reverbα.5.5 Reverbβ.5.5 PER.5.5 PER B Fasted Refed
Fasted Insulin Coincidence of Macrophage Infiltration into White Adipose Tissue and Onset of Hyperinsulinemia During Diet- Induced Obesity
 Fasted Insulin Coincidence of Macrophage Infiltration into White Adipose Tissue and Onset of Hyperinsulinemia During Diet- Induced Obesity F4/80 MCP-1 (After: Xu et al, 2003 JCI vol.112) F4/80+ Cells are
I. Paterniti, M. Campolo, M. Cordaro, D. Impellizzeri, R. Siracusa, R. Crupi, E. Esposito, and S. Cuzzocrea. University of Messina, Italy
 I. Paterniti, M. Campolo, M. Cordaro, D. Impellizzeri, R. Siracusa, R. Crupi, E. Esposito, and S. Cuzzocrea University of Messina, Italy A spinal cord lesion is a partial or total disruption of the structural