Supplementary Figure 1 Maladaptive response to TAC in CD-Klf5KO mice
|
|
|
- Sophie Fields
- 5 years ago
- Views:
Transcription
1 Supplementary Figure Legends Supplementary Figure 1 Maladaptive response to TAC in CD-Klf5KO mice a, Echocardiography was performed with the mice 3 days after TAC or sham operation. Representative echocardiograms show LV wall motion. LVDd, LVDs, end-diastolic anterior and posterior wall thickness (AWT, PWT) are also shown. n=6-1 in each group. *P<.5. P<.5 vs. sham of the same genotype. b, Lung-to-body weight (LW/BW) ratios and heart and body weights in mice 3 days after TAC or sham operation. Representative lung images are also shown. Scale bars, 1 cm. n=1 in each group except CD-Klf5KO mice subjected to TAC (n=5). c, Representative LV wall sections stained with picrosirius red 3 days after TAC. Scale bars, 5 m. Fractional picrosirius red + fibrotic areas are also shown. n=5 in each group. Supplementary Figure Renal function in TAC-operated mice a, Serum levels of the indicated factors were analyzed in mice before and 7 and 3 days after TAC. No statistically significant differences were found between Klf5 fl/fl and CD-Klf5KO mice at any time point or between before and after TAC. n=1 in each group in pre, n=8 on day 7 and n=5 on day 3. b, Urine volume, glomerular filtration 1 Nature Medicine doi:1.138/nm.36
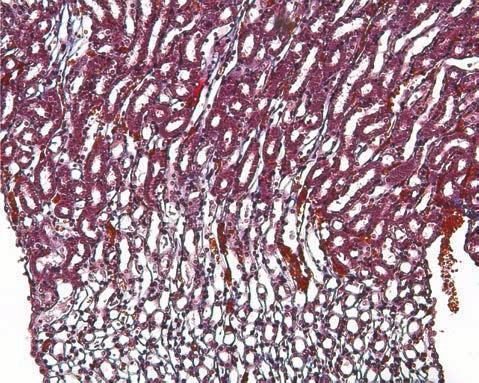
2 rate (GFR), urine volume, urinary Na + excretion, plasma osmolality, urine osmolality, urine Na + /Cr ratio, and urine K + /Cr ratio were analyzed in Klf5 fl/fl and CD-Klf5KO mice after TAC. Relative urinary sodium and potassium levels were normalized to the creatinine concentration (mmol sodium or potassium per mg creatinine), n=8 in each group. P<.5 vs. day of the same genotype. * P<.5, CD-Klf5KO vs. Klf5 fl/fl at the same time point. Supplementary Figure 3 Levels of reactive oxygen species in kidneys ROS levels in cells isolated from kidneys were analyzed using CellROX Deep Red reagent (Molecular Probes). Isolated single cells from kidney were analyzed. Renal cells isolated from Klf5 fl/fl mice and treated with tert-butyl hydroperoxide (TBHP) were used as positive controls. a, Representative plots of CellRox fluorescence in renal cells isolated from a wild-type mouse 3 days after TAC, a mouse in the steady state (Control), and renal cells treated with TBHP. b, Mean CellRox fluorescence intensity from renal cells isolated from Klf5 fl/fl and CD-Klf5KO mice at the indicated times after TAC (n= 6). Supplementary Figure Histology of kidneys Histology sections of kidney from Klf5 fl/fl and CD-Klf5KO mice 6 days after sham Nature Medicine doi:1.138/nm.36
3 operation or TAC. a, Hematoxylin-eosin staining. b, Masson s trichrome staining. Scale bars, 1 m Supplementary Figure 5 Aqp expression Aqp mrna expression was analyzed in kidneys after TAC in Klf5 fl/fl and CD-Klf5KO mice (a), mice subjected to sham operation or renal sympathetic nerve ablation (RSNA) (b), and mice administered either control IgG or anti-csf antibody (c). Aqp mrna levels were first normalized to those of 18s rrna and then further normalized to the level in the kidneys of control mice on day prior to TAC. n=6 in each group. P<.5 vs. day of the same genotype. Supplementary Figure 6 Flow cytometric analysis of cardiac macrophages a, Flow cytometry strategy to identify cardiac macrophages. Cells enzymatically isolated from cardiac ventricles were subjected to flow cytometric analysis. Dead cells indicated by propidium iodide (PI) and circulating granulocytes and monocytes (cells labeled with PerCPCy5.5-CD5 antibody injected via the tail vein just before sacrifice 17 ) were excluded. We set a gate for the cell population used for further analysis in the forward scatter (FSC) / side scatter (SSC) plots, as shown. The majority of 3 Nature Medicine doi:1.138/nm.36
4 CD11b + F/8 + cells were located within this gate. Cell doublets were excluded using pulse width and pulse height plots of the FSC and SSC. Granulocytes were then excluded as Ly6G hi cells. Next, the singlet cells were analyzed for CD11b and F/8. CD11b + F/8 hi (region R1) and CD11b + F/8 lo (region R) cells were defined as cardiac macrophages. b, Surface expression of the macrophage markers CD6 and MerTK in cells in R1 and R gates. Histograms of circulating Ly6C hi monocytes are also shown. c, Representative images of Giemsa-stained cytospin preparations of sorted cardiac CD11b + F/8 hi Ly6C lo and CD11b + F/8 lo Ly6C hi macrophages from mice before treatment (Day ) and 3 and 7 days after the TAC or sham operation. Supplementary Figure 7 Cardiac macrophage numbers normalized to heart tissue weight Data on cardiac macrophages in TAC hearts shown in Fig. 1h were normalized as numbers per mg heart tissue. n=5 in each group except CD-Klf5KO hearts on days 1 and 8 (n=3). *P<.5 vs. Klf5 fl/fl at the same time point. P<.5 vs. the same genotype on day. Supplementary Figure 8 Expression of M1/M markers on cardiac macrophages Nature Medicine doi:1.138/nm.36
5 a, Shown are representative histograms of surface CD6 and CD31 (M markers) expression on Ly6C lo and Ly6C hi macrophages in a steady state. Blue lines denote isotype controls. b, Relative mrna expression of M1/M marker genes and Areg in cardiac Ly6C hi and Ly6C lo macrophages from Klf5 fl/fl and CD-Klf5KO mice in a steady state (day ) and 3 days after TAC. mrna levels were first normalized to those of 18s rrna and then further normalized to the levels in Ly6C lo macrophages on day. n=8 in each group. *P<.5 between days and 3 of the same cell-type and genotype. P<.5 between the Klf5 fl/fl and CD-Klf5KO genotype of the same cell-type at the same time point. Supplementary Figure 9 Subpopulations in cardiac macrophages a, Cardiac CD11b + F/8 + macrophages isolated from TAC- or sham-operated mice on day 3 were further analyzed for MHCII and Ly6C using flow cytometry. CD11b + F/8 + Ly6C lo cells in these plots correspond to the cells within R1 in Fig. 1F, and CD11b + F/8 + Ly6C hi cells correspond to the cells within R in Fig. 1F. The former contain two major populations: Ly6C lo MHCII hi (R3) and Ly6C lo MHCII lo (R) cells. b, CD11c levels in the cells within R3-5. c, CD11b + F/8 hi Ly6C lo MHCII hi (R3) and CD11b + F/8 hi Ly6C lo MHCII lo (R) cell fractions in hearts 3 days after the sham or TAC 5 Nature Medicine doi:1.138/nm.36
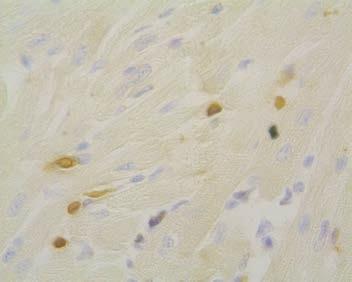
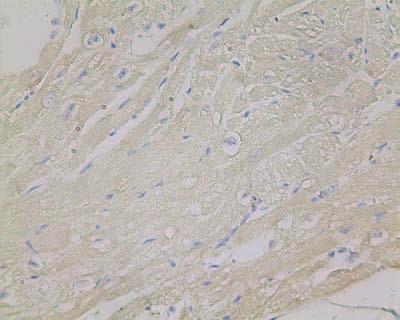
6 operation. n=6 in each group. *P<.5. Supplementary Figure 1 Transplantation of cardiac macrophages into the LV wall Cardiac Ly6C lo macrophages and Ly6C hi monocytes/macrophages were isolated from CD5.1 or CAG-EGFP mice in a steady state. Isolated macrophages (5x1 5 ) were re-suspended in 3 l of PBS and injected into 15- sites within the LV wall using a 3-gauge needle. a, Representative images of sections of vehicle-injected, cardiac Ly6C lo macrophage-transplanted and Ly6C hi macrophage-transplanted hearts from CD-Klf5KO mice 7 days after transplantation. Cardiac macrophages were isolated from CAG-EGFP mice. The sections were immunostained for EGFP (brown). Nuclei were counterstained with hematoxylin. Scale bars, 5 m. Endo, endocardial side, Mid, mid portion of the myocardium, Epi, epicardial side. b, Flow cytometric analysis of macrophages from the hearts of CD5. + CD-Klf5KO mice 7 days after transplantation of cardiac macrophages isolated from CD5.1 + mice. Shown are representative plots of 6 experiments. Note that the transplanted Ly6C lo macrophages and Ly6C hi monocytes/macrophages continued to exhibit their respective surface markers 7 days after transplantation. Blue lines denote isotype control. 6 Nature Medicine doi:1.138/nm.36
7 Supplementary Figure 11 Transplanted macrophages in the hearts CD5.1 + Ly6c lo cardiac macrophages (5x1 cells for one recipient mouse) were transplanted into the hearts of CD5. + CD-Klf5KO mice. As a control for transplantation, vehicle was injected. One day after transplantation, the mice were subjected to TAC. The fractions of total (CD CD5. + ) cardiac Ly6C lo macrophages (a), CD5.1 + Ly6C lo macrophages derived from transplanted cells (b), and endogenous CD5. + Ly6C lo macrophages (c) are shown. n=6 of each group. CTRL shows results from hearts of untreated CD-Klf5KO mice in the steady state. Note that while fractions of CD5.1 + Ly6C lo macrophages were decreased from day 1, endogenous CD5. + Ly6C lo macrophages were increased, suggesting stimulation of endogenous macrophage growth by the transplanted cells. P<.5 vs. CTRL. * P<.5 between vehicle and Ly6C lo macrophage-transplantation at the same time point. ND, not detected. Supplementary Figure 1 Computer simulation of macrophage distribution We ran computer simulations of macrophage distributions within a 3 m x 3 m x m cuboidal volume of heart tissue. a, Representative results of a computer 7 Nature Medicine doi:1.138/nm.36
8 simulation with a heart cuboid containing % macrophages as spheres with -3 m diameters. Different colors correspond to different macrophage diameters. b, Spatial distribution of macrophages at % of the total cells in 1 randomly chosen 5- m sections of heart cuboid. c, The probability density function for the number of macrophages in each 5 m of 8 consecutive sections of heart cuboid in 5 computer simulations of the macrophage distribution within the cuboid. One percent, % or 3% of the total cells were assumed to be macrophages. The probability density functions for 1%, % and 3% macrophages are shown in the red, blue and green bars, respectively. On average, there are 1.1,.3 and 3.3 macrophages in each 5- m section for 1%, % and 3% fractions, respectively. In our numerical simulations, the average number of macrophages per section was consistent with the histological observations of macrophages shown in Supplementary Figure 1. Supplementary Figure 13 Cardiac effects of transplantation of cardiac macrophages The hearts of CD-Klf5KO mice were injected with vehicle, Ly6C lo cardiac macrophages or Ly6C hi cardiac monocytes/macrophages 1 day prior to TAC. a, Hematoxylin and eosin stained sections of hearts 6 days after TAC. b, Echocardiography results 3 days 8 Nature Medicine doi:1.138/nm.36
9 after TAC. n=6 in each group. LVEF is shown in Figure b. * P<.5. c, Cross-sectional area of cardiomyocytes 7 days after TAC. n=5 in each group. * P<.5. Supplementary Figure 1 Local proliferation of cardiac Ly6C lo macrophages a, DNA synthesis in cardiac Ly6C lo macrophages was analyzed using EdU (5-ethynyl- -deoxyuridine) incorporation. Six hours after TAC or sham operation, EdU ( g) was injected intravenously. After an additional h, incorporation of EdU in cardiac Ly6C lo macrophages was analyzed. Shown are representative flow cytometry plots and EdU + cell fractions among Ly6C lo macrophages. n=5. *P<.5. b, Cardiac Ly6C lo macrophages isolated from Klf5 fl/fl and CD-Klf5KO mice in the steady state (control) and on day 7 after TAC were fixed and labelled with propidium iodide. Shown are representative plots. Supplementary Figure 15 Hypertrophic effects of cardiac macrophage-conditioned medium and AREG a, Effects on the size of cultured neonatal cardiomyocytes of medium conditioned by cardiac Ly6C hi or Ly6C lo macrophages from wild-type mice 3 days after TAC. Cardiomyocytes were cultured with the indicated medium for 8 h. n=1 in each group. 9 Nature Medicine doi:1.138/nm.36
10 P<.5 vs. cardiomyocytes cultured with control media. *P<.5. b, Effects of recombinant mouse AREG on the size of cultured neonatal cardiomyocytes. Cardiomyocytes were cultured for 8 h with vehicle (Control) or the indicated concentrations of AREG (n=1). c, Effects on the size of cultured neonatal cardiomyocytes of medium conditioned by cardiac Ly6C lo macrophages from wild-type (WT) or Areg -/- mice 3 days after TAC (n=1). Supplementary Figure 16 Inhibition of AREG signaling induces heart failure after TAC Wild-type mice administrated an anti-areg neutralizing antibody (5 g every 3 days starting just prior to TAC) or control IgG were subjected to TAC. a, Flow cytometric analysis of cardiac macrophages. Cardiac macrophage fractions among total live cells isolated from hearts at the indicated times are shown. n=6 in each group. P<.5 vs. the same procedure on day. b, Left ventricular ejection fraction (LVEF) 7 days after TAC. n=1 (Control IgG) or 9 (AREG-Ab). *P<.5. c, Heart-to-body weight ratios (HW/BW) 7 days after TAC. n=7 (Control IgG) or 5 (AREG-Ab). d, Kaplan-Meier plot of survival following TAC. n=1 in each group. *P<.5 vs. control IgG (Log-rank test). e, Cross-sectional area of cardiomyocytes 7 days after TAC. n=6 in each group. 1 Nature Medicine doi:1.138/nm.36
11 Supplementary Figure 17 AREG protects CD-Klf5KO mice from heart failure Wild-type and CD-Klf5KO mice intraperitoneally administered recombinant mouse AREG (5 g, 3 times per week) or vehicle were subjected to TAC. a, Flow cytometric analysis of cardiac macrophages. The cells were isolated from hearts 3 days after TAC or sham operation. Shown are the cardiac macrophage fractions among total live cells isolated from hearts at the indicated times. n=5 in each group. *P<.5 between Day and day 7 of the same treatment. b, Left ventricular ejection fraction (LVEF) 3 days after TAC. n=6 (WT), n=5 (control) or 6 (AREG). *P<.5. c, Heart-to-body weight ratios (HW/BW) 3 days after TAC. n=5 in each group. *P<.5. d, Kaplan-Meier plot of survival following TAC. n=1 in each group. *P<.5 vs. CD-Klf5KO plus vehicle (Log-rank test). e, Cross-sectional area of cardiomyocytes 3 days after TAC or sham operation. n=5 in each group. *P<.5. Supplementary Figure 18 Areg -/- cardiac Ly6C lo macrophages fail to rescue CD-Klf5KO mice after TAC Ly6C lo cardiac macrophages isolated from wild-type (WT) or Areg -/- mice were transplanted into the LV wall of CD-Klf5KO mice 1 day prior to TAC. Vehicle was 11 Nature Medicine doi:1.138/nm.36
12 injected into control mice. a, Flow cytometric analysis of cardiac macrophages. Shown are cardiac macrophage fractions isolated from hearts 3 days after TAC. n=5 in each group. *P<.5. b, Heart-to-body weight ratios (HW/BW) 7 days after TAC or sham operation (n=5). *P<.5. c, Cross-sectional area of cardiomyocytes 7 days after TAC. n=5 in each group. *P<.5. Supplementary Figure 19 Bone marrow-specific Areg deletion impairs the cardiac adaptive response to TAC BM cells (1x1 6 ) from Areg -/- or wild-type (WT) mice (CD5.) were transplanted into lethally irradiated CD5.1 mice for cell tracking or CD5. mice for TAC. a, Six weeks after BMT, donor chimerism of cardiac Ly6C lo macrophages and Ly6C hi monocytes/macrophages was analyzed. Shown are the CD5. + cell fractions among the total (CD5.1 + plus CD5. + ) cells. n=6. b, Levels of Areg expression in cardiac Ly6C lo macrophages and Ly6C hi monocytes/macrophages 3 days after sham operation or TAC. n=6 in each group. mrna levels were first normalized to the 18s rrna levels and then to the level in Ly6C lo macrophages isolated from sham-operated WT-BMT mice. *P<.5 vs. WT-BMT for the same operation. P<.5 vs. sham for the same BMT. ND, Areg expression was not detected. c, Flow cytometric analysis of cardiac 1 Nature Medicine doi:1.138/nm.36
13 monocyte/macrophage fractions among the total living cells isolated from hearts 3 days after sham operation or TAC. *P<.5 vs. sham for the same BMT group. n=6 in each group. d, Fibrotic areas were analyzed using Masson s trichrome-stained sections of hearts collected 3 days after TAC. n=5 in each group. *P<.5 vs WT-BMT, P<.5 vs. sham for the same BMT. Supplementary Figure Cytokine gene expression in kidneys and renal macrophages a, Cytokine gene expression was analyzed using RT PCR arrays in kidneys 1 day after TAC. Shown are relative expression levels in Klf5 fl/fl kidneys versus those in CD-Klf5KO kidneys. b, Cytokine gene expression in sorted renal CD11b + F/8 hi Ly6C lo macrophages. Shown are relative expression levels in Ly6C lo renal macrophage from Klf5 fl/fl versus those in CD-Klf5KO kidneys. Supplementary Figure 1 Effects of recombinant CSF administration on cardiac macrophage numbers and cardiac function a, Recombinant mouse CSF ( or 5 g) was administrated intraperitoneally, after which serum CSF concentrations were evaluated using an ELISA. b, Vehicle or CSF 13 Nature Medicine doi:1.138/nm.36
14 (.5 g/mouse) was administered intraperitoneally to CD-Klf5KO mice. One day later, the mice were subjected to TAC. Shown are the dead cell fractions determined based on PI staining of cardiac Ly6C lo macrophages one day after TAC. n=5 in each group. *P<.5 vs. vehicle. In c and d, Klf5 fl/fl and CD-Klf5KO mice were administered CSF and subjected to TAC as shown in Fig. 3b-d. c, Echocardiography in CSF- or vehicle-administrated Klf5 fl/fl and CD-Klf5KO mice 3 days after TAC. n=6 in each group. LVEF is shown in Figure 3c. P<.5 vs. Klf5 fl/fl for the same treatment. *P<.5 between vehicle and CSF in the same genotype. d, Histological analysis of cardiomyocyte area 6 days after TAC. P<.5 vs. Klf5 fl/fl for the same treatment. *P<.5 between vehicle and CSF in the same genotype. n=6 in each group except CD-Klf5KO with vehicle (n=5). Supplementary Figure Effects of CSF neutralization Anti-CSF antibody or control IgG was continuously administered at.5 g/day using an osmotic minipump, beginning 3 days prior to the TAC operation, as shown in Fig.. a, Cross-sectional areas of cardiomyocytes 7 days after TAC. n=6 in each group. *P<.5. P<.5 vs.. b, Fibrotic areas were analyzed using Masson s trichrome-stained sections of hearts collected 3 days after TAC. n=6 in each group, 1 Nature Medicine doi:1.138/nm.36
15 except anti-csf+tac (n=5). *P<.5. P<.5 vs.. c, Levels of Areg mrna in cardiac Ly6C lo macrophages. n=6. *P<.5. P<.5 vs. sham receiving the same treatment. Supplementary Figure 3 CSF increases cardiac Ly6C lo macrophages in mice in a steady state CSF (5 g) or vehicle (PBS) was administered intraperitoneally into mice in a steady state, and tissue macrophage fractions were analyzed h after the administration. Shown are the cardiac Ly6C lo and Ly6C hi macrophage and liver Kupffer cell fractions (CD11b lo F/8 hi Ly6G - ) among total live cells, as well as the brain microglia (CD11b + F/8 + Ly6G - ) fraction among live cells within a gate for small cells. n=5 in each group. *P<.5 vs. vehicle for the same cell-type. Supplementary Figure Csf expression in various tissues Csf mrna expression was analyzed in selected tissues from Klf5 fl/fl and CD-Klf5KO mice collected 3 days after TAC or sham operation. Csf mrna levels were first normalized to those of 18s rrna and then to the level in the kidneys of sham-operated Klf5 fl/fl mice. P<.5 vs. sham-operated same genotype. *P<.5 between Klf5 fl/fl and 15 Nature Medicine doi:1.138/nm.36
16 CD-Klf5KO subjected to TAC. n=6 except CD-Klf5KO+TAC (n=5). Supplementary Figure 5 Renal CSF production in response to TAC a, Wild-type mice were subjected to the TAC or sham operation. Six and h after the operations, bilateral kidneys were isolated from the mice, sliced and cultured for 6 h in 3 ml of medium. Shown are the CSF concentrations in the culture media. n=5 in each group. P<.5 vs. untreated mice of the same genotype. $ P<.5 vs. 6 h after TAC for the same genotype. *P<.5 between Klf5 fl/fl and CD-Klf5KO mice at the same time point. b, Serum CSF concentrations in selected vessels. Blood was collected from the left ventricle, renal vein, and inferior vena cava (just before the right atrium) at the indicated time points after TAC. Hour represents untreated mice. n=6 in each group, *P<.5. P<.5 vs. Klf5 fl/fl in the same vessel at the same time point. c, Renal CD31 + CDH5 + vascular endothelial cells (ECs) were isolated from the renal cortex, outer medulla and inner medulla of wild-type mice 1 day after TAC or sham operation. The remaining unsorted cells were used as non-ec cells. Csf mrna levels were first normalized to those of 18s rrna and then to the level in cortical ECs from sham-operated mice. n=6 mice in each group. P<.5 vs. sham operated ECs from the same kidney region. *P<.5. d, CD cell and EC fractions among renal cells isolated 16 Nature Medicine doi:1.138/nm.36
17 from mice in a steady state. n=6. *P<.5. e, CSF production in renal CD cells and ECs isolated from kidneys 1 day after TAC or sham operation. The cells (1 6 cells/well) were cultured in 5 l of medium for 6 h, after which the CSF concentration was measured. n=6 mice in each group. *P<.5. f, CD cells do not enhance Csf expression in ECs. ECs (1 6 cells/well) isolated from steady-state kidneys were cultured for 1 h in the bottom wells of Boyden chambers. CD cells (x1 5 cells) isolated from kidneys 1 day after TAC (TAC) or sham () operation were in the inserts. Csf mrna expression in ECs was analyzed. Csf mrna levels were first normalized to those of 18s rrna and then to the level in ECs cultured alone. n=5 in each group. Supplementary Figure 6 Effects of subtotal nephrectomy on renal CSF and cardiac macrophages Mice were subjected to sham operation or subtotal nephrectomy (upper and lower poles of left kidney were tied, followed by right nephrectomy). Three days after the operation, the mice were subjected to sham or TAC. a, Serum CSF levels 1 day after TAC or sham operation. n=6 in each group. b, Cardiac macrophage fractions on day 3 after TAC. n=6 in each group. P<.5 vs. sham. *P<.5 vs TAC. 17 Nature Medicine doi:1.138/nm.36
18 Supplementary Figure 7 Effects of renal EC-selective Csf knockdown a, To analyze the efficacy and specificity of magnetic nanoparticle-mediated delivery of sirna, we injected Cy5-labled sirna mixed with SilenceMag reagent into the tail vein. Six hours after injection, kidneys were harvested and tissue sections were immunostained for Cy5 (red) and CD31 (green). In the magnet placement group, magnets were placed on the bilateral kidneys. Nuclei were counterstained with Hoechst 333 (Blue). Shown are representative images of immunostained sections. Scale bars, m. b, Effect of magnet-guided sirna delivery to kidneys on Csf mrna expression in ECs and renal CD cells. sirna targeting Csf was administrated to mice 1 day prior to TAC. ECs were isolated from the indicated organs as CD31 + CDH5 + cells h after TAC. Csf levels in whole spleen and in bone marrow cells were also analyzed. mrna levels were first normalized to the 18s rrna levels and then to the level in renal ECs from sham operated mice. n=6 in each group. P<.5 vs. control sirna injection plus sham operation. *P<.5 between control sirna and Csf-siRNA in the same operation group. c, Western analysis of CSF in CD31 + CDH5 + ECs. ECs were isolated 6 h after TAC. d, Serum CSF levels in mice 1 day after either sham operation or TAC. n=6 in each group. e, Cardiac macrophage fractions on day 3 after TAC. n=6 in each group. f, Echocardiography data collected on day 3 after TAC. n=6 18 Nature Medicine doi:1.138/nm.36
19 in each group. g, Histological analysis of cardiomyocyte cross-sectional area on day 6 after TAC. n=6-7 in each group. h, Kaplan-Meier survival plots. n=1 in each group. *P<.5 vs. control sirna injection plus sham operation. Supplementary Figure 8 TAC modulates renal macrophages a, Expression of Klf5, S1a8 and S1a9 mrna in renal CD cells at the indicated times after TAC. n=3 in each group. *P<.5 vs. untreated mice (Hour ). b, Protein expression of KLF5, S1A8 and S1A9 in renal CD cells after TAC. c, Renal macrophage fractions after TAC. Shown are renal CD11b + F/8 hi Ly6C lo and CD11b + F/8 lo Ly6C hi macrophage fractions among all live cells isolated at the indicated times (H, Hour; D, Day) from the kidneys of mice subjected to TAC. H represents fractions in untreated mice. n=3 at each time point. *P<.5 vs. untreated. d, Csf mrna expression in renal ECs after TAC. Csf mrna levels were analyzed at the indicated times. mrna levels were first normalized to the 18s rrna levels and then to the level in cells isolated from untreated mice (hour ). n=3. *P<.5 vs. untreated. e, Protein expression of CSF in renal ECs after TAC. Supplementary Figure 9 S1A8/A9 activate renal macrophages and ECs 19 Nature Medicine doi:1.138/nm.36
20 a and b, CD11b + F/8 hi Ly6C lo macrophages (5x1 5 cells/well) were isolated from the kidneys of mice in a steady-state and treated for h with S1A8 and S1A9 (.5 or 1 g/ml each) or LPS (1 ng/ml). As a control, the cells were treated with vehicle containing the very low concentration (.368 EU/ml) of LPS found in solutions of recombinant S1 protein containing 1 g/ml S1A8/S1A9. In a, Tnf mrna levels are shown. Tnf mrna levels were first normalized to those of 18s rrna and then to that in control. n=5. P<.5 vs. control. In b, TNF protein levels are shown. c, Renal ECs were isolated from mice in a steady state and cultured in the bottom wells of Boyden chambers at 1 6 cells/well. Renal CD11b + F/8 hi Ly6C lo macrophages were isolated from mice 6 h after TAC or sham operation and cultured in the inserts of Boyden chambers at 5x1 5 cells/insert. The macrophages and ECs were cocultured for 6 h with control IgG or anti-tnf- neutralizing antibody (5 ng/ml), as indicated. Csf mrna levels in the ECs were first normalized to those of 18s rrna and then to the level in ECs cultured alone with control IgG. n=6 in each group. P<.5 vs. control with normal IgG. *P<.5. Supplementary Figure 3 Effects of RSNA and CD-specific Klf5 deletion on renal sympathetic nerve activity Nature Medicine doi:1.138/nm.36
21 a, Renal vein plasma norepinephrine concentrations. Mice were first subjected to renal sympathetic nerve ablation (RSNA) or sham operation. One week later they were subjected to TAC or sham operation, after which blood samples were taken from the renal vein (n=6). P<.5 vs. renal sham plus heart sham, *P<.5 between renal sham plus TAC and RSNA plus TAC. b, Urinary norepinephrine concentrations were measured in mice at the indicated times after TAC. The mice had been subjected to sham operation or RSNA 1 week prior to TAC. n=6 in each group. c, Urinary norepinephrine concentrations in Klf5 fl/fl and CD-Klf5KO mice at the indicated times after TAC. n=6 in each group. P<.5 vs. the same genotype on day. *P<.5 vs. Klf5 fl/fl at the same time point. Supplementary Figure 31 Effects of RSNA on CSF production and cardiac hypertrophy and fibrosis a, CSF secretion from kidneys isolated from mice subjected to RSNA and TAC, as indicated. The kidneys were isolated 1 day after TAC and cultured for 6 h, as described in fig. a. *P<.5 between TAC and RSNA+TAC. P<.5 vs.. b, Cross-sectional areas of cardiomyocytes 7 days after TAC. n=6 in each group. *P<.5. P<.5 vs.. c, Fibrotic areas were analyzed using Masson s trichrome-stained 1 Nature Medicine doi:1.138/nm.36
22 sections of hearts collected 3 days after TAC. n=6 in each group except RSNA+TAC (n=5). *P<.5. P<.5 vs.. Supplementary Figure 3 Effects of inhibiting cardiac afferent nerve activity Wild-type mice whose cardiac afferent nerve signaling had been compromised by epicardial application of capsaicin and/or the selective thoracic dorsal rhizotomy (SDR) were subjected to TAC. The capsaicin treatment was performed 1 week and the SDR weeks prior to TAC. Csf mrna expression was analyzed in kidneys 1 day after TAC or sham operation with capsaicin treatment and/or SDR. Csf mrna levels were first normalized to those of 18s rrna and then to the level in the kidneys of TAC sham, SDR sham and capsaicin vehicle administrated mice. n=6 in each group. P<.5 vs. TAC sham, capsaicin vehicle, SDR sham mice. *P<.5 between indicated groups. Supplementary Figure 33 CSF production in response to myocardial infarction Myocardial infarction (MI) was induced by permanent ligation of left anterior descending coronary artery. a, MI was induced in mice subjected to sham operation or sympathetic nerve ablation (RSNA) 7 days prior to MI. n=6 in each group. Shown are serum CSF levels at indicated times after MI. P<.5 vs. day in the same operation Nature Medicine doi:1.138/nm.36
23 group. *P<.5 between MI with renal sham and MI with RSNA at the same time point. b, MI was induced in Klf5 fl/fl and CD-Klf5KO mice. Shown are serum CSF concentrations after MI. n=6 in each group. P<.5 vs. day of the same genotype. *P<.5 between Klf5 fl/fl and CD-Klf5KO at the same time point. Supplementary Figure 3 Effects of stimulation on CD cells and kidneys a and b, Cultured sorted CD cells from wild-type mice were treated with 1 mol/l isoproterenol (ISP) or vehicle (control). In a, relative mrna expression in cultured CD cells is shown. n=6 in each group. P<.5 vs. pretreatment. *P<.5 between control and ISP at the same time point. In b, protein expression in cultured CD cells h after administration of ISP or vehicle is shown. c, ISP (15 mg/kg) or vehicle was intraperitoneally injected into Klf5 fl/fl or CD-Klf5KO mice as shown in Fig. 5g. Western analyses of protein levels are shown. Supplementary Figure 35 Plasma renin activity In a, plasma renin activity was analyzed in Klf5 fl/fl and CD-Klf5KO mice at the indicated times after TAC. n=6 in each group. P<.5 vs. day of the same genotype. *P<.5 between Klf5 fl/fl and CD-Klf5KO at the same time point. In b, plasma renin 3 Nature Medicine doi:1.138/nm.36
24 activity was analyzed in TAC mice that had undergone either sham operation or renal sympathetic nerve ablation (RSNA). n=6 in each group. P<.5 vs. day in the same operation group. *P<.5 between sham and RSNA at the same time point. Supplementary Figure 36 Plasma vasopressin levels a, Plasma vasopressin (AVP) levels were analyzed in Klf5 fl/fl and CD-Klf5KO mice at indicated times after TAC. n=6 in each group except CD-Klf5KO mice subjected to TAC day3 (n=). P<.5 vs. day (steady state) of the same genotype. *P<.5 between the two genotypes at the same time point. b, Plasma AVP levels were analyzed in mice subjected first to renal sympathetic nerve ablation (RSNA) or sham operation and then TAC. Shown are plasma AVP levels at the indicated times after TAC. n=6 in each group except RSNA mice subjected to TAC day 3 (n=). P<.5 vs. day (steady state) in the same operation group. *P<.5 between RSNA and sham. c, Plasma vasopressin levels were analyzed in the mice administered anti-csf antibody or control IgG as described in Fig. 3e. n=6 in each group except anti-csf administrated mice subjected to TAC day 3 (n=3). P<.5 vs. day (steady state) in the same treatment group. *P<.5 between control IgG and anti-csf at the same time point. Nature Medicine doi:1.138/nm.36
25 Supplementary Figure 37 Collecting duct-specific Klf5 deletion DNA recombination efficacy in the indicated organs and cells in CD-Klf5KO mice was evaluated using genomic PCR. Shown is a quantitative analysis of the DNA recombined by Aqp-driven Cre to produce floxed-out alleles. Supplementary Figure 38 Original western blot images for Supplementary Figures 7 and 8 Supplementary Figure 39 Original western blot images for Supplementary Figures 8 and 9 Supplementary Figure Original western blot images for Supplementary Figure 33 Supplementary Figure 1 Original western blot images for Supplementary Figure 33 5 Nature Medicine doi:1.138/nm.36
")
")
 3 1 Klf5 fl/fl CD-Klf5KO Klf5")


26 a Klf5 fl/fl CD-Klf5KO Klf5 fl/fl CD-Klf5KO LVDd (mm) LVDs (mm) AWT (mm) 1 PWT (mm) TAC TAC TAC TAC b LW/BW (mg/g) 1 Heart weight (mg) 1 Body weight (mg) 3 1 Klf5 fl/fl CD-Klf5KO Klf5 fl/fl CD-Klf5KO TAC TAC TAC c Klf5 fl/fl CD-Klf5KO 6 %Fibrosis area Klf5 fl/fl CD-Klf5KO TAC Supplementary Figure 1 Nature Medicine doi:1.138/nm.36
27 a.5 Creatinine (mg/dl) Days after TAC Urea nitrogen (mg/dl) Days after TAC Klf5 fl/fl CD-Klf5KO Sodium (meq/l) 1 5 Chloride (meq/l) 8 Potassium (meq/l) 7 3 Days after TAC 7 3 Days after TAC 7 3 Days after TAC b Urine volume (µl/h) Days after TAC GFR (µl/min) Days after TAC Urinary Na + excretion (meq/h) Days after TAC Klf5 fl/fl CD-Klf5KO 3 8 Posm (mosm/kgh O) Days after TAC Uosm (mosm/kgh O) Days after TAC Urine Na + /Cr Days after TAC Urine K + /Cr Days after TAC Supplementary Figure Nature Medicine doi:1.138/nm.36
28 a Iso Count Control kidney TAC day 3 TBHP-treated CellROX fluorescence b Mean fluorescence intensity 6 NS NS NS 3 7 Klf5 fl/fl CD-Klf5KO Days after TAC Supplementary Figure 3 Nature Medicine doi:1.138/nm.36


29 a CD-Klf5KO Klf5fl/fl TAC CD-Klf5KO TAC Inner medulla Medulla Outer medulla Cortex Klf5fl/fl b CD-Klf5KO Klf5fl/fl TAC Inner medulla Medulla Outer medulla Cortex Klf5fl/fl Supplementary Figure Nature Medicine doi:1.138/nm.36 CD-Klf5KO TAC
30 a Relative Aqp level 1 Klf5fl/fl CD-Klf5KO 7 3 Days after TAC b Relative Aqp level Days after TAC RSNA c Relative Aqp level 1 Control IgG anti-csf Ab 7 3 Days after TAC Supplementary Figure 5 Nature Medicine doi:1.138/nm.36


31 SSC-A FSC-W SSC-W a PICD5PerCPCy5.5- FSC-H CD11b FSC-A Iso SSC-H R1 R F/8 Ly6G b R1, R cells Iso R1 R Circulating Ly6Chi monocytes Iso Iso Iso R1 R CD6 c MerTK Untreated CD6 TAC Day 3 R1 R Supplementary Figure 6 Nature Medicine doi:1.138/nm.36 Day 7 MerTK
32 Ly6C lo macrophage Ly6C hi macrophage (cells/mg) 8 (cells/mg) 1 Klf5 fl/fl CD-Klf5KO Days after TAC Days after TAC Supplementary Figure 7 Nature Medicine doi:1.138/nm.36
33 a Ly6C lo Ly6C hi b CD6 CD31 Relative transcript level Days after TAC Macrophage-type Tnf Nos Ifng lo hi lo hi lo hi lo hi lo hi lo hi Klf5 fl/fl CD-Klf5KO Relative transcript level 1 Arg1 Ym1 Fizz1 1 1 Days after TAC Macrophage-type lo hi lo hi lo hi lo hi lo hi lo hi Relative transcript level Mrc1 Clec1a Areg 6 1 Days after TAC Macrophage-type lo hi lo hi lo hi lo hi lo hi lo hi Supplementary Figure 8 Nature Medicine doi:1.138/nm.36

34 a b MHCII R3 R3 R R5 R R5 R3 TAC TAC CD11c R R5 Ly6C c R3 cells R cells %Living cells 3 1 %Living cells 3 1 Klf5 fl/fl CD-Klf5KO TAC TAC Supplementary Figure 9 Nature Medicine doi:1.138/nm.36


35 a Vehicle Ly6C lo macrophages Ly6C hi mono/macro Endo Mid Epi b Vehicle Ly6C lo macrophages Ly6C hi mono/macro CD5. CD5.1 F/8 CD11b Ly6C Ly6C Supplementary Figure 1 Nature Medicine doi:1.138/nm.36
36 a Total Ly6C lo macrophage % in total live cells 8 6 Vehicle-injection CD5.1 + Ly6C lo -transplantation b CTRL Days after TAC 6 CD5.1 + Ly6C lo macrophage % in total live cells ND ND CTRL ND ND ND ND ND c 8 CD5. + Ly6C lo macrophage % in total live cells 6 CTRL Supplementary Figure 11 Nature Medicine doi:1.138/nm.36

37 a c b Supplementary Figure 1 Nature Medicine doi:1.138/nm.36
 LVDs (mm) AWT (mm)")

 Vehicle Ly6C lo Ly6C hi")
38 a Vehicle Ly6C lo -transplanted Ly6C hi -transplanted b 1 1 LVDd (mm) LVDs (mm) AWT (mm) PWT (mm).5 Vehicle Ly6C lo Ly6C hi Vehicle Ly6C lo Ly6C hi Vehicle Ly6C lo Ly6C hi Vehicle Ly6C lo Ly6C hi c Cross-sectional area (µm ) Vehicle Ly6C lo Ly6C hi Supplementary Figure 13 Nature Medicine doi:1.138/nm.36
39 b a Day 1 TAC 1.5 F/8 % E d U + cells 1 E d U.5 7 TAC TAC Day 1 Day fl/ fl Klf5 CD-Klf5KO Control Control TAC TAC PI Supplementary Figure 1 Nature Medicine doi:1.138/nm.36
40 a b c Cell surface area (µm ) Cell surface area (µm ) Cell surface area (µm ) Control Ly6C lo -CM Ly6C hi -CM Control AREG ng/ml AREG 75ng/ml Control WT Ly6C lo -CM Areg -/- Ly6C lo -CM Supplementary Figure 15 Nature Medicine doi:1.138/nm.36
41 a b c Ly6C lo macrophage (%) 8 6 Control IgG AREG-Ab NS NS 7 Ly6C hi monocyte/macrophage (%).6.. NS NS 7 Days after TAC LVEF (%) 8 Control IgG AREG-Ab HW/BW(mg/g) 8 6 Control IgG AREG-Ab d e %Survival Control IgG AREG-Ab Cross-sectional area (µm ) 6 Days after TAC Control IgG AREG-Ab Supplementary Figure 16 Nature Medicine doi:1.138/nm.36
42 a b Ly6C lo macrophages (%) 6 NS NS NS NS Ly6C hi macrophages (%).. NS NS NS NS WT + Vehicle WT + AREG CD-Klf5KO + Vehicle CD-Klf5KO + AREG LVEF(%) 7 Days after TAC 7 Days after TAC WT WT+AREG CD-Klf5KO CD-Klf5KO+AREG c d e WT + Vehicle WT + AREG CD-Klf5KO + Vehicle CD-Klf5KO + AREG HW/BW(mg/g) 8 6 WT WT+AREG CD-Klf5KO CD-Klf5KO+AREG %Survival CD-Klf5KO + AREG CD-Klf5KO 6 Days after TAC Cross-sectional area (µm ) WT WT+AREG CD-Klf5KO CD-Klf5KO+AREG Supplementary Figure 17 Nature Medicine doi:1.138/nm.36
43 a b c Ly6C lo macrophage (%) 8 6 Control WT-Ly6C lo Areg -/- -Ly6C lo Ly6C hi monocyte/macrophage (%) Control WT-Ly6C lo Areg -/- -Ly6C lo HW/BW (mg/g) 8 6 Control WT-Ly6C lo Areg -/- -Ly6C lo Cross-sectional area (µm ) Control WT-Ly6C lo Areg -/- -Ly6C lo Supplementary Figure 18 Nature Medicine doi:1.138/nm.36
44 a b 6 %CD5. + cells 1 5 WT-BMT Areg -/- -BMT Relative Areg transcript level ND ND Ly6C lo Ly6C hi WT-BMT Areg -/- -BMT WT-BMT Areg -/- -BMT WT-BMT Areg -/- -BMT WT-BMT Areg -/- -BMT TAC TAC Ly6C lo Ly6C hi c d WT-BMT Areg -/- -BMT Ly6C lo macrophage (%) (%) 8.6 NS 6. NS. Ly6C hi monocyte/macrophage NS NS WT-BMT Areg -/- -BMT %Fibrotic area 8 6 TAC TAC TAC Supplementary Figure 19 Nature Medicine doi:1.138/nm.36
45 PCOLC BMPA BMP3 Aplnr Bdnf Cxcr5 Bmp1 Bmp15 Bmp6 Ccbp Ccl1 Ccl11 Ccl1 Ccl17 Ccl19 Ccl Ccl Ccl Ccl5 Ccl6 Ccl7 Ccl8 Ccl9 Ccr1 Ccr1l1 Ccr Ccr3 Ccr Ccr5 Ccr6 Ccr7 Ccr8 Ccr9 Ccrl1 Ccrl Cmtma Cmtm3 Cmtm Cmtm5 Cmtm6 Cmklr1 Cxcr7 Csf1 Csf Cx3cl1 Cx3cr1 Cxcl Cxcl1 Cxcl11 Cxcl1 Cxcl13 Cxcl15 Cxcl Pf Cxcl5 Ppbp Cxcl9 Cxcr3 Cxcr Cxcr6 Tymp Gdf5 Ccr1 Gpr81 Hif1a Il13 Il16 Il18 Il1a Il Il8ra Il8rb Inha Inhbb Lif Ltbr Mmp Myd88 Nfkb1 Rgs3 Slit Tlr Tnf Tnfrsf1a Tnfsf1 Trem1 Xcl1 Gusb Hprt1 Hsp9ab1 Gapdh Actb MGDC Relative mrna level (Klf5 fl/fl /CD-Klf5KO) Relative mrna level (Klf5 fl/fl /CD-Klf5KO) PCOLC BMPA BMP3 Aplnr Bdnf Cxcr5 Bmp1 Bmp15 Bmp6 Ccbp Ccl1 Ccl11 Ccl1 Ccl17 Ccl19 Ccl Ccl Ccl Ccl5 Ccl6 Ccl7 Ccl8 Ccl9 Ccr1 Ccr1l1 Ccr Ccr3 Ccr Ccr5 Ccr6 Ccr7 Ccr8 Ccr9 Ccrl1 Ccrl Cmtma Cmtm3 Cmtm Cmtm5 Cmtm6 Cmklr1 Cxcr7 Csf1 Csf Cx3cl1 Cx3cr1 Cxcl Cxcl1 Cxcl11 Cxcl1 Cxcl13 Cxcl15 Cxcl Pf Cxcl5 Ppbp Cxcl9 Cxcr3 Cxcr Cxcr6 Tymp Gdf5 Ccr1 Gpr81 Hif1a Il13 Il16 Il18 Il1a Il Il8ra Il8rb Inha Inhbb Lif Ltbr Mmp Myd88 Nfkb1 Rgs3 Slit Tlr Tnf Tnfrsf1a Tnfsf1 Trem1 Xcl1 Gusb Hprt1 Hsp9ab1 Gapdh Actb MGDC a b Supplementary Figure Nature Medicine doi:1.138/nm.36
46 a b (pg/ml) 1 1 Serum CSF level h after injection 5 µg µg %Dead cells Vehicle CSF c LVDd (mm) LVDs (mm) AWT (mm) 1.5 PWT (mm) 1.5 LV mass (mg) 1 Klf5 fl/fl CD-Klf5KO CSF + + CSF + + CSF + + CSF + + CSF + + d Cross-sectional area (µm ) CSF + + Klf5 fl/fl CD-Klf5KO Supplementary Figure 1 Nature Medicine doi:1.138/nm.36
47 a Cross-sectional area (µm ) TAC anticsf b %Fibrosis area 1 5 TAC anticsf c Relative Areg expression 3 1 TAC anticsf Supplementary Figure Nature Medicine doi:1.138/nm.36
48 (%) 1 (%) Vehicle CSF Heart Ly6C lo Heart Ly6C hi Kidney Ly6C lo Liver Kupffer Microglia Supplementary Figure 3 Nature Medicine doi:1.138/nm.36
49 Klf5 fl/fl CD-Klf5KO Klf5 fl/fl +TAC CD-Klf5KO+TAC Lung Brain Heart Liver Spleen Intestine Sk. muscle Kidney Fat Supplementary Figure Nature Medicine doi:1.138/nm.36
50 a b CSF concentration (pg/ml) $ $ 6h h Klf5 fl/fl CD-Klf5KO CSF concentration (pg/ml) 1 Left ventricle Renal vein Inferior vena cava 1 1 h after TAC Klf5 fl/fl CD-Klf5KO c d e Relative Csf transcript level 3 1 Non-ECs Cortex Outer medulla Inner medulla TAC (%) 5 Fraction in live cells CD EC CSF concentration (pg/ml) 5 TAC CD TAC EC ECs f 1.5 Relative Csf level 1.5 Cells in insert TAC Supplementary Figure 5 Nature Medicine doi:1.138/nm.36
51 a b Group Nx TAC Nx+TAC Nephrectomy + + TAC Serum CSF (pg/ml) 5 Ly6C lo macrophage (%) 6 Ly6C hi macrophage (%).. Nx TAC Nx+TAC Nx TAC Nx+TAC Nx TAC Nx+TAC Supplementary Figure 6 Nature Medicine doi:1.138/nm.36


 1 5 TAC Control sirna Csf sirna e")
.6.")
 1.5 PWT (mm) 1.")
 TAC Control sirna Csf sirna h %Survival 1 5 Control")
52 a Cy5-siRNA CD31 b Magnet - Nucleus Cy5-siRNA Merge CD31 Relative Csf level Contriol sirna + Csf sirna + Contriol sirna +TAC Csf sirna + TAC Magnet + Nucleus Merge Renal ECs Renal CD cells Renal Hepatic Pulmonary Cardiac non-ecs ECs ECs ECs Splenic ECs Whole spleen Bone marrow c Control sirna Csf sirna TAC TAC CSF TUBA1 d Serum CSF (pg/ml) 1 5 TAC Control sirna Csf sirna e Ly6C lo macrophage (%) 8 6 TAC Ly6C hi monocyte/macrophage (%).6.. Control sirna Csf sirna TAC f LVEF (%) 8 LVDd (mm) LVDs (mm) AWT (mm) 1.5 PWT (mm) 1.5 Control sirna Csf sirna TAC TAC TAC TAC TAC g Cross-sectional area (µm ) TAC Control sirna Csf sirna h %Survival 1 5 Control sirna+ Csf sirna+ Control sirna+tac Csf sirna+tac 6 Time (days) Supplementary Figure 7 Nature Medicine doi:1.138/nm.36
53 a Relative Klf5 expression Relative S1a8 expression 8 6 Relative S1a9 expression h after TAC b KLF5 h after TAC S1A8 S1A9 TUBA1 c (%) 6 CD11b + F/8 hi Ly6C lo (%) 6 CD11b + F/8 lo Ly6C hi H H6 H1 H D7 D1 H H6 H1 H D7 D1 d Relative Csf expression h after TAC e CSF TUBA1 6 h after TAC Supplementary Figure 8 Nature Medicine doi:1.138/nm.36
54 a b Relative Tnf level 1 5 Control S1 LPS TNF TUBA1 Control S1 LPS c Relative transcript level 1 5 Cell in insert anti-tnfα Csf in ECs None -MΦ TAC-MΦ (pg/ml) 1 5 CSF in media None -MΦ TAC-MΦ Supplementary Figure 9 Nature Medicine doi:1.138/nm.36
55 a Plasma norepinephrine concentration (pg/ml) 8 6 RSNA TAC + + b (ng/ml) Urine norepinephrine concentration Days after TAC RSNA c (ng/ml) Urine norepinephrine concentration 8 6 Klf5 fl/fl CD-Klf5KO 1 3 Days after TAC Supplementary Figure 3 Nature Medicine doi:1.138/nm.36
56 a b c CSF in medium (pg/ml) RSNA TAC RSNA+TAC Cross-sectional area (µm ) RSNA TAC RSNA+TAC %Fibrosis area 6 RSNA TAC RSNA+TAC Group RSNA TAC RSNA+TAC RSNA + + TAC + + Supplementary Figure 31 Nature Medicine doi:1.138/nm.36
57 Relative Csf level 1 5 TAC Capsaisin SDR Supplementary Figure 3 Nature Medicine doi:1.138/nm.36
58 a Serum CSF (pg/ml) Group MI RSNA RSNA+MI MI + + TAC + + b MI RSNA RSNA+MI MI RSNA RSNA+MI MI RSNA RSNA+MI Day Day 1 Day 7 Serum CSF (pg/ml) Day Day 1 Day 7 Klf5 fl/fl CD-Klf5KO Supplementary Figure 33 Nature Medicine doi:1.138/nm.36
59 a Relative transcript level 6 Klf5 S1a8 S1a9 1 5 Pre h h Pre h h Pre h h 1 5 Control ISP b KLF5 Ctrl ISP S1A8 S1A9 β-tublin c KLF5 Klf5 fl/fl CD-Klf5KO 6 6 TNF Klf5 fl/fl CD-Klf5KO 6 6 CSF Klf5 fl/fl CD-Klf5KO 6 6 h after ISP injection S1A8 TUBA1 TUBA1 S1A9 TUBA1 Supplementary Figure 3 Nature Medicine doi:1.138/nm.36
60 a Plasma renin activity (mgai/ml/h) Days after TAC Klf5 fl/fl CD-Klf5KO b Plasma renin activity (mgai/ml/h) Days after TAC RSNA Supplementary Figure 35 Nature Medicine doi:1.138/nm.36
61 a Plasma AVP concentration (pg/ml) 1 5 Klf5 fl/fl 7 3 Days after TAC CD-Klf5KO b Plasma AVP concentration (pg/ml) 1 5 RSNA 7 3 Days after TAC c Plasma AVP concentration (pg/ml) Days after TAC Control IgG anti-csf Supplementary Figure 36 Nature Medicine doi:1.138/nm.36
62 %Floxed-out alles/total alleles 5 1 Brain Thalamus Heart Cardiac fibroblast Lung Liver Spleen Aorta Small intestine Renal CD(AQP + ) cells Renal AQP - cells White adipose tissue Bladder Skletal muscle Klf5 fl/fl Bone marrow Cardiac Ly6C lo macrophage (steady state) CD-Klf5KO Cardiac Ly6C lo macrophage (TAC day 8) Renal Ly6C lo macrophage (steady state) Renal Ly6C lo macrophage (TAC day 8) Supplementary Figure 37 Nature Medicine doi:1.138/nm.36


63 Supplementary Fig. 7c Control sirna Csf sirna TAC TAC Supplementary Fig. 8b h after TAC 15kD CSF 5kD KLF5 Control sirna Csf sirna TAC TAC h after TAC 5kD TUBA1 15kD S1A8 h after TAC 15kD S1A9 h after TAC 5kD TUBA1 Supplementary Figure 38 Nature Medicine doi:1.138/nm.36


64 Supplementary Fig. 8e Supplementary Fig. 9b 6 h after TAC Control S1 LPS 15kD CSF 15kD TNF 6 h after TAC Control S1 LPS 5kD TUBA1 5kD TUBA1 Supplementary Figure 39 Nature Medicine doi:1.138/nm.36
65 Supplementary Fig. 33b Ctrl ISP Ctrl ISP Ctrl ISP 5kD β-tublin 5kD KLF5 15kD S1A8 15kD S1A9 Supplementary Figure Nature Medicine doi:1.138/nm.36


66 Supplementary Fig. 33c Klf5 fl/fl CD-Klf5KO 6 6 h after ISP injection Klf5 fl/fl CD-Klf5KO 6 6 h after ISP injection 5kD KLF5 15kD TNF Klf5 fl/fl CD-Klf5KO Klf5 fl/fl CD-Klf5KO 6 6 h after ISP injection 6 6 h after ISP injection 5kD TUBA1 15kD S1A8 Klf5 fl/fl CD-Klf5KO 6 6 h after ISP injection Klf5 fl/fl CD-Klf5KO 6 6 h after ISP injection 15kD CSF 15kD S1A9 Klf5 fl/fl CD-Klf5KO 6 6 h after ISP injection Klf5 fl/fl CD-Klf5KO 6 6 h after ISP injection 5kD TUBA1 5kD TUBA1 Nature Medicine doi:1.138/nm.36 Supplementary Figure 1
67 Supplementary Table 1 Hemodynamics after TAC Pre-TAC Post-TAC day 7 Klf5 fl/fl CD-Klf5KO Klf5 fl/fl CD-Klf5KO HR (bpm) 57±5. 58±.7 NS 656±3.7* 66±33.5* NS LVSP (mmhg) 18.8± ±9. NS 131.±1.* 136.5±8.* NS LVEDP (mmhg) 3.±1.5.±1.6 NS 3.1±5.* 3.1±.8* NS AoSP (mmhg) 13.6±5.3 1.±5.3 NS 13.6±7.5* 135.1±6.* NS AoDP (mmhg) 71.8±.6 7.8±3.1 NS 78.9±3.6* 79.6±3.* NS Carotid SP (mmhg) 19.9± ±5.3 NS 96.3± ±8.6 NS HR, heart rate. LVSP, left ventricular systolic pressure. LVEDP, left ventricular end-diastolic pressure. AoSP, aortic systolic pressure at ascending aorta prior to the ligation site. AoDP, aortic diastolic pressure. Carotid SP, systolic pressure in the left carotid artery distal of the ligation site. Values are means ± S.D. NS, no statistical difference between Klf5 fl/fl vs. CD-Klf5KO at the same time. *P<.5 vs. pre -TAC of the same genotype. Nature Medicine doi:1.138/nm.36
68 Supplementary Table Renal blood flow after TAC in CD-Klf5KO mice (ml/min) Pre-TAC Post-TAC day3 Post -TAC day7 Klf5 fl/fl CD-Klf5KO Klf5 fl/fl CD-Klf5KO Klf5 fl/fl CD-Klf5KO.83±.13.8±.1 NS.76±.1.78±.16 NS.81±.17.79±.16 NS Values are means ± S.D. NS, no statistical difference between Klf5 fl/fl vs. CD-Klf5KO at the same time. Nature Medicine doi:1.138/nm.36
69 Supplementary Table 3 nerve-ablated mice (ml/min) Renal blood flow after TAC in renal sympathetic Pre-TAC Post-TAC day3 Post-TAC day7 RSNA RSNA RSNA.8±.16.8±.15 NS.73±.11.7±.13 NS.8±.18.85±.13 NS Values are means ± S.D. NS, no statistical difference between vs. RSNA at the same time. Nature Medicine doi:1.138/nm.36
Supplementary information. The proton-sensing G protein-coupled receptor T-cell death-associated gene 8
 1 Supplementary information 2 3 The proton-sensing G protein-coupled receptor T-cell death-associated gene 8 4 (TDAG8) shows cardioprotective effects against myocardial infarction 5 Akiomi Nagasaka 1+,
In vivo bromodeoxyuridine (BrdU) incorporation was performed to analyze cell
 incorporation was performed to analyze cell") Supplementary Methods BrdU incorporation in vivo In vivo bromodeoxyuridine (BrdU) incorporation was performed to analyze cell proliferation in the heart. Mice were subjected to LI-TAC, and 5 days later
Supplementary Methods BrdU incorporation in vivo In vivo bromodeoxyuridine (BrdU) incorporation was performed to analyze cell proliferation in the heart. Mice were subjected to LI-TAC, and 5 days later
c Ischemia (30 min) Reperfusion (8 w) Supplementary Figure bp 300 bp Ischemia (30 min) Reperfusion (4 h) Dox 20 mg/kg i.p.
 Reperfusion (8 w) Supplementary Figure bp 300 bp Ischemia (30 min) Reperfusion (4 h) Dox 20 mg/kg i.p.") a Marker Ripk3 +/ 5 bp 3 bp b Ischemia (3 min) Reperfusion (4 h) d 2 mg/kg i.p. 1 w 5 w Sacrifice for IF size A subset for echocardiography and morphological analysis c Ischemia (3 min) Reperfusion (8
a Marker Ripk3 +/ 5 bp 3 bp b Ischemia (3 min) Reperfusion (4 h) d 2 mg/kg i.p. 1 w 5 w Sacrifice for IF size A subset for echocardiography and morphological analysis c Ischemia (3 min) Reperfusion (8
Postn MCM Smad2 fl/fl Postn MCM Smad3 fl/fl Postn MCM Smad2/3 fl/fl. Postn MCM. Tgfbr1/2 fl/fl TAC
 A Smad2 fl/fl Smad3 fl/fl Smad2/3 fl/fl Tgfbr1/2 fl/fl 1. mm B Tcf21 MCM Tcf21 MCM Smad3 fl/fl Tcf21 MCM Smad2/3 fl/fl Tcf21 MCM Tgfbr1/2 fl/fl αmhc MCM C 1. mm 1. mm D Smad2 fl/fl Smad3 fl/fl Smad2/3
Supplementary Figure 1. Dynamic Response of WT and mir-21 -/- mice to caerulein. (a) Representative histological sections of mouse pancreas stained
 Representative histological sections of mouse pancreas stained") Supplementary Figure 1. Dynamic Response of WT and mir-21 -/- mice to caerulein. (a) Representative histological sections of mouse pancreas stained with hematoxylin from caerulein-treated WT and mir-21
Supplementary Figure 1. Dynamic Response of WT and mir-21 -/- mice to caerulein. (a) Representative histological sections of mouse pancreas stained with hematoxylin from caerulein-treated WT and mir-21
Comparison of in vitro transfection efficiency of HBV plasmids between genotypes HBV expressing plasmids (5
 Supplemental Materials Figures legend Supplemental Table 1, 2 and 3 Supplemental Figure 1, Figure 2 and Figure 3 Supplemental Figure 1 Comparison of in vitro transfection efficiency of HBV plasmids between
Supplementary Figure 1. mrna expression of chitinase and chitinase-like protein in splenic immune cells. Each splenic immune cell population was
 Supplementary Figure 1. mrna expression of chitinase and chitinase-like protein in splenic immune cells. Each splenic immune cell population was sorted by FACS. Surface markers for sorting were CD11c +
% of live splenocytes. STAT5 deletion. (open shapes) % ROSA + % floxed
 % ROSA + % floxed") Supp. Figure 1. a 14 1 1 8 6 spleen cells (x1 6 ) 16 % of live splenocytes 5 4 3 1 % of live splenocytes 8 6 4 b 1 1 c % of CD11c + splenocytes (closed shapes) 8 6 4 8 6 4 % ROSA + (open shapes) % floxed
Supp. Figure 1. a 14 1 1 8 6 spleen cells (x1 6 ) 16 % of live splenocytes 5 4 3 1 % of live splenocytes 8 6 4 b 1 1 c % of CD11c + splenocytes (closed shapes) 8 6 4 8 6 4 % ROSA + (open shapes) % floxed
SUPPLEMENTARY METHODS
 SUPPLEMENTARY METHODS Histological analysis. Colonic tissues were collected from 5 parts of the middle colon on day 7 after the start of DSS treatment, and then were cut into segments, fixed with 4% paraformaldehyde,
Supplemental Figure 1. Western blot analysis indicated that MIF was detected in the fractions of
 Supplemental Figure Legends Supplemental Figure 1. Western blot analysis indicated that was detected in the fractions of plasma membrane and cytosol but not in nuclear fraction isolated from Pkd1 null
Nature Immunology: doi: /ni Supplementary Figure 1. Cellularity of leukocytes and their progenitors in naive wild-type and Spp1 / mice.
 Supplementary Figure 1 Cellularity of leukocytes and their progenitors in naive wild-type and Spp1 / mice. (a, b) Gating strategies for differentiated cells including PMN (CD11b + Ly6G hi and CD11b + Ly6G
Supplemental Table 1. Primer sequences for transcript analysis
 Supplemental Table 1. Primer sequences for transcript analysis Primer Sequence (5 3 ) Primer Sequence (5 3 ) Mmp2 Forward CCCGTGTGGCCCTC Mmp15 Forward CGGGGCTGGCT Reverse GCTCTCCCGGTTTC Reverse CCTGGTGTGCCTGCTC
E10.5 E18.5 P2 10w 83w NF1 HF1. Sham ISO. Bmi1. H3K9me3. Lung weight (g)
") Myociyte cross-sectional Relative mrna levels Relative levels Relative mrna levels Supplementary Figures and Legends a 8 6 4 2 Ezh2 E1.5 E18.5 P2 1w 83w b Ezh2 p16 amhc b-actin P2 43w kd 37 86 16 wt mouse
Myociyte cross-sectional Relative mrna levels Relative levels Relative mrna levels Supplementary Figures and Legends a 8 6 4 2 Ezh2 E1.5 E18.5 P2 1w 83w b Ezh2 p16 amhc b-actin P2 43w kd 37 86 16 wt mouse
Bezzi et al., Supplementary Figure 1 *** Nature Medicine: doi: /nm Pten pc-/- ;Zbtb7a pc-/- Pten pc-/- ;Pml pc-/- Pten pc-/- ;Trp53 pc-/-
 Gr-1 Gr-1 Gr-1 Bezzi et al., Supplementary Figure 1 a Gr1-CD11b 3 months Spleen T cells 3 months Spleen B cells 3 months Spleen Macrophages 3 months Spleen 15 4 8 6 c CD11b+/Gr1+ cells [%] 1 5 b T cells
well for 2 h at rt. Each dot represents an individual mouse and bar is the mean ±
 Supplementary data: Control DC Blimp-1 ko DC 8 6 4 2-2 IL-1β p=.5 medium 8 6 4 2 IL-2 Medium p=.16 8 6 4 2 IL-6 medium p=.3 5 4 3 2 1-1 medium IL-1 n.s. 25 2 15 1 5 IL-12(p7) p=.15 5 IFNγ p=.65 4 3 2 1
BNP mrna expression in DR and DS rat left ventricles (n = 5). (C) Plasma norepinephrine
. (C) Plasma norepinephrine") Kanazawa, et al. Supplementary figure legends Supplementary Figure 1 DS rats had congestive heart failure. (A) DR and DS rat hearts. (B) QRT-PCR analysis of BNP mrna expression in DR and DS rat left ventricles
Kanazawa, et al. Supplementary figure legends Supplementary Figure 1 DS rats had congestive heart failure. (A) DR and DS rat hearts. (B) QRT-PCR analysis of BNP mrna expression in DR and DS rat left ventricles
Tcf21 MCM ; R26 mtmg Sham GFP Col 1/3 TAC 8W TAC 2W. Postn MCM ; R26 mtmg Sham GFP Col 1/3 TAC 8W TAC 2W
 A Tcf21 MCM ; R26 mtmg Sham GFP Col 1/3 Tcf21 MCM ; R26 mtmg TAC 2W Tcf21 MCM ; R26 mtmg TAC 8W B Postn MCM ; R26 mtmg Sham GFP Col 1/3 Postn MCM ; R26 mtmg TAC 2W Postn MCM ; R26 mtmg TAC 8W Supplementary
Supplementary Figure 1: TSLP receptor skin expression in dcssc. A: Healthy control (HC) skin with TSLP receptor expression in brown (10x
 skin with TSLP receptor expression in brown (10x") Supplementary Figure 1: TSLP receptor skin expression in dcssc. A: Healthy control (HC) skin with TSLP receptor expression in brown (10x magnification). B: Second HC skin stained for TSLP receptor in brown
Supplementary Figure 1: TSLP receptor skin expression in dcssc. A: Healthy control (HC) skin with TSLP receptor expression in brown (10x magnification). B: Second HC skin stained for TSLP receptor in brown
Supplementary Figures for TSC1 controls macrophage polarization to prevent inflammatory disorder by Linnan Zhu et al
 Supplementary Figures for TSC1 controls macrophage polarization to prevent inflammatory disorder by Linnan Zhu et al Suppl. Fig. 1 Tissue DN C Proteins kd TSC1-17 TSC 1 loxp bp -48-285 ctin PEMs Neutrophils
Supplementary Figure 1 Chemokine and chemokine receptor expression during muscle regeneration (a) Analysis of CR3CR1 mrna expression by real time-pcr
 Analysis of CR3CR1 mrna expression by real time-pcr") Supplementary Figure 1 Chemokine and chemokine receptor expression during muscle regeneration (a) Analysis of CR3CR1 mrna expression by real time-pcr at day 0, 1, 4, 10 and 21 post- muscle injury. (b)
Supplementary Figure 1 Chemokine and chemokine receptor expression during muscle regeneration (a) Analysis of CR3CR1 mrna expression by real time-pcr at day 0, 1, 4, 10 and 21 post- muscle injury. (b)
An epithelial circadian clock controls pulmonary inflammation and glucocorticoid action
 An epithelial circadian clock controls pulmonary inflammation and glucocorticoid action Supplementary Figure : Expression levels of toll-like receptor 4 (Tlr4) in muse lung does not change throughout the
Kidney. Heart. Lung. Sirt1. Gapdh. Mouse IgG DAPI. Rabbit IgG DAPI
 a e Na V 1.5 Ad-LacZ Ad- 110KD b Scn5a/ (relative to Ad-LacZ) f 150 100 50 0 p = 0.65 Ad-LacZ Ad- c Heart Lung Kidney Spleen 110KD d fl/fl c -/- DAPI 20 µm Na v 1.5 250KD fl/fl Rabbit IgG DAPI fl/fl Mouse
Supplementary Information. Tissue-wide immunity against Leishmania. through collective production of nitric oxide
 Supplementary Information Tissue-wide immunity against Leishmania through collective production of nitric oxide Romain Olekhnovitch, Bernhard Ryffel, Andreas J. Müller and Philippe Bousso Supplementary
SUPPLEMENTARY INFORMATION
 doi:10.1038/nature10188 Supplementary Figure 1. Embryonic epicardial genes are down-regulated from midgestation stages and barely detectable post-natally. Real time qrt-pcr revealed a significant down-regulation
Supplemental Figure I
 Supplemental Figure I Kl ( mmol/l)-induced Force orta M (mn) 1 (mn) 1 Supplemental Figure I. Kl-induced contractions. and, Kl ( mmol/l)-induced contractions of the aorta () and those of mesenteric arteries
X P. Supplementary Figure 1. Nature Medicine: doi: /nm Nilotinib LSK LT-HSC. Cytoplasm. Cytoplasm. Nucleus. Nucleus
 a b c Supplementary Figure 1 c-kit-apc-eflu780 Lin-FITC Flt3-Linc-Kit-APC-eflu780 LSK Sca-1-PE-Cy7 d e f CD48-APC LT-HSC CD150-PerCP-cy5.5 g h i j Cytoplasm RCC1 X Exp 5 mir 126 SPRED1 SPRED1 RAN P SPRED1
activation with anti-cd3/cd28 beads and 3d following transduction. Supplemental Figure 2 shows
 Supplemental Data Supplemental Figure 1 compares CXCR4 expression in untreated CD8 + T cells, following activation with anti-cd3/cd28 beads and 3d following transduction. Supplemental Figure 2 shows the
Alternatively Activated Macrophages Determine the Repair of the Infarcted
 Alternatively Activated Macrophages Determine the Repair of the Infarcted Adult Murine Heart (Shiraishi et al.) List of Supplemental Materials Supplemental Methods Supplemental Figure 1. Cardiac CD206
Title of file for HTML: Supplementary Information Description: Supplementary Figures and Supplementary Table
 Title of file for HTML: Supplementary Information Description: Supplementary Figures and Supplementary Table Title of file for HTML: Peer Review File Description: Innate Scavenger Receptor-A regulates
Pearson r = P (one-tailed) = n = 9
 = n = 9") 8F4-Specific Lysis, % 1 UPN1 UPN3 8 UPN7 6 Pearson r =.69 UPN2 UPN5 P (one-tailed) =.192 4 UPN8 n = 9 2 UPN9 UPN4 UPN6 5 1 15 2 25 8 8F4, % Max MFI Supplementary Figure S1. AML samples UPN1-UPN9 show variable
8F4-Specific Lysis, % 1 UPN1 UPN3 8 UPN7 6 Pearson r =.69 UPN2 UPN5 P (one-tailed) =.192 4 UPN8 n = 9 2 UPN9 UPN4 UPN6 5 1 15 2 25 8 8F4, % Max MFI Supplementary Figure S1. AML samples UPN1-UPN9 show variable
The encephalitogenicity of TH17 cells is dependent on IL-1- and IL-23- induced production of the cytokine GM-CSF
 CORRECTION NOTICE Nat.Immunol. 12, 568 575 (2011) The encephalitogenicity of TH17 cells is dependent on IL-1- and IL-23- induced production of the cytokine GM-CSF Mohamed El-Behi, Bogoljub Ciric, Hong
Chronic variable stress activates hematopoietic stem cells
 SUPPLEMENTARY INFORMATION Chronic variable stress activates hematopoietic stem cells Timo Heidt *, Hendrik B. Sager *, Gabriel Courties, Partha Dutta, Yoshiko Iwamoto, Alex Zaltsman, Constantin von zur
B lymphocytes trigger monocyte mobilization and impair heart function after acute myocardial infarction
 Supplementary Figures to 3 B lymphocytes trigger monocyte moilization and impair heart function after acute myocardial infarction Yasmine Zouggari, Hafid Ait-Oufella, Philippe Bonnin, Taassome Simon, Andrew
Supplementary Figure 1. Deletion of Smad3 prevents B16F10 melanoma invasion and metastasis in a mouse s.c. tumor model.
 A B16F1 s.c. Lung LN Distant lymph nodes Colon B B16F1 s.c. Supplementary Figure 1. Deletion of Smad3 prevents B16F1 melanoma invasion and metastasis in a mouse s.c. tumor model. Highly invasive growth
hemodynamic stress. A. Echocardiographic quantification of cardiac dimensions and function in
 SUPPLEMENTAL FIGURE LEGENDS Supplemental Figure 1. Fbn1 C1039G/+ hearts display normal cardiac function in the absence of hemodynamic stress. A. Echocardiographic quantification of cardiac dimensions and
Serum cytokine levels in control and tumor-bearing male and female mice at day 15.
 Supplementary Table 1. Serum cytokine levels in control and tumor-bearing male and female mice at day 15. Male Female Cytokine Control C-26 Control C-26 IL-1β 2.0 ± 0.8 9.6 ± 1.5* 1.8 ± 0.2 6.8 ± 1.4*
Suppl Video: Tumor cells (green) and monocytes (white) are seeded on a confluent endothelial
 and monocytes (white) are seeded on a confluent endothelial") Supplementary Information Häuselmann et al. Monocyte induction of E-selectin-mediated endothelial activation releases VE-cadherin junctions to promote tumor cell extravasation in the metastasis cascade
Supplementary Information Häuselmann et al. Monocyte induction of E-selectin-mediated endothelial activation releases VE-cadherin junctions to promote tumor cell extravasation in the metastasis cascade
W/T Itgam -/- F4/80 CD115. F4/80 hi CD115 + F4/80 + CD115 +
 F4/8 % in the peritoneal lavage 6 4 2 p=.15 n.s p=.76 CD115 F4/8 hi CD115 + F4/8 + CD115 + F4/8 hi CD115 + F4/8 + CD115 + MHCII MHCII Supplementary Figure S1. CD11b deficiency affects the cellular responses
Urinary system. Lab-7
 Urinary system Lab-7 Excretion: processes that remove wastes and excess materials from the body Urinary system (kidneys): excretes nitrogenous wastes, excess solutes, and water The Kidneys Regulate Water
Supporting Information Table of Contents
 Supporting Information Table of Contents Supporting Information Figure 1 Page 2 Supporting Information Figure 2 Page 4 Supporting Information Figure 3 Page 5 Supporting Information Figure 4 Page 6 Supporting
Page 39 of 44. 8h LTA & AT h PepG & AT h LTA
 Page 39 of 44 Fig. S1 A: B: C: D: 8h LTA 8h LTA & AT7519 E: F: 8h PepG G: 8h PepG & AT7519 Fig. S1. AT7519 overrides the survival effects of lipoteichoic acid (LTA) and peptidoglycan (PepG). (A) Human
Supplementary Figure 1. Characterization of basophils after reconstitution of SCID mice
 Supplementary figure legends Supplementary Figure 1. Characterization of after reconstitution of SCID mice with CD4 + CD62L + T cells. (A-C) SCID mice (n = 6 / group) were reconstituted with 2 x 1 6 CD4
Figure S1 Generation of γ-gt DTR transgenic mice. (A) Schematic construct of the transgene. (B)
 Schematic construct of the transgene. (B)") Figure S1 Generation of γ-gt DTR transgenic mice. (A) Schematic construct of the transgene. (B) PCR identified expected hhb-egf band (left panel) and HA tag band (right) in kidneys of transgenic (TG) mice
Figure S1 Generation of γ-gt DTR transgenic mice. (A) Schematic construct of the transgene. (B) PCR identified expected hhb-egf band (left panel) and HA tag band (right) in kidneys of transgenic (TG) mice
Supplementary Figure 1. Expression of CUGBP1 in non-parenchymal liver cells treated with TGF-β
 Supplementary Figures Supplementary Figure 1. Expression of CUGBP1 in non-parenchymal liver cells treated with TGF-β and LPS. Non-parenchymal liver cells were isolated and treated with or without TGF-β
Supplementary Fig. 1 p38 MAPK negatively regulates DC differentiation. (a) Western blot analysis of p38 isoform expression in BM cells, immature DCs
 Western blot analysis of p38 isoform expression in BM cells, immature DCs") Supplementary Fig. 1 p38 MAPK negatively regulates DC differentiation. (a) Western blot analysis of p38 isoform expression in BM cells, immature DCs (idcs) and mature DCs (mdcs). A myeloma cell line expressing
Supplementary Fig. 1 p38 MAPK negatively regulates DC differentiation. (a) Western blot analysis of p38 isoform expression in BM cells, immature DCs (idcs) and mature DCs (mdcs). A myeloma cell line expressing
Supplementary material page 1/10
 Supplementary Figure 1. Metoprolol administration during ongoing AMI reduces MVO in STEMI patients (a, b) Complete representative CMR exams (short-axis covering the entire left ventricle (LV) from base
Quantitative PPARγ expression affects the balance between tolerance and immunity
 Quantitative PPARγ expression affects the balance between tolerance and immunity Ya-Hui Liu 1, Yau-Sheng Tsai 1,2,3, Shih-Chieh Lin 4, Nan-Shih Liao 5, Ming-Shiou Jan 6, Chung-Tiang Liang 7, Shih-Wen Hsu
Supplementary Figures
 Supplementary Figures Supplementary Fig. 1. Galectin-3 is present within tumors. (A) mrna expression levels of Lgals3 (galectin-3) and Lgals8 (galectin-8) in the four classes of cell lines as determined
Supplementary Figure 1. Antibiotic partially rescues mice from sepsis. (ab) BALB/c mice under CLP were treated with antibiotic or PBS.
 BALB/c mice under CLP were treated with antibiotic or PBS.") 1 Supplementary Figure 1. Antibiotic partially rescues mice from sepsis. (ab) BALB/c mice under CLP were treated with antibiotic or PBS. (a) Survival curves. WT Sham (n=5), WT CLP or WT CLP antibiotic
1 Supplementary Figure 1. Antibiotic partially rescues mice from sepsis. (ab) BALB/c mice under CLP were treated with antibiotic or PBS. (a) Survival curves. WT Sham (n=5), WT CLP or WT CLP antibiotic
Nature Immunology: doi: /ni.3412
 Supplementary Figure 1 Gata1 expression in heamatopoietic stem and progenitor populations. (a) Unsupervised clustering according to 100 top variable genes across single pre-gm cells. The two main cell
SUPPLEMENTARY INFORMATION
 1. Supplementary Figures and Legends Supplementary Fig. 1. S1P-mediated transcriptional regulation of integrins expressed in OP/monocytoid cells. Real-time quantitative PCR analyses of mrna for two integrins,
Probe. Hind III Q,!?R'!! /0!!!!D1"?R'! vector. Homologous recombination
 Supple-Zhang Page 1 Wild-type locus Targeting construct Targeted allele Exon Exon3 Exon Probe P1 P P3 FRT FRT loxp loxp neo vector amh I Homologous recombination neo P1 P P3 FLPe recombination Q,!?R'!!
Supplementary Figure 1
 Supplementary Figure 1 Genetic labeling of microglia Male and female 2-3 month-old CreERT2;R26-tdTomato mice or CreERT2;R26-tdTomato;Iba1-eGFP transgenic mice were treated with 1x, 2x (48 h apart), or
Figure S1 Genetic or pharmacologic COX-2 inhibition led to increased kidney
 SUPPLEMENTAL FIGURE LEGENDS Figure S1 Genetic or pharmacologic COX-2 inhibition led to increased kidney macrophage infiltration. Wild type or COX-2 -/- mice (2 months old, C57/Bl6 background) were treated
To compare the relative amount of of selected gene expression between sham and
 Supplementary Materials and Methods Gene Expression Analysis To compare the relative amount of of selected gene expression between sham and mice given renal ischemia-reperfusion injury (IRI), ncounter
SUPPLEMENTARY INFORMATION
 doi: 1.138/nature89 IFN- (ng ml ) 5 4 3 1 Splenocytes NS IFN- (ng ml ) 6 4 Lymph node cells NS Nfkbiz / Nfkbiz / Nfkbiz / Nfkbiz / IL- (ng ml ) 3 1 Splenocytes IL- (ng ml ) 1 8 6 4 *** ** Lymph node cells
Supplementary Material
 Supplementary Material Induction of myocardial infarction Mice were anesthetized by intraperitoneal injection of pentobarbital (7 mg/kg). In the supine position, endotracheal intubation was performed.
SUPPLEMENTARY MATERIALS. IL-4 as a Repurposed Biological Drug for Myocardial Infarction through. Augmentation of Reparative Cardiac Macrophages:
 1 SUPPLEMENTARY MATERIALS IL-4 as a Repurposed Biological Drug for Myocardial Infarction through Augmentation of Reparative Cardiac Macrophages: Proof-of-Concept Data in Mice Yusuke Shintani MD PhD, Tomoya
Supplemental Information. Aryl Hydrocarbon Receptor Controls. Monocyte Differentiation. into Dendritic Cells versus Macrophages
 Immunity, Volume 47 Supplemental Information Aryl Hydrocarbon Receptor Controls Monocyte Differentiation into Dendritic Cells versus Macrophages Christel Goudot, Alice Coillard, Alexandra-Chloé Villani,
Supplementary fig. 1. Crystals induce necroptosis does not involve caspases, TNF receptor or NLRP3. A. Mouse tubular epithelial cells were pretreated
 Supplementary fig. 1. Crystals induce necroptosis does not involve caspases, TNF receptor or NLRP3. A. Mouse tubular epithelial cells were pretreated with zvad-fmk (10µM) and exposed to calcium oxalate
Endogenous TNFα orchestrates the trafficking of neutrophils into and within lymphatic vessels during acute inflammation
 SUPPLEMENTARY INFORMATION Endogenous TNFα orchestrates the trafficking of neutrophils into and within lymphatic vessels during acute inflammation Samantha Arokiasamy 1,2, Christian Zakian 1, Jessica Dilliway
As outlined under External contributions (see appendix 7.1), the group of Prof. Gröne at the
, the group of Prof. Gröne at the") 3 RESULTS As outlined under External contributions (see appendix 7.1), the group of Prof. Gröne at the DKFZ in Heidelberg (Dept. of Cellular and Molecular pathology) contributed to this work by performing
3 RESULTS As outlined under External contributions (see appendix 7.1), the group of Prof. Gröne at the DKFZ in Heidelberg (Dept. of Cellular and Molecular pathology) contributed to this work by performing
Nature Medicine: doi: /nm.3922
 Title: Glucocorticoid-induced tumor necrosis factor receptor-related protein co-stimulation facilitates tumor regression by inducing IL-9-producing helper T cells Authors: Il-Kyu Kim, Byung-Seok Kim, Choong-Hyun
Fig. S1 A. week 4 week 6
 Fig. S1 Trabecular Number Trabecular Thickness number/mm 3.5 3. 2.5 2. 1.5 1..5 mm.45.4.35.3.25.2.15.1.5 SKG-c SKG-A mm 1.4 1.2 1..8.6.4.2 Trabecular Spacing D. week 4 week 6 Figure S1. MicroCT analysis
IL-34 is a tissue-restricted ligand of CSF1R required for the development of Langerhans cells and microglia
 Supplementary Figures IL-34 is a tissue-restricted ligand of CSF1R required for the development of Langerhans cells and microglia Yaming Wang, Kristy J. Szretter, William Vermi, Susan Gilfillan, Cristina
Supplemental Figure 1
 Supplemental Figure 1 1a 1c PD-1 MFI fold change 6 5 4 3 2 1 IL-1α IL-2 IL-4 IL-6 IL-1 IL-12 IL-13 IL-15 IL-17 IL-18 IL-21 IL-23 IFN-α Mut Human PD-1 promoter SBE-D 5 -GTCTG- -1.2kb SBE-P -CAGAC- -1.kb
MATERIALS AND METHODS. Neutralizing antibodies specific to mouse Dll1, Dll4, J1 and J2 were prepared as described. 1,2 All
 MATERIALS AND METHODS Antibodies (Abs), flow cytometry analysis and cell lines Neutralizing antibodies specific to mouse Dll1, Dll4, J1 and J2 were prepared as described. 1,2 All other antibodies used
Figure 26.1 An Introduction to the Urinary System
 Chapter 26 Figure 26.1 An Introduction to the Urinary System Components of the Urinary System Kidney Produces urine Ureter Transports urine toward the urinary bladder Urinary Bladder Temporarily stores
Supporting Information
 Supporting Information Desnues et al. 10.1073/pnas.1314121111 SI Materials and Methods Mice. Toll-like receptor (TLR)8 / and TLR9 / mice were generated as described previously (1, 2). TLR9 / mice were
Pathologic Stage. Lymph node Stage
 ASC ASC a c Patient ID BMI Age Gleason score Non-obese PBMC 1 22.1 81 6 (3+3) PBMC 2 21.9 6 6 (3+3) PBMC 3 22 84 8 (4+4) PBMC 4 24.6 68 7 (3+4) PBMC 24. 6 (3+3) PBMC 6 24.7 73 7 (3+4) PBMC 7 23. 67 7 (3+4)
Supplementary Information and Figure legends
 Supplementary Information and Figure legends Table S1. Primers for quantitative RT-PCR Target Sequence (5 -> 3 ) Target Sequence (5 -> 3 ) DAB2IP F:TGGACGATGTGCTCTATGCC R:GGATGGTGATGGTTTGGTAG Snail F:CCTCCCTGTCAGATGAGGAC
Supplementary Figure 1
 Supplementary Figure 1 a Percent of body weight! (%) 4! 3! 1! Epididymal fat Subcutaneous fat Liver SD Percent of body weight! (%) ** 3! 1! SD Percent of body weight! (%) 6! 4! SD ** b Blood glucose (mg/dl)!
Supplementary Figure 1. Generation of knockin mice expressing L-selectinN138G. (a) Schematics of the Sellg allele (top), the targeting vector, the
 Schematics of the Sellg allele (top), the targeting vector, the") Supplementary Figure 1. Generation of knockin mice expressing L-selectinN138G. (a) Schematics of the Sellg allele (top), the targeting vector, the targeted allele in ES cells, and the mutant allele in
Supplementary Figure 1. Generation of knockin mice expressing L-selectinN138G. (a) Schematics of the Sellg allele (top), the targeting vector, the targeted allele in ES cells, and the mutant allele in
Imtiyaz et al., Fig. S1
 . Imtiyaz et al., Fig. S1 1. 1.1 1% O.1.5 Lin/Sca-1/IL-7Rα GMPs.17 MPs.3 Days 3% O.1 MEPs.35 D3 Days 1, N, N, H, H 1 1 Days Supplemental Figure S1. Macrophage maturation, proliferation and survival are
Supplementary Figure 1. Baf60c and baf180 are induced during cardiac regeneration in zebrafish. RNA in situ hybridization was performed on paraffin
 Supplementary Figure 1. Baf60c and baf180 are induced during cardiac regeneration in zebrafish. RNA in situ hybridization was performed on paraffin sections from sham-operated adult hearts (a and i) and
Pretargeting and Bioorthogonal Click Chemistry-Mediated Endogenous Stem Cell Homing for Heart Repair
 Pretargeting and Bioorthogonal Click Chemistry-Mediated Endogenous Stem Cell Homing for Heart Repair Mouse Model of Myocardial Infarction (MI) All animal work was compliant with the Institutional Animal
ANGPTL2 increases bone metastasis of breast cancer cells through. Tetsuro Masuda, Motoyoshi Endo, Yutaka Yamamoto, Haruki Odagiri, Tsuyoshi
 Masuda et al. Supplementary information for ANGPTL2 increases bone metastasis of breast cancer cells through enhancing CXCR4 signaling Tetsuro Masuda, Motoyoshi Endo, Yutaka Yamamoto, Haruki Odagiri, Tsuyoshi
SUPPLEMENTARY FIGURES
 SUPPLEMENTARY FIGURES Supplementary Figure 1: Chemokine receptor expression profiles of CCR6 + and CCR6 - CD4 + IL-17A +/ex and Treg cells. Quantitative PCR analysis of chemokine receptor transcript abundance
CONTROLLING THE INTERNAL ENVIRONMENT
 AP BIOLOGY ANIMAL FORM & FUNCTION ACTIVITY #5 NAME DATE HOUR CONTROLLING THE INTERNAL ENVIRONMENT KIDNEY AND NEPHRON NEPHRON FUNCTIONS Animal Form & Function Activity #5 page 1 NEPHRON STRUCTURE NEPHRON
Nature Neuroscience: doi: /nn Supplementary Figure 1
 Supplementary Figure 1 EGFR inhibition activates signaling pathways (a-b) EGFR inhibition activates signaling pathways (a) U251EGFR cells were treated with erlotinib (1µM) for the indicated times followed
Targeting tumour associated macrophages in anti-cancer therapies. Annamaria Gal Seminar Series on Drug Discovery Budapest 5 January 2018
 Targeting tumour associated macrophages in anti-cancer therapies Annamaria Gal Seminar Series on Drug Discovery Budapest 5 January 2018 Macrophages: Professional phagocytes of the myeloid lineage APC,
Irf1 fold changes (D) 24h 48h. p-p65. t-p65. p-irf3. t-irf3. β-actin SKO TKO 100% 80% 60% 40% 20%
 24h 48h. p-p65. t-p65. p-irf3. t-irf3. β-actin SKO TKO 100% 80% 60% 40% 20%") Irf7 Fold changes 3 1 Irf1 fold changes 3 1 8h h 8h 8h h 8h p-p6 p-p6 t-p6 p-irf3 β-actin p-irf3 t-irf3 β-actin TKO TKO STKO (E) (F) TKO TKO % of p6 nuclear translocation % % 1% 1% % % p6 TKO % of IRF3
Irf7 Fold changes 3 1 Irf1 fold changes 3 1 8h h 8h 8h h 8h p-p6 p-p6 t-p6 p-irf3 β-actin p-irf3 t-irf3 β-actin TKO TKO STKO (E) (F) TKO TKO % of p6 nuclear translocation % % 1% 1% % % p6 TKO % of IRF3
In the name of GOD. Animal models of cardiovascular diseases: myocardial infarction & hypertension
 In the name of GOD Animal models of cardiovascular diseases: myocardial infarction & hypertension 44 Presentation outline: Cardiovascular diseases Acute myocardial infarction Animal models for myocardial
Supplementary Materials for
 www.sciencesignaling.org/cgi/content/full/8/375/ra41/dc1 Supplementary Materials for Actin cytoskeletal remodeling with protrusion formation is essential for heart regeneration in Hippo-deficient mice
Outline Urinary System. Urinary System and Excretion. Urine. Urinary System. I. Function II. Organs of the urinary system
 Outline Urinary System Urinary System and Excretion Bio105 Chapter 16 Renal will be on the Final only. I. Function II. Organs of the urinary system A. Kidneys 1. Function 2. Structure III. Disorders of
SHREE ET AL, SUPPLEMENTAL MATERIALS. (A) Workflow for tumor cell line derivation and orthotopic implantation.
 Workflow for tumor cell line derivation and orthotopic implantation.") SHREE ET AL, SUPPLEMENTAL MATERIALS SUPPLEMENTAL FIGURE AND TABLE LEGENDS Supplemental Figure 1. Derivation and characterization of TS1-TGL and TS2-TGL PyMT cell lines and development of an orthotopic
SHREE ET AL, SUPPLEMENTAL MATERIALS SUPPLEMENTAL FIGURE AND TABLE LEGENDS Supplemental Figure 1. Derivation and characterization of TS1-TGL and TS2-TGL PyMT cell lines and development of an orthotopic
Figure S1. Generation of inducible PTEN deficient mice and the BMMCs (A) B6.129 Pten loxp/loxp mice were mated with B6.
 B6.129 Pten loxp/loxp mice were mated with B6.") Figure S1. Generation of inducible PTEN deficient mice and the BMMCs (A) B6.129 Pten loxp/loxp mice were mated with B6.129-Gt(ROSA)26Sor tm1(cre/ert2)tyj /J mice. To induce deletion of the Pten locus,
Figure S1. Generation of inducible PTEN deficient mice and the BMMCs (A) B6.129 Pten loxp/loxp mice were mated with B6.129-Gt(ROSA)26Sor tm1(cre/ert2)tyj /J mice. To induce deletion of the Pten locus,
SUPPLEMENTARY INFORMATION
 a c e doi:10.1038/nature10407 b d f Supplementary Figure 1. SERCA2a complex analysis. (a) Two-dimensional SDS-PAGE gels of SERCA2a complexes. A silver-stained SDSPAGE gel is shown, which reveals a 12 kda
Supplemental Materials for. Effects of sphingosine-1-phosphate receptor 1 phosphorylation in response to. FTY720 during neuroinflammation
 Supplemental Materials for Effects of sphingosine-1-phosphate receptor 1 phosphorylation in response to FTY7 during neuroinflammation This file includes: Supplemental Table 1. EAE clinical parameters of
Gallic acid prevents isoproterenol-induced cardiac hypertrophy and fibrosis through regulation of JNK2 signaling and Smad3 binding activity
 Gallic acid prevents isoproterenol-induced cardiac hypertrophy and fibrosis through regulation of JNK2 signaling and Smad3 binding activity Yuhee Ryu 1,+, Li Jin 1,2+, Hae Jin Kee 1,, Zhe Hao Piao 3, Jae
") Supplementary Figure 1 (Mu) SBP (mmhg) 2 18 16 p
Supplementary Figure 1 (Mu) SBP (mmhg) 2 18 16 p Supplementary Figure 1
 d f a IL7 b IL GATA RORγt h HDM IL IL7 PBS Ilra R7 PBS HDM Ilra R7 HDM Foxp Foxp Ilra R7 HDM HDM Ilra R7 HDM. 9..79. CD + FOXP + T reg cell CD + FOXP T conv cell PBS Ilra R7 PBS HDM Ilra R7 HDM CD + FOXP
a surface permeabilized
 a surface permeabilized RAW 64.7 P388D1 J774 b CD11b + Ly-6G - Blood Monocytes WT Supplementary Figure 1. Cell surface expression on macrophages and DCs. (a) RAW64.7, P388D1, and J774 cells were subjected
Supplementary Figure 1. Nature Neuroscience: doi: /nn.4547
 Supplementary Figure 1 Characterization of the Microfetti mouse model. (a) Gating strategy for 8-color flow analysis of peripheral Ly-6C + monocytes from Microfetti mice 5-7 days after TAM treatment. Living
Supplementary information CD4 T cells are required for both development and maintenance of disease in a new model of reversible colitis
 Supplementary information CD4 T cells are required for both development and maintenance of disease in a new model of reversible colitis rasseit and Steiner et al. .. Supplementary Figure 1 % of initial
Supplementary Figure 1. IL-12 serum levels and frequency of subsets in FL patients. (A) IL-12
 IL-12") 1 Supplementary Data Figure legends Supplementary Figure 1. IL-12 serum levels and frequency of subsets in FL patients. (A) IL-12 serum levels measured by multiplex ELISA (Luminex) in FL patients before
1 Supplementary Data Figure legends Supplementary Figure 1. IL-12 serum levels and frequency of subsets in FL patients. (A) IL-12 serum levels measured by multiplex ELISA (Luminex) in FL patients before
ONLINE SUPPLEMENT MATERIAL. CD70 limits atherosclerosis and promotes macrophage function.
 ONLINE SUPPLEMENT MATERIAL CD7 limits atherosclerosis and promotes macrophage function. Holger Winkels* 1,2, Svenja Meiler* 1,2, Esther Smeets* 2, Dirk Lievens 1, David Engel 3, Charlotte Spitz 1, Christina
Nephron Structure inside Kidney:
 In-Depth on Kidney Nephron Structure inside Kidney: - Each nephron has two capillary regions in close proximity to the nephron tubule, the first capillary bed for fluid exchange is called the glomerulus,
Introduction. Acute sodium overload produces renal tubulointerstitial inflammation in normal rats
 Acute sodium overload produces renal tubulointerstitial inflammation in normal rats MI Roson, et al. Kidney International (2006) Introduction Present by Kanya Bunnan and Wiraporn paebua Tubular sodium
SOPten flox/flox (KO) Pten flox/flox (WT) flox allele 6.0 kb. Pten. Actin. ! allele 2.3 kb. Supplementary Figure S1. Yanagi, et al.
 Pten flox/flox (WT) flox allele 6.0 kb. Pten. Actin. ! allele 2.3 kb. Supplementary Figure S1. Yanagi, et al.") s1 A Pten flox/flox () SOPten flox/flox () flox allele 6. kb B Pten flox/flox () SOPten flox/flox () Pten Actin! allele 2.3 kb Supplementary Figure S1. Yanagi, et al. A B BrdU BrdU positive cells ( ) 3
s1 A Pten flox/flox () SOPten flox/flox () flox allele 6. kb B Pten flox/flox () SOPten flox/flox () Pten Actin! allele 2.3 kb Supplementary Figure S1. Yanagi, et al. A B BrdU BrdU positive cells ( ) 3