Histone demethylase JMJD1A coordinates acute and chronic adaptation to cold stress via thermogenic phospho-switch. Abe et al.
|
|
|
- Terence Barnett
- 6 years ago
- Views:
Transcription
1 Histone demethylase JMJD1A coordinates acute and chronic adaptation to cold stress via thermogenic phospho-switch Abe et al.
 1 3 7 h allele Targeting vector Targeted allele Ucp1 TCT 7 9 GCA")
 bp 7 Maximum 1 k α-p-jmjd1a KI/+ (pser) NE * ** Cre mediated allele -...gtaaaacgcaagtctgcagagaataacggaagt.")
 Total (%) p BAT mm m 9 BAT mass (mg) 31 Jmjd1a KI ** A A G T C T G C A G A G A A T K3 S A E N7 1 17 Jmjd1a KO XY male XY female XX female q H&E UCP1 Y chromosome Male Female 1 3 NE - NE")
, characterization of immortalized scwat of mice (d-g), and generation of Jmjd1a-SA mice (h-q).")
. Scale bar, 1kb.")
 ChIP-qPCR showing H3K9me levels in BAT of mice exposed to RT or ºC for 1 week (7- week old male, n = ).")
 mrna levels of Ucp1 in im-scwats differentiated with or without rosiglitazone (ROS) treated with or without norepinephrine (NE, 1 µm) were measured by qpcr.")
 Immunoblot analysis of UCP1 and PPARγ in the time course of norepinephrine treatment (NE, 1 µm) in im-scwats differentiated with or without rosiglitazone (ROS).")
 The metabolic profile of im-scwats differentiated with or without rosiglitazone (ROS) was assessed using a Seahorse XF extracellular flax analyzer.")
 Schematic diagram of the targeting strategy of SA mutation. Only the relevant restriction sites are indicated. Locations of the PCR primers (arrows) for genotyping are shown.")
 An ethidium bromide-stained agarose gel illustrates PCR products for genotyping, Jmjd1a-SA KI/+ mice, and Jmjd1a-SA mice.")
 with anti-mjmjd1a followed by immunoblot (IB) analysis with anti-p-jmjd1a (pser).")
 Quantification of XY male, XY female, and XX female (left panel). An ethidium bromide-stained agarose gel illustrates PCR product for identifying sex (right panel).")
2 a BAT 1 kb Ucp1 H3Kme3 H3K7ac (., ) (., ) -13 kb -. kb -. kb b scwat Chronic cold exposure to mice 3 H&E UCP1 c % input H3K9me ChIP, BAT Chronic cold exposure. RT n.s. n.s. n.s. n.s. Actb -13 kb -. kb -. kb TSS d im-scwats ROS - ROS + e Relative expression Ucp1 mrna 3 * 1 NE ROS - ROS + f α-ucp1 μm ROS - ROS + NE 1 1 (h) h allele Targeting vector Targeted allele Ucp1 TCT 7 9 GCA GCA Neo Neo 9 i A A G T C T T C T G A G A A T K3 S S E N7 n ROS- ROS+ g j Body weight (g) OCR (pmoles min -1 per 1 cells) NE response ROS NE- NE+ KI/+ 3 1 P=.7 o O consumption (ml hr -1 ) bp 7 Maximum 1 k α-p-jmjd1a KI/+ (pser) NE * ** Cre mediated allele -...gtaaaacgcaagtctgcagagaataacggaagt...-3 bp PstI bp Point mutation : TCT (Ser) GCA (Ala) lox P exon ** l GCA Genotype Number (%) Jmjd1a 7 (.1%) Jmjd1a KI/+ 9 (.%) Jmjd1a 3 (.1%) Total (%) p BAT mm m 9 BAT mass (mg) 31 Jmjd1a KI ** A A G T C T G C A G A G A A T K3 S A E N Jmjd1a KO XY male XY female XX female q H&E UCP1 Y chromosome Male Female 1 3 NE - NE + Time (min) µm Supplementary Figure 1 Active histone marks on Ucp1 gene enhancers and promoter in BAT (a), histology of scwat beige-ing exposed to chronic cold exposure (b), H3K9me levels on the enhancers/promoter of Ucp1 gene in BAT of mice following chronic cold exposure (c), characterization of immortalized scwat of mice (d-g), and generation of Jmjd1a-SA mice (h-q). (a) ChIP-seq profiles of H3Kme3 and H3K7ac on Ucp1 genomic region in mouse BAT were obtained from ENCODE/LICR histone modification data in the UCSC genome browser (NCBI/mm9 assembly). Light pink shadows highlight the enhancers as we reported previously (Abe et al. ). Scale bar, 1kb. (b) Hematoxylin and eosin (H&E) and UCP1 staining sections of scwats from mice exposed to 3ºC or ºC for 1 week (bar, µm). (c) ChIP-qPCR showing H3K9me levels in BAT of mice exposed to RT or ºC for 1 week (7- week old male, n = ). (d) Oil red O (ORO) staining in im-scwats differentiated with or without rosiglitazone (ROS). (e) mrna levels of Ucp1 in im-scwats differentiated with or without rosiglitazone (ROS) treated with or without norepinephrine (NE, 1 µm) were measured by qpcr. The mrna values are depicted relative to mrna in im-scwats differentiated without ROS treated without NE, which are arbitrarily defined as 1 (mean ± s.e.m. of three technical replicates). (f) Immunoblot analysis of UCP1 and PPARγ in the time course of norepinephrine treatment (NE, 1 µm) in im-scwats differentiated with or without rosiglitazone (ROS). Equal loading of the proteins was confirmed by β-actin. (g) The metabolic profile of im-scwats differentiated with or without rosiglitazone (ROS) was assessed using a Seahorse XF extracellular flax analyzer. The parameters analyzed on the same plate are represented as norepinephrine (NE, 1 µm)-induced mitochondrial (left panel) and maximum mitochondrial respiration (right panel) (mean ± s.e.m. of five technical replicates). (h) Schematic diagram of the targeting strategy of SA mutation. Only the relevant restriction sites are indicated. Locations of the PCR primers (arrows) for genotyping are shown. (i) Direct sequencing of genomic DNA from mice distinguishes between () mice (Serine : TCT) and Jmjd1a-SA mice (Alanine : GCA). (j) An ethidium bromide-stained agarose gel illustrates PCR products for genotyping, Jmjd1a-SA KI/+ mice, and Jmjd1a-SA mice. (k) Subcutaneous white adipose tissues (scwats) were isolated from and Jmjd1a-SA male mice housed at ºC for 3 hr. Tissue homogenate from scwat and Jmjd1a-SA scwat were subjected to immunoprecipitation (IP) with anti-mjmjd1a followed by immunoblot (IB) analysis with anti-p-jmjd1a (pser). Uncropped images of the blots (f,k) are shown in Supplementary Fig.. (l) Genotype in pups (n = ) obtained by crossing Jmjd1a-SA KI/+ mice. (m) Quantification of XY male, XY female, and XX female (left panel). An ethidium bromide-stained agarose gel illustrates PCR product for identifying sex (right panel). The PCR product ( bp) by forward primer -AAGATAAGCT- TACATAATCACATGGA-3 and reverse primer -CCTATGAAATCCTTTGCTGCACATGT-3 was detected in male (Y chromosome). (n) Body weights of () and Jmjd1a-SA male mice (n = /group). (o) Norepinephrine (NE, 1 mg/kg BW)-induced changes in O consumption of and Jmjd1a-SA mice acclimated to 3ºC for weeks (left). O consumption rates before and 3 min after NE treatment were analyzed (right) (n = /group). (p) Representative images (bar, mm) (left) and the weights (right) of BAT of () and Jmjd1a-SA mice described in (n) (n = /group). (q) Haematoxylin and eosin (H&E) and UCP1 staining sections of BAT from and Jmjd1a-SA mice (bar, µm). (c,e,g,n-p) Data are mean ± s.e.m. Student s t-test was performed for comparisons in c,e,g, right panel; n-p and analysis of variance were performed followed by Tukey s post hoc comparison in g, left panel. *P <., **P <.1 and P <. were considered statistically significant. n.s. not significant. bp


")


.")
3 Jmjd1a Jmjd1a -/- Jmjd1a Jmjd1a -/- 3 H&E 3 Jmjd1a UCP1 α-ucp1 scwat BAT -/- -/ μm μm Supplementary Figure Impaired beige-ing of scwat in Jmjd1a-null mice by chronic cold exposure. Hematoxylin and eosin (H&E) and UCP1 staining sections of scwats from () and Jmjd1a-null (-/-) mice exposed to 3ºC or ºC for 1 week (left and middle panels) (bar, µm). Tissue homogenate of scwats and BAT from these mice exposed to ºC were subjected to immunoblot analysis with anti-ucp1, anti-jmjd1a, or anti-pparγ (right). Uncropped images of the blots are shown in Supplementary Fig..
 1 1 NE Oligo Rot/Anti 3 Time (min) OCR (pmoles min -1 per 1 cells) 1 1 NE response NE - NE + c α-mjmjd1a sh-empty sh-jmjd1 1.")

 Nd Nd Cytb Cox1 Cox Cox3 Atp Atp k Relative expression 1.")

 α-ucp1 1 1 1 3 Supplementary Figure 3 ps-jmjd1a cell autonomously induces beige adipogenesis.")
4 a Relative expression Nd1 Nd Nd Cytb Cox1 Cox Cox3 Atp Atp b OCR (pmoles min -1 per 1 cells) 1 1 NE Oligo Rot/Anti 3 Time (min) OCR (pmoles min -1 per 1 cells) 1 1 NE response NE - NE + c α-mjmjd1a sh-empty sh-jmjd1a Relative expression sh-empty mjmjd1a mrna sh-jmjd1a d sh- Empty sh- Jmjd1a ROS - ROS + e α-hjmjd1a α-mjmjd1a im-scwat sh s im-scwats Empty -hjmjd1a SA -hjmjd1a mjmjd1a hjmjd1a (ng) f j m Relative expression ORO SA MitoTracker SA SA g µm OCR (pmoles min -1 per 1 cells) Nd Nd Cytb Cox1 Cox Cox3 Atp Atp k Relative expression n NE- NE+ Relative expression SA Maximum SA 3 1 SA Ucp1 Cidea Pgc1a Prdm1 Ppara Coxb Pgc1b Bmpb Fgf1 Elovl3 SD Uncoupled ** SA Beige-selective genes h Cpt1b Nd Nd Cytb Cox1 Cox Cox3 Atp Atp Glycerol release (mm per mg protein) Adrb1 Adrb Pparg SA General adipogenic gene l i Relative Mt-DNA (normalized to Ppia) 1. SA 1.. Nd1 Nd Nd SA NE (hr) α-ucp Supplementary Figure 3 ps-jmjd1a cell autonomously induces beige adipogenesis. (a,b) Stromal vascular fractions (SVF) from scwat of or Jmjd1a-SA were cultured and induced for beige adipogenesis. (a) mrna levels measured by qpcr. The mrna values are depicted relative to mrna in culture, which are arbitrarily defined as 1 (mean ± s.e.m. of three technical replicates). (b) The metabolic profile assessed by Seahorse XF extracellular flux analyzer (left). The parameters analyzed on the same plate are represented as norepinephrine (NE, 1 µm)-induced mitochondrial respiration (right) (mean ± s.e.m. of five technical replicates). The arrows indicate time of addition for oligomycin (Oligo), FCCP, and rotenone/antimycin A (Rot/Anti). (c) Immunoblot (left) and qpcr analysis (right). The mrna values are depicted relative to mrna in im-scwats (sh-empty), which are arbitrarily defined as 1. Data are mean ± s.e.m. of three technical replicates. (d) Oil red O (ORO) staining in im-scwats expressing shrna targeting mouse Jmjd1a (sh-jmjd1a) or empty vector (sh-empty) treated with or without rosiglitazone (ROS). (e) Exogenous human JMJD1A expression level in im-scwat sh s was similar level to native JMJD1A in im-scwats. Aliquots of whole cell lysate prepared from im-scwats, im-scwats knocked-down Jmjd1a by shrna (im-scwat sh s) overexpressing or SA human JMJD1A, or control Zeo r -empty (Empty) along with the indicated amounts of recombinant purified human JMJD1A (full length) or His-tagged mouse JMJD1A (full length) proteins were subjected to IB analysis with anti-mjmjd1a antibody or anti-hjmjd1a antibody. (f) Oil red O (ORO) staining. (g) The metabolic profile of - and SA- hjmjd1a -transduced im-scwats differentiated with ROS assessed by a Seahorse XF extracellular flux analyzer. The parameters analyzed on the same plate are represented as norepinephrine (NE, 1 µm)-induced mitochondrial respiration (left), maximum mitochondrial respiration (middle) and uncoupled mitochondrial respiration (right) (mean ± s.e.m. of five technical replicates). (h) Glycerol release in - and SA- hjmjd1a -transduced im-scwats treated with NE (1 µm) for hr (mean ± s.e.m. of three independent experiments). (i) Mitochondrial DNA (Mt-DNA) content. The mt-dna values are depicted relative to mt-dna in - hjmjd1a -transduced im-scwats, which are arbitrarily defined as 1 (mean ± s.e.m. of three independent experiments). (j) MitoTracker staining in - and SA- hjmjd1a -transduced im-scwats (bar, µm). (k) mrna levels of beige-selective genes and general adipogenic gene in - and SA- hjmjd1a -transduced im-scwats differentiated with rosiglitazone were measured by qpcr. The mrna values are depicted relative to mrna in - hjmjd1a -transduced im-scwats, which are arbitrarily defined as 1 (mean ± s.e.m. of three technical replicates). (l) Immunoblot analysis of UCP1, PPARγ and JMJD1A in the time course of norepinephrine (NE, 1 µm) treatment in - and SA- hjmjd1a -transduced im-scwats differentiated with rosiglitazone. Equal loading of the proteins was confirmed by β-actin. Uncropped images of the blots (c,e,l) are shown in Supplementary Fig.. (m,n) mrna levels (m) or SD- hjmjd1a (n)-transduced im-scwats differentiated with ROS were measured by qpcr. The mrna values are depicted relative to mrna in - hjmjd1a -transduced cultures, which are arbitrarily defined as 1 (s.e.m. of three technical replicates). (b,g,h) Student s t-test was performed for comparisons in g, middle and right panels; h and analysis of variance were performed followed by Tukey s post hoc comparison in b, right panel; g, left panel. **P <.1 and P <. were considered statistically significant.
 JMJD1A (ISO +) * * * * ** * * Ucp1 Pgc1a H3K7ac (ISO -) H3K7ac (ISO +) PRDM1 JMJD1A (ISO -) JMJD1A (ISO +) *")
 Prdm1 * * * * ** JMJD1A (ISO +) Ppara * * * * * Prdm1 Adrb1 Cidea H3K7ac (ISO -) H3K7ac (ISO -) H3K7ac (ISO +)")
 11, 1,1,1 CEBP")

.")
 on beige-selective genes.")
 Whole-cell lysates (WCL) from -, SA - (c) or SD -hjmjd1a (d)-transduced im-scwats were subjected to immunoprecipitation (IP)")
 WCL from () and Jmjd1a-SA scwat cultures was subjected to immunoprecipitation (IP) using anti-jmjd1a antibody and")
 are shown in Supplementary Fig.")
5 a Number of binding sites in BAT cells 13,39 11,,9 b PRDM1 JMJD1A (Total,71) (Total 7,397) Ucp1 H3K7ac (ISO -) H3K7ac (ISO +) PRDM1 JMJD1A (ISO -) JMJD1A (ISO +) * * * * ** * * Ucp1 Pgc1a H3K7ac (ISO -) H3K7ac (ISO +) PRDM1 JMJD1A (ISO -) JMJD1A (ISO +) * * * * * * * * Pgc1a Ppara H3K7ac (ISO -) H3K7ac (ISO +) PRDM1 JMJD1A (ISO -) JMJD1A (ISO +) H3K7ac (ISO -) H3K7ac (ISO +) PRDM1 JMJD1A (ISO -) Prdm1 * * * * ** JMJD1A (ISO +) Ppara * * * * * Prdm1 Adrb1 Cidea H3K7ac (ISO -) H3K7ac (ISO -) H3K7ac (ISO +) H3K7ac (ISO +) PRDM1 PRDM1 JMJD1A (ISO -) JMJD1A (ISO -) JMJD1A (ISO +) JMJD1A (ISO +) * * * * Adrb1 * * Cidea * c Input SA Input SD d e Input 1 3 f Number of binding sites in BAT cells Transcription factor Motif P-value PRDM1 (Total,71) 11, 1,1,1 CEBP 1.E-13,91,1 3,33 JMJD1A (Total 7,397) PPARγ 7.97E-1,7 EBF 7.E-9 PPARγ (Total,1) RXR, LXRβ.17E- HNF.7E- Supplementary Figure β-adrenergic signal induces ps-jmjd1a-pparγ-pgc1 protein complex formation. (a) Venn diagram shows the number of genome-wide DNA binding sites of PRDM1 and JMJD1A in brown adipocytes following the stimulation with β-adrenergic agonist, isoproterenol (ISO). (b) ChIP-seq profiles for H3K7ac, PRDM1 and JMJD1A in brown adipocytes treated with or without β-adrenergic agonist, isoproterenol (ISO, 1 µm for hr) on beige-selective genes. Red asterisks indicate ISO-dependent JMJD1A binding sites overlapped with those of PRDM1. (c,d) Whole-cell lysates (WCL) from -, SA - (c) or SD -hjmjd1a (d)-transduced im-scwats were subjected to immunoprecipitation (IP) with anti-v antibody followed by immunoblot (IB) analysis with either anti-prdm1, PPARγ, PGC1α or V antibodies. (e) WCL from () and Jmjd1a-SA scwat cultures was subjected to immunoprecipitation (IP) using anti-jmjd1a antibody and immunoblotted (IB) with either anti-prdm1, PPARγ, PGC1α or JMJD1A antibodies. Uncropped images of the blots (c,d,e) are shown in Supplementary Fig.. (f) Venn diagram shows the number of genome-wide DNA binding sites of PRDM1, JMJD1A and PPARγ in brown adipocytes treated with ISO (left panel). Transcription factor binding motifs enriched in genomic regions within JMJD1A, PRDM1 and PPARγ bindings are listed in the right panel. Data for JMJD1A, H3K7ac and PPARγ were obtained from Abe et al., (Nat Commun, 7 ()) and PRDM1 from Harms et al., (Genes Dev 9, 9- ()) in a, b, f.
6 a Beige-selective genes FPKM Ucp1 Fabp3 Pdk 3 1 Cited1 3 Hadhb Slca Prdm1 Coxb Cpt1b Cpt 3 1 Elovl3 Pgc1a Cidea 1. Otop Ppara Fgf1 ROS - ROS + Days after induction General adipogenic genes FPKM.... Plin1 Plin Dgat Scd1 Scd Scd Scd Fasn Pparg Fabp Adipoq 3 Days after induction ROS - ROS + White-selective genes FPKM Igfbp3 Dpt Apcdd1 ROS - ROS + Days after induction b GO terms Cellular Component lipid particle peroxisome mitochondrion extracellular space mitochondrial inner membrane mitochondrial fatty acid beta-oxidation multienzyme complex mitochondrial nucleoid endoplasmic reticulum lumen mitochondrial envelope extracellular region log1 (FDR) GO terms Biological cess lipid metabolic process fatty acid metabolic process fatty acid beta-oxidation metabolic process acyl-coa metabolic process long-chain fatty acid transport negative regulation of lipid catabolic process oxidation-reduction process long-chain fatty acid metabolic process response to insulin 1 -log1 (FDR) Supplementary Figure Transcriptional changes associated with beige adipogenesis. (a) mrna levels for beige-selective genes, general adipogenic genes, and white-selective genes in im-scwats differentiated with or without rosiglitazone (ROS), as determined by RNA-Seq and are expressed as FPKM. (b) GO analysis of ps-jmjd1a dependent 1 beige-selective genes described in Figure a.
7 a ORO SD SD- H11Y SD SD- H11Y b FPKM FPKM FPKM Adha..1. Cidea 3 1 Ucp Rdh1 Lims Grb7 Rdh1-ps 31D17Rik Bex Ldhb 1 739M1Rik 9L11Rik mkiaa17 Ces1f AK Fndc Coxb Ppara Ucp3 Gys Plbd1 Acot...1. Krt L1Rik Rdh EG31 BC3 Plin Cpt1b Rdh9 Atp9a Aldh3b 3 1 Dmrtc Slcoa SD SD-H11Y c FPKM 1 Nrg Pank1 Coxb Prdm AK117 Otop Tmem Gm Chrna 3 1 3GRik Elovl Mel1 Fmo1 1 SD SD-H11Y Supplementary Figure Demethylation activity of JMJD1A is pivotal for beige-selective gene inductions. (a) ORO staining in -, SD - or SD-H11Y -hjmjd1a -transduced im-scwats differentiated with rosiglitazone (left panel). Whole-cell lysates from -, SD - SD-H11Y -hjmjd1a -transduced im-scwats differentiated with rosiglitazone were subjected to immunoblot analysis with anti-v antibody (right panel). Uncropped images of the blots are shown in Supplementary Fig.. (b,c) mrna levels for 7 genes that are beige-selective, SA down-regulated, and SD up-regulated as determined by RNA-Seq and are expressed as FPKM. Top 3 genes (b) of 7 genes reduced more than half in mrna expression from the SD-H11Y compared to the SD. The rest of 13 genes are shown in c.
 Time (min) Plasma glucose (mg dl -1 ) 3 ITT Time (min) b scwat")

 Glucose tolerance test (GTT) and insulin tolerance test (ITT) were performed in ()")
 and plasma insulin levels (middle panel) during GTT")
 during ITT are shown. Data are me")
 Assessment of insulin signaling, as quantified by the phosphorylation of AKT-S73,")
8 a Plasma glucose (mg dl -1 ) 3 GTT (Glucose) Time (min) Plasma insulin (ng ml -1 ) GTT (insulin) Time (min) Plasma glucose (mg dl -1 ) 3 ITT Time (min) b scwat BAT Liver Insulin α-pakt S73 α-akt α-pakt S73 α-akt α-pakt S73 α-akt Soleus α-pakt S73 α-akt Supplementary Figure 7 Similar glucose tolerance and insulin sensitivity in Jmjd1a-SA mice and mice housed under thermoneutrality. (a) Glucose tolerance test (GTT) and insulin tolerance test (ITT) were performed in () and Jmjd1a-SA mice fed on a high fat diet (HFD) before cold acclimation (n = -7/group). Plasma glucose levels (left panel) and plasma insulin levels (middle panel) during GTT and plasma glucose levels (right panel) during ITT are shown. Data are mean ± s.e.m. (b) Assessment of insulin signaling, as quantified by the phosphorylation of AKT-S73, in scwat, BAT, liver or soleus muscle from and Jmjd1a-SA KI/K mice housed at room temperature before and 1 min after insulin injection (.3 unit). Uncropped images of the blots are shown in Supplementary Fig..


 NE")


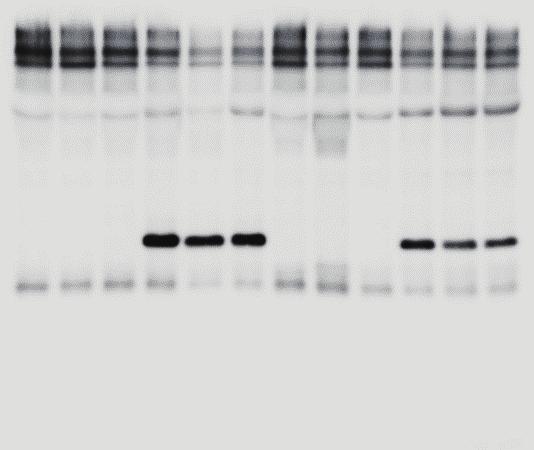
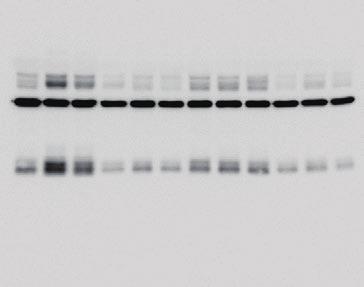

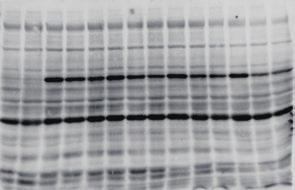
9 Figure 1a α-ucp1 BAT scwat 3 3 Figure 1b α-h3k9me BAT scwat hr hr hr hr Figure 1e α-ucp1 BAT scwat 3 3 BAT scwat 3 3 α-pan H3 BAT scwat hr hr hr hr BAT scwat 3 3 Figure 3a α-p-jmjd1a (pser) NE + + Figure 3j α-ucp1 SD NE + + SD SD NE + + α-total OXPHOS SD SD Figure 3c α-ucp1 α-total OXPHOS Figure b α-ucp1 3 α-β-actin Figure b α-p-jmjd1a (pser) SA - - Figure f SA - - SA - - SA - - α-ppraγ SA - - α-ppraγ Figure d α-ucp1 α-total OXPHOS Supplementary Figure Representative original images of immunoblot analysis


 Figure 1k")


 Figure")
 α-β-action")


10 Figure g SA SA α-p-jmjd1a (pser) SA SA SA SA SA SA SA SA Figure 7d scwat BAT Soleus α-pakt S73 α-pakt S73 α-pakt S73 α-akt α-akt α-akt Supplementary Figure 1f α-ucp1 ROS - ROS + NE 1 1 (h) ROS - ROS + NE 1 1 (h) ROS - ROS + NE 1 1 (h) Supplementary Figure 1k α-p-jmjd1a (pser) KI/+ KI/+ Supplementary Figure α-ucp1 scwat BAT Jmjd1a -/- -/- scwat BAT Jmjd1a -/- -/- Jmjd1a -/- -/- scwat BAT Supplementary Figure 3c α-mjmjd1a sh-empty sh-jmjd1a Supplementary Figure 3e α-hjmjd1a im-scwat sh s im-scwats Empty -hjmjd1a SA -hjmjd1a mjmjd1a hjmjd1a (ng) Supplementary Figure 3i sh-empty sh-jmjd1a α-mjmjd1a im-scwat sh s im-scwats Empty -hjmjd1a SA -hjmjd1a mjmjd1a hjmjd1a (ng) α-β-action im-scwat sh s im-scwats Empty -hjmjd1a SA -hjmjd1a mjmjd1a hjmjd1a (ng) α-ucp1 SA SA SA SA NE (hr) 1 1 NE (hr) 1 1 NE (hr) 1 1 NE (hr) 1 1 Supplementary Figure Continued


11 Supplementary Figure c SA SA SA SA SA SA α-v (JMJD1A) SA α-v (JMJD1A) SA SA Supplementary Figure d α-v α-v (JMJD1A) (JMJD1A) SD SD SD SD SD SD SD SD SD Supplementary Figure e Supplementary Figure a Supplementary Figure 7b SD SD-H11Y SD SD-H11Y scwat α-akt Insulin BAT α-akt Insulin α-pakt S73 Insulin α-pakt S73 Insulin Liver α-akt Insulin Soleus α-akt Insulin α-pakt S73 Insulin α-pakt S73 Insulin Supplementary Figure Continued
12 Supplementary Table 1 Details of the age and sex of mice Mouse Strain C7BL/N and Jmjd1a-SA () and Jmjd1a-null (-/-) Sex Age (weeks at starting point of the treatment) Figure Male Figure 1a,b Male 1 Figure 1c Male Figure 1e Male Figure 1f Male -1 Figure 1h Male -9 Figure 1j Male 7- Figure 1k Female 1-17 Figures a,b Male Figure c Female -9 Figure d Male 7 Figure e Male Figures 7a-d and Supplementary Figure 7a Male 9 Supplementary Figure 1k Male Supplementary Figure 1n,p,q Male -9 Supplementary Figure 1o Male 7-9 Supplementary Figure 7b Female -11 Figure d Male 13 Supplementary Figures 1b () and
13 Supplementary Table Antibodies Antibody Source Catalog No /Clone No anti-mouse JMJD1A Monoclonal Our laboratory -F1 anti-mouse JMJD1A Monoclonal Our laboratory -F31 Dilutions or concentrations μg ml -1 for IB, 1 μg ml -1 for IP μg ml -1 for ChIP (together with μg ml -1 of -F1 ) anti-human JMJD1A Monoclonal Our laboratory -F1 μg ml -1 for IB anti-p-jmjd1a (ps) Polyclonal Our laboratory #119-1: for IB anti-ppar Monoclonal Our laboratory -A39. μg ml -1 for IB anti-ppar Monoclonal Santa Cruz sc-773 (E-) anti-prdm1 Monoclonal Our laboratory -F111 anti-prdm1 Monoclonal Our laboratory -F13 anti-prdm1 Polyclonal R&D Systems AF9 μg ml -1 for ChIP (together with μg ml -1 of -A39) μg ml -1 for IB (used in Fig. f (input)) 1 μg ml -1 for IP (used in Fig. g) 1 μg ml -1 for IB (used in Fig. 3c and f (IP ppt.) and Fig. g, Supplementary Fig. c-e) anti-ucp1 Polyclonal Abcam ab193 1: for IHC anti-ucp1 Monoclonal R&D Systems MAB 1 μg ml -1 for IB anti-pgc1 Polyclonal Novus 1-7 1: for IB anti-total OXPHOS Monoclonal Abcam ab μg ml -1 for IB anti- -actin Monoclonal Sigma A1 1: for IB anti-v Monoclonal Invitrogen R9- anti-h3k9me Monoclonal Dr. Kimura -D11 1 μg ml -1 for IB, 1 μg ml -1 for IP 1 μg ml -1 for ChIP µg ml -1 for IB anti-histone H3 Polyclonal Abcam ab µg ml -1 for IB anti-akt Monoclonal Cell Signaling #91 1: for IB anti-pakt S73 Monoclonal Cell Signaling # 1: for IB
14 Supplementary Table 3 ChIP-qPCR primers ChIP-qPCR primers Gene Sequence Amplified Forward Primer Reverse Primer regions Actb '-TGAGGTACTAGCCACGAGAGA G-3' '-ACACCCGCCACCAGGTAAGCA-3' Actb (Intron 1) Ppib '-CTCACCCCAACTAGTCTAATC '-GTGACACACAGTGACTAACTT C-3' CC-3' Ppib (Intron 3) '-GCAACCCTCTCCCATCAGTG-3' '-GCCTAACACCGTGCTTCTCA-3' Ucp1 (-13 kb) Ucp1 '-TGCAACCCCTCACCTTTTAC-3' '-CTCCTTCCATCATCCCTTCA-3' Ucp1 (-. kb) '-TCACCCTTGACCACACTGAA-3' '-GTGAGGCTGATATCCCCAGA-3' Ucp1 (-. kb) '-TGCCAAGTCCCACTAGCAG-3' '-ACCCGTTAAGCCCAGATTG-3' Ucp1 (TSS) Ppara '-TGGCCGGGAGGAACTG-3 '-GGCAGGGACAATCTCTTTGTG-3' Ppara (-1 kb) '-GGCAGTCCCTTCACCTAACC-3' '-TCCTCGATGCCCATTTAGTG-3' Ppara (TSS) Cidea '-CACCGCTTCACTTTGTCCTTT-3' '-GAGCACCCGGTTTGACAGT-3' Cidea (-13. kb) '-CACGCACACCTGCTTCTCTA-3' '-GATGTTGGTGGCTCTTGTCA-3' Cidea (TSS)
15 Supplementary Table RT- qpcr primers RT- qpcr primers Gene Sequence Forward Primer Reverse Primer Ppib #1 '-GGAGATGGCACAGGAGGAA-3' '-GCCCGTAGTGCTTCAGCTT-3' Ppib # '-GCATACGGGTCCTGGCATCTTGT-3' '-ATGGTGATCTTCTTGCTGGTCTT-3' Nd1 '-GTTGGTCCATACGGCATTTT-3' '-TGGGTGTGGTATTGGTAGGG-3' Nd '-GCCTGGAATTCAGCCTACTAGC-3' '-GGCTGTTGCTTGTGTGACGA-3' Nd '-CGCCTACTCCTCAGTTAGCCA-3' '-TGATGTGAGGCCATGTGCGA-3' Cytb '-CCTTCATGTCGGACGAGGCTT-3' '-TGCTGTGGCTATGACTGCGAA-3' Cox1 '-TAGCCCATGCAGGAGCATCA-3' '-TGGCTGGGGGTTTCATGTTGA-3' Cox '-ACCTGGTGAACTACGACTGCT-3' '-CCTAGGGAGGGGACTGCTCA-3' Cox3 '-CTTCACCATCCTCCAAGCTTCA-3' '-AGTCCATGGAATCCAGTAGCCAT-3' Atp '-TGGCATTAGCAGTCCGGCTT-3' '-ATGGTAGCTGTTGGTGGGCT-3' Atp '-TTCCCACTGGCACCTTCACC-3' '-TGTTGGGGTAATGAATGAGGCAA-3' Ucp1 '-AAGCTGTGCGATGTCCATGT-3' '-AAGCCACAAACCCTTTGAAAA-3' Cidea '-GGTTCAAGGCCGTGTTAAGG-3' '-CGTCATCTGTGCAGCATAGG-3' Pgc1a '-AACCACACCCACAGGATCAGA-3' '-TCTTCGCTTTATTGCTCCATGA-3' Prdm1 '-GCACGGTGAAGCCATTCATATG-3' '-TCGGCGTGCATCCGCTTGTG-3' Dio '-GTCCGCAAATGACCCCTTT-3' '-CCCACCCACTCTCTGACTTTC-3' Cpt1b '-GCTGCCGTGGGACATTC-3' '-CTTGGCTACTTGGTACGAGTTCTC-3' Adrb1 '-GCTGGGAGTACGGCTCCTT-3' '-GCCGTCACACACAGCACAT-3' Adrb3 '-TCCTTCTACCTTCCCCTCCTT-3' '-CGGCTTAGCCACAACGAACAC-3' Pparg '-CAAGAATACCAAAGTGCGATCAA-3' '-GAGCTGGGTCTTTTCAGAATAATAAG-3' Adipoq '-CAGTGGATCTGACGACACCAA-3' '-GAACAGGAGAGCTTGCAACAGT-3' Coxb '-GCTGGCTGGACTCTGTCATT-3' '-GTACCAGGGCCTGCATAGTG-3' Pgc1b '-GAGGGCTCCGGCACTTC-3'-3' '-CGTACTTGCTTTTCCCAGATGA-3' Ppara '-ACAAGGCCTCAGGGTACCA-3' '-GCCGAAAGAAGCCCTTACAG-3' Elovl3 '-TTCTCACGCGGGTTAAAAATG-3' '-GGGCCTTAAGTCCTGAAACGT-3' Bmpb '-CACTTCCGCCGTGGAGC-3' '-GTGGGCTAAGACCCATCCTG-3' Fabp '-AGTGAAAACTTCGATGATTACATGAA-3' '-GCCTGCCACTTTCCTTGTG-3' Nrf1 '-TGCTTCAGAACTGCCAACCA-3' '-GGTCATTTCACCGCCCTGTA-3' Irf '-AGCTGCAAGTGTTTGCTCAC-3' '-GTCTGGCTAGCAGAGGTTCC-3' Tfam '-CCGAAGTGTTTTTCCAGCAT-3' '-GGCTGCAATTTTCCTAACCA-3' Fgf1 '-CCTCTAGGTTTCTTTGCCAACAG-3' '-AAGCTGCAGGCCTCAGGAT-3'
SUPPLEMENTARY INFORMATION
 doi:10.1038/nature12652 Supplementary Figure 1. PRDM16 interacts with endogenous EHMT1 in brown adipocytes. Immunoprecipitation of PRDM16 complex by flag antibody (M2) followed by Western blot analysis
Supplementary Figure 1. DJ-1 modulates ROS concentration in mouse skeletal muscle.
 Supplementary Figure 1. DJ-1 modulates ROS concentration in mouse skeletal muscle. (a) mrna levels of Dj1 measured by quantitative RT-PCR in soleus, gastrocnemius (Gastroc.) and extensor digitorum longus
GPR120 *** * * Liver BAT iwat ewat mwat Ileum Colon. UCP1 mrna ***
 a GPR120 GPR120 mrna/ppia mrna Arbitrary Units 150 100 50 Liver BAT iwat ewat mwat Ileum Colon b UCP1 mrna Fold induction 20 15 10 5 - camp camp SB202190 - - - H89 - - - - - GW7647 Supplementary Figure
SUPPLEMENTARY DATA. Supplementary Table 1. Primer sequences for qrt-pcr
 Supplementary Table 1. Primer sequences for qrt-pcr Gene PRDM16 UCP1 PGC1α Dio2 Elovl3 Cidea Cox8b PPARγ AP2 mttfam CyCs Nampt NRF1 16s-rRNA Hexokinase 2, intron 9 β-actin Primer Sequences 5'-CCA CCA GCG
1.5 ASK1KO fed. fasted 16 hrs w/o water. Fed. 4th. 4th WT ASK1KO N=29, 11(WT), ,5(ASK1KO) ASK1KO ASK1KO **** Time [h]
![1.5 ASK1KO fed. fasted 16 hrs w/o water. Fed. 4th. 4th WT ASK1KO N=29, 11(WT), ,5(ASK1KO) ASK1KO ASK1KO **** Time [h]](/thumbs/87/97258189.jpg "1.5 ASK1KO fed. fasted 16 hrs w/o water. Fed. 4th. 4th WT ASK1KO N=29, 11(WT), ,5(ASK1KO) ASK1KO ASK1KO **** Time [h]") 7: 13: 19: 1: 7: 151117 a 151117 4th 4th b c RQ.95 KO.9.85.8.75.7 light dark light dark.65 7: 19: 7: 19: 7: Means ± SEM, N=6 RQ 1..9.8.7.6.6 KO CL (-) CL (+) ibat weight ratio (/body weight) [%].5.4.3.2.1
7: 13: 19: 1: 7: 151117 a 151117 4th 4th b c RQ.95 KO.9.85.8.75.7 light dark light dark.65 7: 19: 7: 19: 7: Means ± SEM, N=6 RQ 1..9.8.7.6.6 KO CL (-) CL (+) ibat weight ratio (/body weight) [%].5.4.3.2.1
SUPPLEMENTARY INFORMATION
 -. -. SUPPLEMENTARY INFORMATION DOI: 1.1/ncb86 a WAT-1 WAT- BAT-1 BAT- sk-muscle-1 sk-muscle- mir-133b mir-133a mir-6 mir-378 mir-1 mir-85 mir-378 mir-6a mir-18 mir-133a mir- mir- mir-341 mir-196a mir-17
A synergistic anti-obesity effect by a combination of capsinoids and cold temperature through the promotion of beige adipocyte biogenesis
 A synergistic anti-obesity effect by a combination of capsinoids and cold temperature through the promotion of beige adipocyte biogenesis Kana Ohyama, 1,2 Yoshihito Nogusa, 1 Kosaku Shinoda, 2 Katsuya
Supplementary Figure 1
 VO (ml kg - min - ) VCO (ml kg - min - ) Respiratory exchange ratio Energy expenditure (cal kg - min - ) Locomotor activity (x count) Body temperature ( C) Relative mrna expression TA Sol EDL PT Heart
Supplemental Fig. 1. Relative mrna Expression. Relative mrna Expression WT KO WT KO RT 4 0 C
 Supplemental Fig. 1 A 1.5 1..5 Hdac11 (ibat) n=4 n=4 n=4 n=4 n=4 n=4 n=4 n=4 WT KO WT KO WT KO WT KO RT 4 C RT 4 C Supplemental Figure 1. Hdac11 mrna is undetectable in KO adipose tissue. Quantitative
Supplementary Table 1.
 Supplementary Table 1. Expression of genes involved in brown fat differentiation in WAT of db/db mice treated with HDAC inhibitors. Data are expressed as fold change (FC) versus control. symbol FC SAHA
18s AAACGGCTACCACATCCAAG CCTCCAATGGATCCTCGTTA. 36b4 GTTCTTGCCCATCAGCACC AGATGCAGCAGATCCGCAT. Acc1 AGCAGATCCGCAGCTTG ACCTCTGCTCGCTGAGTGC
 Supplementary Table 1. Quantitative PCR primer sequences Gene symbol Sequences (5 to 3 ) Forward Reverse 18s AAACGGCTACCACATCCAAG CCTCCAATGGATCCTCGTTA 36b4 GTTCTTGCCCATCAGCACC AGATGCAGCAGATCCGCAT Acc1
SUPPLEMENTARY INFORMATION
 doi: 1.138/nature7221 Brown fat selective genes 12 1 Control Q-RT-PCR (% of Control) 8 6 4 2 Ntrk3 Cox7a1 Cox8b Cox5b ATPase b2 ATPase f1a1 Sirt3 ERRα Elovl3/Cig3 PPARα Zic1 Supplementary Figure S1. stimulates
Supplemental Information. Increased 4E-BP1 Expression Protects. against Diet-Induced Obesity and Insulin. Resistance in Male Mice
 Cell Reports, Volume 16 Supplemental Information Increased 4E-BP1 Expression Protects against Diet-Induced Obesity and Insulin Resistance in Male Mice Shih-Yin Tsai, Ariana A. Rodriguez, Somasish G. Dastidar,
SUPPLEMENTARY INFORMATION
 DOI: 10.1038/ncb2211 a! mir-143! b! mir-103/107! let-7a! mir-144! mir-122a! mir-126-3p! mir-194! mir-27a! mir-30c! Figure S1 Northern blot analysis of mir-143 expression dependent on feeding conditions.
Fig. S1. Validation of ChIP-seq binding sites by single gene ChIP-PCR Fig. S2. Transactivation potential of PPAR
 Fig. S1. Validation of ChIP-seq binding sites by single gene ChIP-PCR ChIP-PCR was performed on PPARγ and RXR-enriched chromatin harvested during adipocyte differentiation at day and day 6 as described
Supplementary Figure 1
 Supplementary Figure 1 how HFD how HFD Epi WT p p Hypothalamus p p Inguinal WT T Liver Lean mouse adipocytes p p p p p p Obese mouse adipocytes Kidney Muscle Spleen Heart p p p p p p p p Extracellular
Metabolic ER stress and inflammation in white adipose tissue (WAT) of mice with dietary obesity.
 of mice with dietary obesity.") Supplementary Figure 1 Metabolic ER stress and inflammation in white adipose tissue (WAT) of mice with dietary obesity. Male C57BL/6J mice were fed a normal chow (NC, 10% fat) or a high-fat diet (HFD,
Supplementary Figure 1 Metabolic ER stress and inflammation in white adipose tissue (WAT) of mice with dietary obesity. Male C57BL/6J mice were fed a normal chow (NC, 10% fat) or a high-fat diet (HFD,
Males- Western Diet WT KO Age (wks) Females- Western Diet WT KO Age (wks)
 Females- Western Diet WT KO Age (wks)") Relative Arv1 mrna Adrenal 33.48 +/- 6.2 Skeletal Muscle 22.4 +/- 4.93 Liver 6.41 +/- 1.48 Heart 5.1 +/- 2.3 Brain 4.98 +/- 2.11 Ovary 4.68 +/- 2.21 Kidney 3.98 +/-.39 Lung 2.15 +/-.6 Inguinal Subcutaneous
Relative Arv1 mrna Adrenal 33.48 +/- 6.2 Skeletal Muscle 22.4 +/- 4.93 Liver 6.41 +/- 1.48 Heart 5.1 +/- 2.3 Brain 4.98 +/- 2.11 Ovary 4.68 +/- 2.21 Kidney 3.98 +/-.39 Lung 2.15 +/-.6 Inguinal Subcutaneous
Supplemental Information Supplementary Table 1. Tph1+/+ Tph1 / Analyte Supplementary Table 2. Tissue Vehicle LP value
 Supplemental Information Supplementary Table. Urinary and adipose tissue catecholamines in Tph +/+ and Tph / mice fed a high fat diet for weeks. Tph +/+ Tph / Analyte ewat ibat ewat ibat Urine (ng/ml)
SUPPLEMENTARY FIGURES
 SUPPLEMENTARY FIGURES 1 Supplementary Figure 1, Adult hippocampal QNPs and TAPs uniformly express REST a-b) Confocal images of adult hippocampal mouse sections showing GFAP (green), Sox2 (red), and REST
Supplementary Figure 1
 Supplementary Figure 1 a Percent of body weight! (%) 4! 3! 1! Epididymal fat Subcutaneous fat Liver SD Percent of body weight! (%) ** 3! 1! SD Percent of body weight! (%) 6! 4! SD ** b Blood glucose (mg/dl)!
Supplementary Figure 1
 Supplementary Figure 1 Supplementary Figure 1 Schematic depiction of the tandem Fc GDF15. Supplementary Figure 2 Supplementary Figure 2 Gfral mrna levels in the brains of both wild-type and knockout Gfral
Cited4 is a sex-biased mediator of the antidiabetic glitazone response in adipocyte progenitors
 Cited4 is a sex-biased mediator of the antidiabetic glitazone response in adipocyte progenitors Irem Bayindir-Buchhalter, Gretchen Wolff, Sarah Lerch, Tjeerd Sijmonsma, Maximilian Schuster, Jan Gronych,
Supplementary Figures
 Supplementary Figures Supplementary Figure 1. Confirmation of Dnmt1 conditional knockout out mice. a, Representative images of sorted stem (Lin - CD49f high CD24 + ), luminal (Lin - CD49f low CD24 + )
Supporting Information. Supporting Tables. S-Table 1 Primer pairs for RT-PCR. Product size. Gene Primer pairs
 Supporting Information Supporting Tables S-Table 1 Primer pairs for RT-PCR. Gene Primer pairs Product size (bp) FAS F: 5 TCTTGGAAGCGATGGGTA 3 429 R: 5 GGGATGTATCATTCTTGGAC 3 SREBP-1c F: 5 CGCTACCGTTCCTCTATCA
Supplemental Information
 Supplemental Information Tobacco-specific Carcinogen Induces DNA Methyltransferases 1 Accumulation through AKT/GSK3β/βTrCP/hnRNP-U in Mice and Lung Cancer patients Ruo-Kai Lin, 1 Yi-Shuan Hsieh, 2 Pinpin
Supplementary Fig. 1 eif6 +/- mice show a reduction in white adipose tissue, blood lipids and normal glycogen synthesis. The cohort of the original
 Supplementary Fig. 1 eif6 +/- mice show a reduction in white adipose tissue, blood lipids and normal glycogen synthesis. The cohort of the original phenotypic screening was n=40. For specific tests, the
control kda ATGL ATGLi HSL 82 GAPDH * ** *** WT/cTg WT/cTg ATGLi AKO/cTg AKO/cTg ATGLi WT/cTg WT/cTg ATGLi AKO/cTg AKO/cTg ATGLi iwat gwat ibat
 body weight (g) tissue weights (mg) ATGL protein expression (relative to GAPDH) HSL protein expression (relative to GAPDH) ### # # kda ATGL 55 HSL 82 GAPDH 37 2.5 2. 1.5 1..5 2. 1.5 1..5.. Supplementary
A microrna-34a/fgf21 Regulatory Axis and Browning of White Fat
 A microrna-34a/fgf21 Regulatory Axis and Browning of White Fat Jongsook Kim Kemper, Ph.D Department of Molecular and Integrative Physiology, University of Illinois at Urbana-Champaign, USA 213 International
Supplemental Figure S1. RANK expression on human lung cancer cells.
 Supplemental Figure S1. RANK expression on human lung cancer cells. (A) Incidence and H-Scores of RANK expression determined from IHC in the indicated primary lung cancer subgroups. The overall expression
p = formed with HCI-001 p = Relative # of blood vessels that formed with HCI-002 Control Bevacizumab + 17AAG Bevacizumab 17AAG
 A.. Relative # of ECs associated with HCI-001 1.4 1.2 1.0 0.8 0.6 0.4 0.2 0.0 ol b p < 0.001 Relative # of blood vessels that formed with HCI-001 1.4 1.2 1.0 0.8 0.6 0.4 0.2 0.0 l b p = 0.002 Control IHC:
(a) Significant biological processes (upper panel) and disease biomarkers (lower panel)
 Significant biological processes (upper panel) and disease biomarkers (lower panel)") Supplementary Figure 1. Functional enrichment analyses of secretomic proteins. (a) Significant biological processes (upper panel) and disease biomarkers (lower panel) 2 involved by hrab37-mediated secretory
Supplementary Figure 1. Functional enrichment analyses of secretomic proteins. (a) Significant biological processes (upper panel) and disease biomarkers (lower panel) 2 involved by hrab37-mediated secretory
Nature Immunology: doi: /ni Supplementary Figure 1 33,312. Aire rep 1. Aire rep 2 # 44,325 # 44,055. Aire rep 1. Aire rep 2.
 a 33,312 b rep 1 rep 1 # 44,325 rep 2 # 44,055 [0-84] rep 2 [0-84] 1810043G02Rik Pfkl Dnmt3l Icosl rep 1 [0-165] rep 2 [0-165] Rps14 Cd74 Mir5107 Tcof1 rep 1 [0-69] rep 2 [0-68] Id3 E2f2 Asap3 rep 1 [0-141]
Supplementary Table 2. Plasma lipid profiles in wild type and mutant female mice submitted to a HFD for 12 weeks wt ERα -/- AF-1 0 AF-2 0
 Supplementary Table 1. List of specific primers used for gene expression analysis. Genes Primer forward Primer reverse Hprt GCAGTACAGCCCCAAAATGG AACAAAGTCTGGCCTGTATCCA Srebp-1c GGAAGCTGTCGGGGTAGCGTC CATGTCTTCAAATGTGCAATCCAT
Fig. S1. Dose-response effects of acute administration of the β3 adrenoceptor agonists CL316243, BRL37344, ICI215,001, ZD7114, ZD2079 and CGP12177 at
 Fig. S1. Dose-response effects of acute administration of the β3 adrenoceptor agonists CL316243, BRL37344, ICI215,001, ZD7114, ZD2079 and CGP12177 at doses of 0.1, 0.5 and 1 mg/kg on cumulative food intake
Supplementary Figure 1 IL-27 IL
 Tim-3 Supplementary Figure 1 Tc0 49.5 0.6 Tc1 63.5 0.84 Un 49.8 0.16 35.5 0.16 10 4 61.2 5.53 10 3 64.5 5.66 10 2 10 1 10 0 31 2.22 10 0 10 1 10 2 10 3 10 4 IL-10 28.2 1.69 IL-27 Supplementary Figure 1.
SUPPLEMENTARY FIGURES AND TABLE
 SUPPLEMENTARY FIGURES AND TABLE Supplementary Figure S1: Characterization of IRE1α mutants. A. U87-LUC cells were transduced with the lentiviral vector containing the GFP sequence (U87-LUC Tet-ON GFP).
Supplemental Table 1. Plasma NEFA and liver triglyceride levels in ap2-hif1ako and ap2-hif2ako mice under control and high fat diets.
 Supplemental Table 1. Plasma NEFA and liver triglyceride levels in Hif1aKO and Hif2aKO mice under control and high fat diets. Hif1a (n=6) Hif1aK O (n=6) Hif2a Hif2aK O Hif1a (n=5) Hif1aKO (n=5) Hif2a Hif2aK
Supplementary Materials for
 www.sciencesignaling.org/cgi/content/full/8/407/ra127/dc1 Supplementary Materials for Loss of FTO in adipose tissue decreases Angptl4 translation and alters triglyceride metabolism Chao-Yung Wang,* Shian-Sen
ALT (U/L) (Relative expression) HDL (mm) (Relative expression) ALT (U/L) (Relative expression)
 (Relative expression) HDL (mm) (Relative expression) ALT (U/L) (Relative expression)") a DMT mrna () 8 6 r =.96 P =. DMT mrna () 8 6 r =. P =.6 DMT mrna () 8 6 r =.99 P =.6 DMT mrna () 8 6 r =. P =.9 DMT mrna () BMI (kg/m ) 8 6 r =.7 P =.966 DMT mrna () 8 ALT (U/L) 8 6 r = -.66 P =.76 DMT
a DMT mrna () 8 6 r =.96 P =. DMT mrna () 8 6 r =. P =.6 DMT mrna () 8 6 r =.99 P =.6 DMT mrna () 8 6 r =. P =.9 DMT mrna () BMI (kg/m ) 8 6 r =.7 P =.966 DMT mrna () 8 ALT (U/L) 8 6 r = -.66 P =.76 DMT
Soft Agar Assay. For each cell pool, 100,000 cells were resuspended in 0.35% (w/v)
") SUPPLEMENTARY MATERIAL AND METHODS Soft Agar Assay. For each cell pool, 100,000 cells were resuspended in 0.35% (w/v) top agar (LONZA, SeaKem LE Agarose cat.5004) and plated onto 0.5% (w/v) basal agar.
SUPPLEMENTARY MATERIAL AND METHODS Soft Agar Assay. For each cell pool, 100,000 cells were resuspended in 0.35% (w/v) top agar (LONZA, SeaKem LE Agarose cat.5004) and plated onto 0.5% (w/v) basal agar.
Supplementary Figure 1. Efficiency of Mll4 deletion and its effect on T cell populations in the periphery. Nature Immunology: doi: /ni.
 Supplementary Figure 1 Efficiency of Mll4 deletion and its effect on T cell populations in the periphery. Expression of Mll4 floxed alleles (16-19) in naive CD4 + T cells isolated from lymph nodes and
7SK ChIRP-seq is specifically RNA dependent and conserved between mice and humans.
 Supplementary Figure 1 7SK ChIRP-seq is specifically RNA dependent and conserved between mice and humans. Regions targeted by the Even and Odd ChIRP probes mapped to a secondary structure model 56 of the
BEIGE AND BROWN FAT: BASIC BIOLOGY AND NOVEL THERAPEUTICS Dr. Carl Ascoli
 BEIGE AND BROWN FAT: BASIC BIOLOGY AND NOVEL THERAPEUTICS Dr. Carl Ascoli Symposium Co-Chairs: Bruce M. Spiegelman (Harvard/Dana Farber) and Sven Enerbäck (U.Gothenburg) April 17-23, 2015 Snowbird Resort,
AAV-TBGp-Cre treatment resulted in hepatocyte-specific GH receptor gene recombination
 AAV-TBGp-Cre treatment resulted in hepatocyte-specific GH receptor gene recombination Supplementary Figure 1. Generation of the adult-onset, liver-specific GH receptor knock-down (alivghrkd, Kd) mouse
Supplementary Figure S1. Gene expression analysis of epidermal marker genes and TP63.
 Supplementary Figure Legends Supplementary Figure S1. Gene expression analysis of epidermal marker genes and TP63. A. Screenshot of the UCSC genome browser from normalized RNAPII and RNA-seq ChIP-seq data
Supplemental Information. FGF19, FGF21, and an FGFR1/b-Klotho-Activating. Antibody Act on the Nervous System. to Regulate Body Weight and Glycemia
 Cell Metabolism, Volume 26 Supplemental Information FGF19, FGF21, and an FGFR1/b-Klotho-Activating Antibody Act on the Nervous System to Regulate Body Weight and Glycemia Tian Lan, Donald A. Morgan, Kamal
Comparison of open chromatin regions between dentate granule cells and other tissues and neural cell types.
 Supplementary Figure 1 Comparison of open chromatin regions between dentate granule cells and other tissues and neural cell types. (a) Pearson correlation heatmap among open chromatin profiles of different
Regulation of adipose tissue remodeling by peripheral serotonin
 Regulation of adipose tissue remodeling by peripheral serotonin Sangkyu Park Catholic Kwandong University College of Medicine Department of Biochemistry Serotonin (5-HT) is a signaling molecule Hemostasis
Supplementary methods:
 Supplementary methods: Primers sequences used in real-time PCR analyses: β-actin F: GACCTCTATGCCAACACAGT β-actin [11] R: AGTACTTGCGCTCAGGAGGA MMP13 F: TTCTGGTCTTCTGGCACACGCTTT MMP13 R: CCAAGCTCATGGGCAGCAACAATA
Supplementary Figure 1: si-craf but not si-braf sensitizes tumor cells to radiation.
 Supplementary Figure 1: si-craf but not si-braf sensitizes tumor cells to radiation. (a) Embryonic fibroblasts isolated from wildtype (WT), BRAF -/-, or CRAF -/- mice were irradiated (6 Gy) and DNA damage
Predictive PP1Ca binding region in BIG3 : 1,228 1,232aa (-KAVSF-) HEK293T cells *** *** *** KPL-3C cells - E E2 treatment time (h)
 HEK293T cells *** *** *** KPL-3C cells - E E2 treatment time (h)") Relative expression ERE-luciferase activity activity (pmole/min) activity (pmole/min) activity (pmole/min) activity (pmole/min) MCF-7 KPL-3C ZR--1 BT-474 T47D HCC15 KPL-1 HBC4 activity (pmole/min) a d
Relative expression ERE-luciferase activity activity (pmole/min) activity (pmole/min) activity (pmole/min) activity (pmole/min) MCF-7 KPL-3C ZR--1 BT-474 T47D HCC15 KPL-1 HBC4 activity (pmole/min) a d
Supplementary Figure S1 Targeted disruption and overexpression of Gpr43 in mice. (a) A targeting vector was constructed by ligation of 3 fragments:
 A targeting vector was constructed by ligation of 3 fragments:") Supplementary Figure S1 Targeted disruption and overexpression of Gpr43 in mice. (a) A targeting vector was constructed by ligation of 3 fragments: the 5' and 3' homology recombination arms and a fragment
Supplementary Figure S1 Targeted disruption and overexpression of Gpr43 in mice. (a) A targeting vector was constructed by ligation of 3 fragments: the 5' and 3' homology recombination arms and a fragment
Supplementary Information. Glycogen shortage during fasting triggers liver-brain-adipose. neurocircuitry to facilitate fat utilization
 Supplementary Information Glycogen shortage during fasting triggers liver-brain-adipose neurocircuitry to facilitate fat utilization Supplementary Figure S1. Liver-Brain-Adipose neurocircuitry Starvation
Supplementary Materials for
 www.sciencetranslationalmedicine.org/cgi/content/full/5/213/213ra164/dc1 Supplementary Materials for HIV-1 Vpr Induces Adipose Dysfunction in Vivo Through Reciprocal Effects on PPAR/GR Co-Regulation Neeti
Supplementary Figure 1. DNA methylation of the adiponectin promoter R1, Pparg2, and Tnfa promoter in adipocytes is not affected by obesity.
 Supplementary Figure 1. DNA methylation of the adiponectin promoter R1, Pparg2, and Tnfa promoter in adipocytes is not affected by obesity. (a) Relative amounts of adiponectin, Ppar 2, C/ebp, and Tnf mrna
SUPPLEMENTARY DATA Supplementary Figure 1. Body weight and fat mass of AdicerKO mice.
 SUPPLEMENTARY DATA Supplementary Figure 1. Body weight and fat mass of AdicerKO mice. Twelve week old mice were subjected to ad libitum (AL) or dietary restriction (DR) regimens for three months. (A) Body
SUPPLEMENTARY DATA. Supplementary Table 1. Primers used in qpcr
 Supplementary Table 1. Primers used in qpcr Gene forward primer (5'-3') reverse primer (5'-3') β-actin AGAGGGAAATCGTGCGTGAC CAATAGTGATGACCTGGCCGT Hif-p4h-2 CTGGGCAACTACAGGATAAAC GCGTCCCAGTCTTTATTTAGATA
doi: /nature14508 Rappsilber et al.
 SUPPLEMENTARY INFORMATION doi:1.138/nature1458 Grosso et al. Barbosa et al. 74 72 45 33 47 7 51 Rappsilber et al. Supplementary Figure 1 a, Venn-Diagram of identified splice factors in the work of Barbossa
Supplementary Figure 1: Additional metabolic parameters of obesity mouse models and controls. (a) Body weight, (b) blood glucose and (c) insulin
 Body weight, (b) blood glucose and (c) insulin") Supplementary Figure 1: Additional metabolic parameters of obesity mouse models and controls. (a) Body weight, (b) blood glucose and (c) insulin resistance index of homeostatic model assessment (HOMA IR)
Supplementary Figure 1: Additional metabolic parameters of obesity mouse models and controls. (a) Body weight, (b) blood glucose and (c) insulin resistance index of homeostatic model assessment (HOMA IR)
Supporting Information
 Supporting Information van der Windt et al. 10.1073/pnas.1221740110 SI Materials and Methods Mice and Reagents. C57BL/6 and major histocompatibility complex class I-restricted OVA-specific T-cell receptor
fl/+ KRas;Atg5 fl/+ KRas;Atg5 fl/fl KRas;Atg5 fl/fl KRas;Atg5 Supplementary Figure 1. Gene set enrichment analyses. (a) (b)
 (b)") KRas;At KRas;At KRas;At KRas;At a b Supplementary Figure 1. Gene set enrichment analyses. (a) GO gene sets (MSigDB v3. c5) enriched in KRas;Atg5 fl/+ as compared to KRas;Atg5 fl/fl tumors using gene set
KRas;At KRas;At KRas;At KRas;At a b Supplementary Figure 1. Gene set enrichment analyses. (a) GO gene sets (MSigDB v3. c5) enriched in KRas;Atg5 fl/+ as compared to KRas;Atg5 fl/fl tumors using gene set
Supplementary Figure 1
 Supplementary Figure 1. (A) Representative confocal analysis of cardiac mesenchymal cells from nondiabetic (ND-CMSC) and diabetic (D-CMSC) immunostained with anti-h3k9ac and anti-h3k27me3 antibodies. Analysis
Supplementary Figure 1.TRIM33 binds β-catenin in the nucleus. a & b, Co-IP of endogenous TRIM33 with β-catenin in HT-29 cells (a) and HEK 293T cells
 and HEK 293T cells") Supplementary Figure 1.TRIM33 binds β-catenin in the nucleus. a & b, Co-IP of endogenous TRIM33 with β-catenin in HT-29 cells (a) and HEK 293T cells (b). TRIM33 was immunoprecipitated, and the amount of
Supplementary Figure 1.TRIM33 binds β-catenin in the nucleus. a & b, Co-IP of endogenous TRIM33 with β-catenin in HT-29 cells (a) and HEK 293T cells (b). TRIM33 was immunoprecipitated, and the amount of
Supplementary Figure 1
 Supplementary Figure 1 YAP negatively regulates IFN- signaling. (a) Immunoblot analysis of Yap knockdown efficiency with sh-yap (#1 to #4 independent constructs) in Raw264.7 cells. (b) IFN- -Luc and PRDs
Supplementary Figure 1. A. Bar graph representing the expression levels of the 19 indicated genes in the microarrays analyses comparing human lung
 Supplementary Figure 1. A. Bar graph representing the expression levels of the 19 indicated genes in the microarrays analyses comparing human lung immortalized broncho-epithelial cells (AALE cells) expressing
Supplementary Figure 1. HOPX is hypermethylated in NPC. (a) Methylation levels of HOPX in Normal (n = 24) and NPC (n = 24) tissues from the
 Methylation levels of HOPX in Normal (n = 24) and NPC (n = 24) tissues from the") Supplementary Figure 1. HOPX is hypermethylated in NPC. (a) Methylation levels of HOPX in Normal (n = 24) and NPC (n = 24) tissues from the genome-wide methylation microarray data. Mean ± s.d.; Student
Supplementary Figure 1. HOPX is hypermethylated in NPC. (a) Methylation levels of HOPX in Normal (n = 24) and NPC (n = 24) tissues from the genome-wide methylation microarray data. Mean ± s.d.; Student
SUPPLEMENTARY DATA. Nature Medicine: doi: /nm.4171
 SUPPLEMENTARY DATA Supplementary Figure 1 a b c PF %Change - -4-6 Body weight Lean mass Body fat Tissue weight (g).4.3.2.1. PF GC iwat awat BAT PF d e f g week 2 week 3 NEFA (mmol/l) 1..5. PF phsl (Ser565)
Supplementary Table 1. Primer Sequences Used for Quantitative Real-Time PCR
 Supplementary Table 1. Primer Sequences Used for Quantitative Real-Time PCR Gene Forward Primer (5-3 ) Reverse Primer (5-3 ) cadl CTTGGGGGCGCGTCT CTGTTCTTTTGTGCCGTTTCG cyl-coenzyme Dehydrogenase, very
Supporting Information
 Supporting Information Charalambous et al. 10.1073/pnas.1406119111 SI Experimental Procedures Serum and Tissue Biochemistry. Enzymatic assay kits were used for determination of plasma FFAs (Roche), TAGs
Up-Regulation of Mitochondrial Activity and Acquirement of Brown Adipose Tissue-Like Property in the White Adipose Tissue of Fsp27 Deficient Mice
 Up-Regulation of Mitochondrial Activity and Acquirement of Brown Adipose Tissue-Like Property in the White Adipose Tissue of Fsp27 Deficient Mice Shen Yon Toh 1,2,3., Jingyi Gong 2., Guoli Du 2., John
Mfn2 deletion in brown adipose tissue protects from insulin resistance and impairs thermogenesis
 Article Mfn2 deletion in brown adipose tissue protects from insulin resistance and impairs thermogenesis Kiana Mahdaviani 1,2, Ilan Y Benador 1,2, Shi Su 1, Raffi A Gharakhanian 1, Linsey Stiles 1,2, Kyle
Supplementary Figure 1: Hsp60 / IEC mice are embryonically lethal (A) Light microscopic pictures show mouse embryos at developmental stage E12.
 Light microscopic pictures show mouse embryos at developmental stage E12.") Supplementary Figure 1: Hsp60 / IEC mice are embryonically lethal (A) Light microscopic pictures show mouse embryos at developmental stage E12.5 and E13.5 prepared from uteri of dams and subsequently genotyped.
Supplementary Figure 1: Hsp60 / IEC mice are embryonically lethal (A) Light microscopic pictures show mouse embryos at developmental stage E12.5 and E13.5 prepared from uteri of dams and subsequently genotyped.
Id1 Promotes Obesity by Suppressing Brown Adipose Thermogenesis and White Adipose Browning
 Diabetes Volume 66, June 2017 1611 Id1 Promotes Obesity by Suppressing Brown Adipose Thermogenesis and White Adipose Browning Mallikarjun Patil, Bal Krishan Sharma, Sawsan Elattar, Judith Chang, Shweta
ECM microenvironment unlocks brown adipogenic potential of adult human bone marrow-derived MSCs
 SUPPLEMENTARY INFORMATION ECM microenvironment unlocks brown adipogenic potential of adult human bone marrow-derived MSCs Michelle H. Lee 1,2,3,+, Anna G. Goralczyk 1,3,+, Rókus Kriszt 1,2,3, Xiu Min Ang
Nature Structural & Molecular Biology: doi: /nsmb Supplementary Figure 1. Generation and validation of mtef4-knockout mice.
 Supplementary Figure 1 Generation and validation of mtef4-knockout mice. (a) Alignment of EF4 (E. coli) with mouse, yeast and human EF4. (b) Domain structures of mouse mtef4 compared to those of EF4 (E.
Supplementary Figure 1 a
 Supplementary Figure a Normalized expression/tbp (A.U.).6... Trip-br transcripts Trans Trans Trans b..5. Trip-br Ctrl LPS Normalized expression/tbp (A.U.) c Trip-br transcripts. adipocytes.... Trans Trans
Supplementary Fig. 1. GPRC5A post-transcriptionally down-regulates EGFR expression. (a) Plot of the changes in steady state mrna levels versus
 Plot of the changes in steady state mrna levels versus") Supplementary Fig. 1. GPRC5A post-transcriptionally down-regulates EGFR expression. (a) Plot of the changes in steady state mrna levels versus changes in corresponding proteins between wild type and Gprc5a-/-
Supplementary Fig. 1. GPRC5A post-transcriptionally down-regulates EGFR expression. (a) Plot of the changes in steady state mrna levels versus changes in corresponding proteins between wild type and Gprc5a-/-
Breeding scheme, transgenes, histological analysis and site distribution of SB-mutagenized osteosarcoma.
 Supplementary Figure 1 Breeding scheme, transgenes, histological analysis and site distribution of SB-mutagenized osteosarcoma. (a) Breeding scheme. R26-LSL-SB11 homozygous mice were bred to Trp53 LSL-R270H/+
SUPPLEMENTARY INFORMATION
 DOI: 10.1038/ncb3311 A B TSC2 -/- MEFs C Rapa Hours WCL 0 6 12 24 36 pakt.s473 AKT ps6k S6K CM IGF-1 Recipient WCL - + - + - + pigf-1r IGF-1R pakt ps6 AKT D 1 st SILAC 2 nd SILAC E GAPDH FGF21 ALKPGVIQILGVK
PAX8-PPARγ Fusion Protein in thyroid carcinoma
 Sidney H. Ingbar Lecture, ATA 10/17/2013: PAX8-PPARγ Fusion Protein in thyroid carcinoma Ronald J. Koenig, MD, PhD Division of Metabolism, Endocrinology & Diabetes University of Michigan Learning Objectives
Supplementary Materials for
 www.sciencesignaling.org/cgi/content/full/6/264/rs4/dc1 Supplementary Materials for A Systems Approach for Decoding Mitochondrial Retrograde Signaling Pathways Sehyun Chae, Byung Yong Ahn, Kyunghee Byun,
Atg5 flox/flox ; CAG-Cre, 19M brain heart lung. spleen stomach colon. Takamura_Fig. S1
 Takamura_Fig. S1 brain heart lung spleen stomach colon kidney SM Supplemental Figure 1 Histological findings of tg5 flox/flox ;CG-Cre mouse tissues. H&E staining of the brain, heart, lung, spleen, stomach,
SUPPLEMENTARY INFORMATION
 DOI: 10.1038/ncb3461 In the format provided by the authors and unedited. Supplementary Figure 1 (associated to Figure 1). Cpeb4 gene-targeted mice develop liver steatosis. a, Immunoblot displaying CPEB4
SUPPLEMENTARY INFORMATION
 SUPPLEMENTARY INFORMATION doi:10.1038/nature11464 Supplemental Figure S1. The expression of Vegfb is increased in obese and diabetic mice as compared to lean mice. a-b, Body weight and postprandial blood
SUPPLEMENTARY INFORMATION
 SUPPLEMENTARY INFORMATION doi:10.1038/nature11429 S1a 6 7 8 9 Nlrc4 allele S1b Nlrc4 +/+ Nlrc4 +/F Nlrc4 F/F 9 Targeting construct 422 bp 273 bp FRT-neo-gb-PGK-FRT 3x.STOP S1c Nlrc4 +/+ Nlrc4 F/F casp1
(A) PCR primers (arrows) designed to distinguish wild type (P1+P2), targeted (P1+P2) and excised (P1+P3)14-
 PCR primers (arrows) designed to distinguish wild type (P1+P2), targeted (P1+P2) and excised (P1+P3)14-") 1 Supplemental Figure Legends Figure S1. Mammary tumors of ErbB2 KI mice with 14-3-3σ ablation have elevated ErbB2 transcript levels and cell proliferation (A) PCR primers (arrows) designed to distinguish
1 Supplemental Figure Legends Figure S1. Mammary tumors of ErbB2 KI mice with 14-3-3σ ablation have elevated ErbB2 transcript levels and cell proliferation (A) PCR primers (arrows) designed to distinguish
Supporting Information Table of content
 Supporting Information Table of content Supporting Information Fig. S1 Supporting Information Fig. S2 Supporting Information Fig. S3 Supporting Information Fig. S4 Supporting Information Fig. S5 Supporting
Supplementary information
 Supplementary information High fat diet-induced changes of mouse hepatic transcription and enhancer activity can be reversed by subsequent weight loss Majken Siersbæk, Lyuba Varticovski, Shutong Yang,
Supplementary Figure S1. Generation of LSL-EZH2 conditional transgenic mice.
 Downstream Col1A locus S P P P EP Genotyping with P1, P2 frt PGKneopA + frt hygro-pa Targeting vector Genotyping with P3, P4 P1 pcag-flpe P2 P3 P4 frt SApA CAG LSL PGKATG frt hygro-pa C. D. E. ormal KRAS
Supplementary Materials
 Supplementary Materials 1 Supplementary Table 1. List of primers used for quantitative PCR analysis. Gene name Gene symbol Accession IDs Sequence range Product Primer sequences size (bp) β-actin Actb gi
A Hepatocyte Growth Factor Receptor (Met) Insulin Receptor hybrid governs hepatic glucose metabolism SUPPLEMENTARY FIGURES, LEGENDS AND METHODS
 Insulin Receptor hybrid governs hepatic glucose metabolism SUPPLEMENTARY FIGURES, LEGENDS AND METHODS") A Hepatocyte Growth Factor Receptor (Met) Insulin Receptor hybrid governs hepatic glucose metabolism Arlee Fafalios, Jihong Ma, Xinping Tan, John Stoops, Jianhua Luo, Marie C. DeFrances and Reza Zarnegar
A Hepatocyte Growth Factor Receptor (Met) Insulin Receptor hybrid governs hepatic glucose metabolism Arlee Fafalios, Jihong Ma, Xinping Tan, John Stoops, Jianhua Luo, Marie C. DeFrances and Reza Zarnegar
Supplemental Information. Induction of Expansion and Folding. in Human Cerebral Organoids
 Cell Stem Cell, Volume 20 Supplemental Information Induction of Expansion and Folding in Human Cerebral Organoids Yun Li, Julien Muffat, Attya Omer, Irene Bosch, Madeline A. Lancaster, Mriganka Sur, Lee
Supplementary Information Supplementary Fig. 1. Elevated Usp9x in melanoma and NRAS mutant melanoma cells are dependent on NRAS for 3D growth.
 Supplementary Information Supplementary Fig. 1. Elevated Usp9x in melanoma and NRAS mutant melanoma cells are dependent on NRAS for 3D growth. a. Immunoblot for Usp9x protein in NRAS mutant melanoma cells
SUPPLEMENTARY INFORMATION. Supplementary Figures S1-S9. Supplementary Methods
 SUPPLEMENTARY INFORMATION SUMO1 modification of PTEN regulates tumorigenesis by controlling its association with the plasma membrane Jian Huang 1,2#, Jie Yan 1,2#, Jian Zhang 3#, Shiguo Zhu 1, Yanli Wang
SUPPLEMENTARY FIGURES
 SUPPLEMENTARY FIGURES Figure S1. Clinical significance of ZNF322A overexpression in Caucasian lung cancer patients. (A) Representative immunohistochemistry images of ZNF322A protein expression in tissue
Table S1. Primer sequences used for qrt-pcr. CACCATTGGCAATGAGCGGTTC AGGTCTTTGCGGATGTCCACGT ACTB AAGTCCATGTGCTGGCAGCACT ATCACCACTCCGAAGTCCGTCT LCOR
 Table S1. Primer sequences used for qrt-pcr. ACTB LCOR KLF6 CTBP1 CDKN1A CDH1 ATF3 PLAU MMP9 TFPI2 CACCATTGGCAATGAGCGGTTC AGGTCTTTGCGGATGTCCACGT AAGTCCATGTGCTGGCAGCACT ATCACCACTCCGAAGTCCGTCT CGGCTGCAGGAAAGTTTACA
Supplemental Table 1 Primer sequences (mouse) used for real-time qrt-pcr studies
 used for real-time qrt-pcr studies") Supplemental Table 1 Primer sequences (mouse) used for real-time qrt-pcr studies Gene symbol Forward primer Reverse primer ACC1 5'-TGAGGAGGACCGCATTTATC 5'-GCATGGAATGGCAGTAAGGT ACLY 5'-GACACCATCTGTGATCTTG
Supplemental Table 1 Primer sequences (mouse) used for real-time qrt-pcr studies Gene symbol Forward primer Reverse primer ACC1 5'-TGAGGAGGACCGCATTTATC 5'-GCATGGAATGGCAGTAAGGT ACLY 5'-GACACCATCTGTGATCTTG
Boucher et al NCOMMS B
 1 Supplementary Figure 1 (linked to Figure 1). mvegfr1 constitutively internalizes in endothelial cells. (a) Immunoblot of mflt1 from undifferentiated mouse embryonic stem (ES) cells with indicated genotypes;
Nature Structural & Molecular Biology: doi: /nsmb Supplementary Figure 1. Differential expression of mirnas from the pri-mir-17-92a locus.
 Supplementary Figure 1 Differential expression of mirnas from the pri-mir-17-92a locus. (a) The mir-17-92a expression unit in the third intron of the host mir-17hg transcript. (b,c) Impact of knockdown